|
|
|
MEMP Homepage |
MEMP Phase I Final Report
|
This report presents the preliminary analysis of the MEMP socio-economic survey, which was carried out in August 1995. The survey enumerated a broad range of socio-economic conditions in smallholder households who farmed fields (either burley tobacco or other crops) in the MEMP catchment areas. The survey collected basic household data to facilitate analysis of (a)how burley tobacco production among smallholder farmers is affecting household economic conditions, (b) the ways that broader socio-economic conditions are affecting the adoption of burley production among smallholders, and (b) the consequences for the use of natural resources.
The analysis presented in this report covers several of the topics identified by MEMP staff as having particular relevance to current interests and concerns of the project. However, the issues discussed herein by no means exhaust the topics of analysis that can be pursued using the data collected in the socio-economic survey. More detailed information on household demographics, patterns of migration and settlement, crop production, food security, landholdings, income strategies, and resource management are available in the database.
This document focuses on patterns of agricultural production, relative wealth of burley growers, food security, land acquisition and fallowing, and use of forest products. Overall, the findings in the survey appear to confirm previous assessments of the relationships between burley production and smallholder wealth, food security, and resource management. In general, burley growers tend to be the wealthier smallholders who are more secure in their food supplies, and who are least likely to face serious problems of resource scarcity. The survey does not reveal major recent changes in overall patterns of agricultural production, although many former burley growers appear to have stopped this year, mainly due to problems related to shortages of fertilizer. Moreover, the survey suggests that overall patterns of land acquisition are similar for burley and non-burley households, although there appears to be a positive association between greater wealth and acquisition of land through the husband�s family. Although patterns of acquisition are generally similar, patterns of land use do appear to differ, with burley growers typically leaving less land fallow than non-burley households. Burley growers also have a particularly high demand for certain wood products, especially poles for constructing burley drying sheds.
The survey consisted of a questionnaire administered to 120 households in four MEMP catchments: Kamundi (Mangochi), Njolomole (Ntcheu), Chulu (Kasungu), and Chilindamaji (Nkhata Bay). Wherever possible, the interview was conducted with both the head of the household present as well as his or her spouse. The sample included 60 households that were initially identified as smallholders who grew burley in the 1994-95 season, who held any fields (including crops other than burley) in the MEMP catchments. An equal number of non-burley-growing households was selected randomly for purposes of comparison. Two of the households that were initially identified as burley growers had in fact ceased to grow burley this year, and were recoded as non-burley-growers. Thus, the sample consists of 58 burley growing households and 62 non-burley households. The survey was conducted by a team of four research assistants from the Centre for Social Research at the University of Malawi, and was administered by the Harvard Institute for International Development (HIID).
Most smallholder farmers in Malawi, including burley growers, pursue a strategy of diversified agricultural production, which includes combinations of hybrid and local maize, cassava, sunflower, legumes, vegetables, fruits, and tobacco. Most of these crops can be used for both home consumption and for cash sales. The impact of burley production on smallholder household economy must be considered in light of ongoing efforts by smallholders to maintain diversified production. None of the smallholder burley growers in the MEMP survey engage solely in burley production, and most allocate only a portion of their available land and capital to burley production. Thus, burley represents only one among a number of strategies for generating income even among burley growers. There is no clear evidence of a shift toward increased allocation of resources to burley production. Although more research is needed, there is some evidence of decreasing interest in burley production, particularly as a result of recent steep increases in fertilizer prices.
2.1 Burley as a source of smallholder income
|
|
|
Figure 1. Primary sources of household income across surveyed households.
Burley is an important source of cash for those smallholder farmers who grow it, but it is not the only source (Figure 1). In the MEMP socio-economic survey, smallholders were asked to identify the most important sources of income in their households, and to rank these in relation to each other. Among those who grew burley, two-thirds (67 percent) identified it as their most important source of cash income. The other third of burley growers identified burley as being less important as source of cash than maize or vegetables (Table 1). The relative importance of burley also appears to vary across catchments. In three of the four catchments, burley was reported as the primary source of cash among burley growers. The exception was Njolomole, where sales of vegetables were most frequently cited as the primary source of cash even in burley growing households. Burley was reported as the most important source of cash by only 22 percent of Njolomole burley growers (Table 2). Among non-burley-growing households, sales of vegetables, temporary agricultural labor (ganyu), and sales of other crops were identified as the most important source of household income.
It is important to stress that while burley is the most important source of cash income, it is not necessarily the main source of livelihood even among burley growers. All burley growers in the MEMP sample also grew maize (or, in Nkhata Bay, cassava) as a food staple, as well as combinations of legumes, tubers, vegetables, and fruits.
This fact is reflected in the distribution of smallholder land among a number of crops. Measurements of individual fields and plots are not available, so it is not possible to reliably assess what proportion of land area smallholder burley growers devote to burley production. However, the MEMP socio-economic survey enumerated the number of fields and plots held by smallholders, and which crops were grown in each. These data support the qualitative impression of the HIID survey team that for the most part smallholder burley growers only allocate a portion of their land (and, presumably, labor) to burley production. On average, respondents in the survey hold 2.3 fields, and a total of at least 3.4 individual plots (that is, about half of all fields are subdivided into plots in which different crops such as burley or maize are grown; Table 3). Burley-growing households hold an average of 2.5 fields and 4.1 plots; of these plots, an average of 1.1 are devoted to burley production, compared to 1.5 plots devoted to maize production (Table 4). This gives weight to the qualitative assessment of the HIID team that burley production does not generally take priority over food production in smallholder livelihood strategies.
2.3 Indications of change in burley production
There is little evidence that a large number of smallholders are shifting into burley production, and there are reasons to believe that the number of smallholder burley growers is unlikely to expand significantly under present conditions of increasing fertilizer prices and the collapse and abuse of some burley clubs. The MEMP socio-economic survey recorded a number of non-burley growers who had previously grown burley but stopped because of problems related to credit and fertilizer. A very high proportion of those identified as burley growers in 1994-95 had begun only this past season (Table 5), and in the Njolomole site only a handful of the farmers who were recorded as growing burley in 1993-94 also grew it in 1994-95, suggesting a high rate of failure and turnover among smallholder burley growers.
The reasons for failure in burley growing mainly involve problems of fertilizer and credit, although poor rains have also played a part. Smallholders complained that burley clubs (which are intended to provide credit for inputs, particularly fertilizer) had collapsed due to non-payment of debts and because of disputes over the distribution of profits from sales at auction floors. These problems were recorded in 1994 at Njolomole, and continue to represent a significant barrier to participation in burley production. At Chulu, a very large number of farmers who were identified as having started burley nurseries in the Fall 1994 planting season ended up harvesting no burley at all because of the failure of local clubs to provide fertilizer on terms that were acceptable to local farmers. The number of farmers who attempted and failed in their efforts to grow burley in the Chulu catchment possibly exceeds the number who succeeded. In all catchments, people also complained about unpredictable rainfall. In addition, the recent removal of fertilizer subsidies has put purchases of fertilizer beyond the reach of even relatively wealthy smallholders. Despite these problems, smallholder interest in burley production remains high, especially following the relatively good prices of the last season. But without improved access to credit and/or lower fertilizer prices, the number of smallholders growing burley is likely to remain limited.
3.1 Relation between burley growing and smallholder wealth
Smallholder farmers who grow burley are, on the whole, wealthier than non-burley growers. Using the HIID wealth index based on enumeration of household assets, a statistically significant difference is found between burley and non-burley households (significant at the 3.7 percent confidence level; Table 6). This relationship is demonstrated by the predominance of non-burley households (70 percent) in the lowest wealth quartile, whereas most of the wealthiest smallholders (63 percent) are burley growers. In the mid-level wealth quartiles, households are equally likely to be burley or non-burley growers (Table 7). Thus, while burley growing is not always associated with greater wealth, there is a clear and statistically significant tendency for burley production to be associated with relative affluence among smallholders.

Figure 2. Wealth quartiles for all surveyed households.
3.2 Interpreting the relationship between wealth and burley-growing
The finding that wealth is statistically related to burley growing is not surprising, given considerable qualitative evidence that burley growers are generally among the wealthiest of smallholder farmers. However, the statistics say little about the nature of this relationship. In the absence of baseline socio-economic data collected before the MEMP households began to grow tobacco, it is not possible to definitively answer whether smallholder burley growers became wealthy because they grew burley, or whether they grew burley because they were already wealthy. Qualitative assessment, from both the MEMP socio-economic survey and from other socio-economic analyses, suggests that both interpretations may be true. For the most part, the poorest smallholders are unable or unwilling to invest substantial resources in the potentially lucrative but risky practice of burley cultivation. There is some evidence (particularly in the Chulu and Njolomole catchments) that considerable numbers of poorer smallholders actually were made worse off by investing in failed burley production. However, among those who succeeded in growing burley, many volunteered to the HIID team that their economic conditions have improved because of burley. Thus, it would appear that generally it is the smallholders in the middle and upper economic quartiles who are most likely to grow burley, and that some portion of these find that burley has contributed to increased wealth.
3.3 Relation between burley production and wealth in individual catchments
The relationship between burley production and relatively greater wealth among smallholders is present in three out of the four MEMP catchments (Table 8). The one exception to this trend is the Njolomole site. (Notably, when Njolomole is dropped from the analysis of variance significance test, the significance of the positive relationship between burley production and wealth increases to a level of 0.15 percent; Table 9.)
Finding the exact reasons for this contradictory trend in Njolomole would require more in-depth field work. However, several unusual circumstances may be involved. First, there appears to be a pattern of patron-client burley production between a local estate owner and 7 out of 13 of the burley growers in the Njolomole area. Relatively poor smallholders receive credit for fertilizer from Mr. Thawatha, a local estate owner. Mr. Thawatha then buys the burley from the smallholders and sells it on the auction floors. Several smallholders complained that Mr. Thawatha "cheats" them by not giving them a fair return on their tobacco sales. Another cause of the negative relationship between wealth and burley production is the continuing problems of the burley clubs in this area, which have broken down due to previous failures to pay back credit. In addition, the Ntcheu area has a very active trade in vegetables for urban markets, and a large portion of the wealthiest farmers in the area turn to vegetables, rather than tobacco, for earning cash. Thus, the combination of the availability of private credit to poor farmers for burley production, the breakdown of clubs, and the availability of a more attractive option for earning cash among wealthier smallholders may be making burley production relatively more attractive to poorer farmers and less attractive to wealthier farmers than in other areas.
3.4 Comparing overall wealth in the four catchments
Overall, the four MEMP catchments are generally comparable in their level of wealth. As estimated by the HIID wealth index, the Chilindamaji catchment is recorded as the wealthiest, followed by Chulu, Ntcheu, and Kamundi (Table 10). The relative wealth of the Chilindamaji catchment may be related to the local availability of cash income through fishing. Similarly, the wealth of Chulu may be related to the generally high level of wealth in the Kasungu area due to the dominance of estate tobacco in the local economy
Burley production does not appear to be strongly related to household food production. Overall, households in the MEMP sample, excluding Chilindamaji (see below), produced an average of 249 kilograms per capita of their own maize (Table 11). Burley growers grew slightly more maize than non-burley households (Table 12), though this difference is not statistically significant (Table 13).
|
|
|
Figure 3. Maize stores across all surveyed households.
Own maize production, however, is not the same thing as food security. Smallholders also buy and sell maize. Because of their greater income, burley producers are presumably in a better position to buy maize. The effect of burley production on maize sales is, however, uncertain. These issues are beyond the scope of the MEMP socio-economic survey. In both the 1994-95 and 1995-96 seasons, burley households reported that they ran out or expect to run out of their own-produced maize later in the season, and a higher proportion of burley households report having purchased maize or expect to buy maize, presumably reflecting their greater disposable income (Table 14; Figure 3).
The Chilindamaji catchment was excluded from the present analysis of food security because smallholders in the Nkhata Bay area generally rely more heavily on cassava than on maize. This makes comparisons of food security between Chilindamaji and the other catchments analytically difficult. This is particularly true because there is no reliable way to estimate cassava production. Unlike maize, cassava is harvested on an on-going basis throughout the year, and it is rarely stored in a central location such as the nkhokwe (granary) typically used to store maize. More commonly, smallholders harvest small amounts of cassava and eat it directly from the field, making reliable estimation of annual harvests exceedingly difficult.
Most fields held by smallholders in the MEMP catchment areas are acquired through the husband�s family, the village head, or the wife�s family. Other sources include borrowed land, land given by friends or neighbors, land that is rented, and land that is newly opened (Table 15; Figure 4). This pattern appears to vary by catchment, with land acquired through the wife�s family being particularly important in Njolomole, and less so in Kamundi. No fields were acquired through the wife�s family in either of the northern catchments in Kasungu and Chilindamaji (Table 16). There also appears to be a positive association between both wealth and burley production and acquisition of land through the husband�s family (Tables 17 and 18). Among households in the lower two wealth quartiles, one-third of all fields were acquired through the wife�s family, compared to less than 7 percent of fields in the upper wealth groups. In the upper wealth groups (hence among burley growers), 85 percent of fields are acquired through the husband�s family or through village headmen. The reasons for these associations remain to be explored, but it is likely that these at least in part reflect the greater overall wealth in the two northern catchments, where no fields were acquired through the wife�s family.

Figure 4. Land acquisition across all households.

Figure 5. Reasons for allowing fields to remain fallow.
One somewhat surprising finding of the MEMP socio-economic survey is that a substantial number of fields held by smallholder households are left fallow � 45 out of 273 total fields in the survey, or 16 percent. Without having area calculations for these fields, it is not possible to assess what proportion of acreage this represents. Nevertheless, this is surprising considering the general scarcity of land in Malawi, particularly in the south. However, the MEMP survey also shows that the primary reasons for leaving land fallow are shortage of labor, money, or illness (Table 19; Figure 5). Only 13 percent of fields are left fallow for the main purpose of re-generating soil quality. Moreover, the other reasons that smallholders reported for leaving fields fallow include the fact that the fields are "too big" to cultivate completely, the fields are newly acquired, and that the quality of the fields is poor. These factors all in turn relate back to shortages of labor or capital to invest in fully cultivating fields.
The importance of labor and capital shortages as a reason for fallowing land may explain the general tendency for burley-growers (who are wealthier and in a better position to purchase labor) to leave a somewhat lower proportion of their fields (15 percent) fallow than non-burley growers (19 percent). Generally, the reasons that burley growers reported for leaving fields fallow are similar to those of non-burley households, although burley growers were the only people who cited poor quality of soil as a primary reason for not cultivating fields (Table 20). This may relate to the high nutrient demands of tobacco plants. Across catchments, the reasons cited for not cultivating fields are generally similar, with the main reasons being shortages of labor and capital, although the small number of fallow fields when divided across four catchments makes any quantitative assessment somewhat tentative (Table 21).
The HIID socio-economic survey team combined efforts with the Department of Forestry in carrying out the Forest Products Utilization Inventory (Annex 2). This inventory enumerated the main uses of forest products, the preferred species for each type of use, perceptions of scarcity, and actions taken in response to declining availability of forest products.
|
|
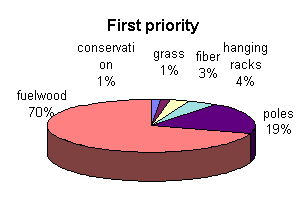
Figure 6. Priority uses for forest products.
Respondents were asked to identify the most important products that they get from local woodlands in order of priority (Figure 6). Respondents often identified as many as half a dozen priority uses. Burley and non-burley households shared very similar priorities, with fuelwood being the overwhelming first priority, and poles being the dominant second priority. Rope, fiber, poles, and timber were the most frequently identified third-priority uses. Other uses identified in each level of priority include hanging racks for tobacco sheds, grass, fruit, medicine, and conservation (Table 22).
The MEMP socio-economic survey recorded a very large number of preferred species for each type of forest product (Table 23). Overall, 134 separate species were recorded. In tabulating the total number of "preferred" species for all uses, there are no species that account for more than about 9 percent of the total number of responses. However, some of the most widely mentioned species include mtondo, msolo, muwanga, kamphoni, msuku, and mpapa. Similarly, for specific wood uses there were no species that were mentioned as being the single most important. For fuelwood, for example, mtondo (20 percent of responses), chiombo (7.9 percent) and kamphoni (7.9 percent) were identified as the most widely preferred species, although another 52 species were recorded as preferred species for fuelwood. Likewise, for poles the most commonly cited preferred species include msolo (10.5 percent) and muwanga (7.5 percent), although another 64 species were recorded as being preferred for poles (Table 24). Notably, although a few people did mention eucalyptus and other exotics, these species are not among the most preferred for any of the most important forest products identified by smallholders in the MEMP catchments.
Table 1. Primary Source of Income by Burley, Non-Burley Households
-> burley= 0 (no)
income1| Freq. Percent Cum.
------------+-----------------------------------
maize sales | 5 8.33 8.33
sunflower 7 | 5 8.33 16.67
cassava | 5 8.33 25.00
beans | 1 1.67 26.67
tomatoes | 1 1.67 28.33
vegetables | 11 18.33 46.67
other tobac.| 1 1.67 48.33
other crop | 2 3.33 51.67
sell beer | 1 1.67 53.33
fish monger | 2 3.33 56.67
other retail| 2 3.33 60.00
grass,fwd,et| 2 3.33 63.33
artisan | 2 3.33 66.67
non-ag labor| 5 8.33 75.00
estate labor| 2 3.33 78.33
ganyu | 10 16.67 95.00
remittances | 3 5.00 100.00
------------+-----------------------------------
Total | 60 100.00
-> burley= 1 (yes)
income1| Freq. Percent Cum.
------------+-----------------------------------
maize | 1 1.82 1.82
beans | 1 1.82 3.64
tomatoes | 1 1.82 5.45
vegetables | 4 7.27 12.73
bananas | 1 1.82 14.55
burley | 37 67.27 81.82
other crop | 1 1.82 83.64
selling beer| 1 1.82 85.45
selling fish| 1 1.82 87.27
grass,fwd,et| 1 1.82 89.09
artisan | 2 3.64 92.73
non-ag labor| 1 1.82 94.55
ganyu | 1 1.82 96.36
got rent | 1 1.82 98.18
remittances | 1 1.82 100.00
------------+-----------------------------------
Total | 55 100.00
Table 2. Primary Source of Income in Burley Households in Each Catchment
-> burley= yes catchmnt= Kamundi
income1| Freq. Percent Cum.
------------+-----------------------------------
tomatoes | 1 4.55 4.55
burley | 18 81.82 86.36
other crops | 1 4.55 90.91
non-ag labor| 1 4.55 95.45
remittances | 1 4.55 100.00
------------+-----------------------------------
Total | 22 100.00
-> burley= yes catchmnt= Njolomole
income1| Freq. Percent Cum.
------------+-----------------------------------
beans | 1 11.11 11.11
vegetables | 3 33.33 44.44
burley | 2 22.22 66.67
brewing beer| 1 11.11 77.78
artisan | 1 11.11 88.89
ganyu | 1 11.11 100.00
------------+-----------------------------------
Total | 9 100.00
-> burley= yes catchmnt= Chulu
income1| Freq. Percent Cum.
------------+-----------------------------------
maize | 1 5.56 5.56
vegetables | 1 5.56 11.11
bananas | 1 5.56 16.67
burley | 12 66.67 83.33
fish monger | 1 5.56 88.89
artisan | 1 5.56 94.44
got rent | 1 5.56 100.00
------------+-----------------------------------
Total | 18 100.00
-> burley= yes catchmnt= Chilindamaji
income1| Freq. Percent Cum.
------------+-----------------------------------
burley | 5 83.33 83.33
grass,fwd,et| 1 16.67 100.00
------------+-----------------------------------
Total | 6 100.00
Table 3. Number of Fields and Plots
Variable | Obs Mean Std. Dev. Min Max
---------+-----------------------------------------------------
fields | 120 2.275 1.180817 0 6
plots | 120 3.433333 2.172143 0 12
brlyplts | 53 1.09434 .2950978 1 2
maizplts | 113 1.513274 .6958428 1 5
Table 4. Number of Fields and Plots by Burley, Non-Burley Households
-> burley= 0
Variable | Obs Mean Std. Dev. Min Max
---------+-----------------------------------------------------
fields | 62 2.080645 1.135109 0 6
plots | 62 2.854839 1.880415 0 10
brlyplts | 1 2 . 2 2
maizplts | 58 1.517241 .7312901 1 5
-> burley= 1
Variable | Obs Mean Std. Dev. Min Max
---------+-----------------------------------------------------
fields | 58 2.482759 1.202941 1 6
plots | 58 4.051724 2.305009 1 12
brlyplts | 52 1.076923 .2690691 1 2
maizplts | 55 1.509091 .6631219 1 3
Table 5. When Households First Started Growing Burley
-> burley=1
Years|
growing|
burley| Freq. Percent Cum.
------------+-----------------------------------
1 | 17 29.31 29.31
2 | 6 10.34 39.66
3 | 22 37.93 77.59
4 | 5 8.62 86.21
5 | 6 10.34 96.55
8 | 1 1.72 98.28
12 | 1 1.72 100.00
------------+-----------------------------------
Total | 58 100.00
Table 6. Association of Wealth and Burley Production
Analysis of Variance
Source SS df MS F Prob > F
------------------------------------------------------------------------
Between groups 583926.327 1 583926.327 4.46 0.0369
Within groups 15457317.4 118 130994.215
------------------------------------------------------------------------
Total 16041243.7 119 134800.367
Table 7. Burley Production by Wealth Quartiles
-> Wealth quartile=1 (poorest)
burley| Freq. Percent Cum.
------------+-----------------------------------
0 | 21 70.00 70.00
1 | 9 30.00 100.00
------------+-----------------------------------
Total | 30 100.00
-> Wealth quartile=2
burley| Freq. Percent Cum.
------------+-----------------------------------
0 | 15 50.00 50.00
1 | 15 50.00 100.00
------------+-----------------------------------
Total | 30 100.00
-> Wealth quartile=3
burley| Freq. Percent Cum.
------------+-----------------------------------
0 | 15 50.00 50.00
1 | 15 50.00 100.00
------------+-----------------------------------
Total | 30 100.00
-> Wealth quartile=4
burley| Freq. Percent Cum.
------------+-----------------------------------
0 | 11 36.67 36.67
1 | 19 63.33 100.00
------------+-----------------------------------
Total | 30 100.00
Table 8. Burley by Wealth in Individual Catchments
-> catchmnt=Kamundi burley=0
Variable | Obs Mean Std. Dev. Min Max
---------+-----------------------------------------------------
assets | 22 268 200 49 887
-> catchmnt=Kamundi burley=1
Variable | Obs Mean Std. Dev. Min Max
---------+-----------------------------------------------------
assets | 22 457 421 46 1841
-> catchmnt=Njolomole burley=0
Variable | Obs Mean Std. Dev. Min Max
---------+-----------------------------------------------------
assets | 15 477 602 47 2479
-> catchmnt=Njolomole burley=1
Variable | Obs Mean Std. Dev. Min Max
---------+-----------------------------------------------------
assets | 11 341 205 133 781
-> catchmnt=Chulu burley=0
Variable | Obs Mean Std. Dev. Min Max
---------+-----------------------------------------------------
assets | 18 331 282 13 941
-> catchmnt=Chulu burley=1
Variable | Obs Mean Std. Dev. Min Max
---------+-----------------------------------------------------
assets | 18 548 383 103 1881
-> catchmnt=Chilindamaji burley=0
Variable | Obs Mean Std. Dev. Min Max
---------+-----------------------------------------------------
assets | 7 303 174 22 536
-> catchmnt=Chilindamaji burley=1
Variable | Obs Mean Std. Dev. Min Max
---------+-----------------------------------------------------
assets | 7 597 304 317 1214
Table 9. Significance Test for Burley Production and Wealth without Njolomole
Analysis of Variance
Source SS df MS F Prob > F
------------------------------------------------------------------------
Between groups 1090807.19 1 1090807.19 10.75 0.0015
Within groups 9332888.13 92 101444.436
------------------------------------------------------------------------
Total 10423695.3 93 112082.745
Table 10. Wealth by Catchment
-> catchmnt=Kamundi
Variable | Obs Mean Std. Dev. Min Max
---------+-----------------------------------------------------
assets | 44 362 340 46 1841
-> catchmnt=Njolomole
Variable | Obs Mean Std. Dev. Min Max
---------+-----------------------------------------------------
assets | 26 419 474 47 2479
-> catchmnt=Chulu
Variable | Obs Mean Std. Dev. Min Max
---------+-----------------------------------------------------
assets | 36 440 349 13 1881
-> catchmnt=Chilindamaji
Variable | Obs Mean Std. Dev. Min Max
---------+-----------------------------------------------------
assets | 14 450 283 22 1214
Table 11. Overall Maize Production (kg)
Variable | Obs Mean Std. Dev. Min Max
---------+-----------------------------------------------------
pcmzprod | 103 248.8932 278.5632 0 1556
Table 12. Maize Production by Burley, Non-Burley Household (kg)
-> burley= 0
Variable | Obs Mean Std. Dev. Min Max
---------+-----------------------------------------------------
pcmzprod | 54 241.7963 306.9275 0 1556
-> burley= 1
Variable | Obs Mean Std. Dev. Min Max
---------+-----------------------------------------------------
pcmzprod | 49 256.7143 246.4915 10 1266
Table 13. Significance Test for Relationship between Burley and Maize Production
Analysis of Variance
Source SS df MS F Prob > F
------------------------------------------------------------------------
Between groups 5717.06598 1 5717.06598 0.07 0.7876
Within groups 7909224.76 101 78309.156
------------------------------------------------------------------------
Total 7914941.83 102 77597.4689
Table 14. Maize Purchases in Burley, Non-Burley Households
-> burley= 0
bghtmaiz| Freq. Percent Cum.
------------+-----------------------------------
0 | 32 59.26 59.26
1 | 22 40.74 100.00
------------+-----------------------------------
Total | 54 100.00
-> burley= 1
bghtmaiz| Freq. Percent Cum.
------------+-----------------------------------
0 | 21 42.00 42.00
1 | 29 58.00 100.00
------------+-----------------------------------
Total | 50 100.00
1994-95 Households who expect to buy maize
-> burley= 0
bghtmaiz| Freq. Percent Cum.
------------+-----------------------------------
0 | 16 29.63 29.63
1 | 38 70.37 100.00
------------+-----------------------------------
Total | 54 100.00
-> burley= 1
bghtmaiz| Freq. Percent Cum.
------------+-----------------------------------
0 | 11 22.45 22.45
1 | 38 77.55 100.00
------------+-----------------------------------
Total | 49 100.00
Table 15. Sources of Land
. tabulate sourcecd
sourcecd| Freq. Percent Cum.
------------+-----------------------------------
wife�s famil| 49 19.14 19.14
husband�s fa| 132 51.56 70.70
chief | 56 21.88 92.58
borrowed | 4 1.56 94.14
neighbors | 3 1.17 95.31
rented | 2 0.78 96.09
new land | 8 3.12 99.22
other | 2 0.78 100.00
------------+-----------------------------------
Total | 256 100.00
Table 16. Land Sources by Catchment
-> catchmnt= Kamundi
sourcecd| Freq. Percent Cum.
------------+-----------------------------------
wife�s famil| 20 25.32 25.32
husband�s fa| 29 36.71 62.03
chief | 26 32.91 94.94
borrowed | 3 3.80 98.73
other | 1 1.27 100.00
------------+-----------------------------------
Total | 79 100.00
-> catchmnt= Njolomole
sourcecd| Freq. Percent Cum.
------------+-----------------------------------
wife�s famil| 29 50.00 50.00
husband�s | 23 39.66 89.66
chief | 2 3.45 93.10
borrowed | 1 1.72 94.83
neighbors | 1 1.72 96.55
rented | 2 3.45 100.00
------------+-----------------------------------
Total | 58 100.00
-> catchmnt= Chulu
sourcecd| Freq. Percent Cum.
------------+-----------------------------------
husband�s fa| 56 67.47 67.47
chief | 17 20.48 87.95
neighbors | 2 2.41 90.36
new land | 8 9.64 100.00
------------+-----------------------------------
Total | 83 100.00
-> catchmnt= Chilindamaji
sourcecd| Freq. Percent Cum.
------------+-----------------------------------
husband�s fa| 24 66.67 66.67
chief | 11 30.56 97.22
neighbors | 1 2.78 100.00
------------+-----------------------------------
Total | 36 100.00
Table 17. Land Sources by Wealth Ranking
-> mempgrup= 1 (poorest)
sourcecd| Freq. Percent Cum.
------------+-----------------------------------
wife�s famil| 10 17.54 17.54
husband�s fa| 28 49.12 66.67
chief | 16 28.07 94.74
borrowed | 1 1.75 96.49
new land | 2 3.51 100.00
------------+-----------------------------------
Total | 57 100.00
-> mempgrup= 2
sourcecd| Freq. Percent Cum.
------------+-----------------------------------
wife�s famil| 30 48.39 48.39
husband�s | 16 25.81 74.19
chief | 12 19.35 93.55
borrowed | 2 3.23 96.77
rented | 2 3.23 100.00
------------+-----------------------------------
Total | 62 100.00
-> mempgrup= 3
sourcecd| Freq. Percent Cum.
------------+-----------------------------------
wife�s famil| 6 9.23 9.23
husband�s fa| 40 61.54 70.77
chief | 11 16.92 87.69
borrowed | 1 1.54 89.23
neighbors | 2 3.08 92.31
new land | 5 7.69 100.00
------------+-----------------------------------
Total | 65 100.00
-> mempgrup= 4 (wealthiest)
sourcecd| Freq. Percent Cum.
------------+-----------------------------------
wife�s famil| 3 4.17 4.17
husband�s fa| 48 66.67 70.83
chief | 17 23.61 94.44
neighbors | 1 1.39 95.83
new land | 1 1.39 97.22
other | 2 2.78 100.00
------------+-----------------------------------
Total | 72 100.00
Table 18. Land Sources by Burley, Non-Burley Households
-> burley= 0
sourcecd| Freq. Percent Cum.
------------+-----------------------------------
wife�s famil| 31 25.62 25.62
husband�s fa| 61 50.41 76.03
chief | 17 14.05 90.08
borrowed | 2 1.65 91.74
neighbors | 1 0.83 92.56
rented | 2 1.65 94.21
new land | 5 4.13 98.35
other | 2 1.65 100.00
------------+-----------------------------------
Total | 121 100.00
-> burley= 1
sourcecd| Freq. Percent Cum.
------------+-----------------------------------
wife�s famil| 18 13.33 13.33
husband�s fa| 71 52.59 65.93
chief | 39 28.89 94.81
borrowed | 2 1.48 96.30
neighbors | 2 1.48 97.78
new land | 3 2.22 100.00
------------+-----------------------------------
Total | 135 100.00
Table 19. Reasons for Fallowing Fields
ynotcode| Freq. Percent Cum.
------------+-----------------------------------
fallow | 6 13.33 13.33
illness, etc| 4 8.89 22.22
money | 6 13.33 35.56
labor | 18 40.00 75.56
too big | 3 6.67 82.22
new field | 3 6.67 88.89
poor soil | 3 6.67 95.56
other | 2 4.44 100.00
------------+-----------------------------------
Total | 45 100.00
Table 20. Reasons for Fallow by Burley, Non-Burley Households
-> burley= 0
ynotcode| Freq. Percent Cum.
------------+-----------------------------------
fallow | 3 12.50 12.50
illness, etc| 4 16.67 29.17
money | 2 8.33 37.50
labor | 11 45.83 83.33
too big | 1 4.17 87.50
new field | 2 8.33 95.83
other | 1 4.17 100.00
------------+-----------------------------------
Total | 24 100.00
-> burley= 1
ynotcode| Freq. Percent Cum.
------------+-----------------------------------
fallow | 3 14.29 14.29
money | 4 19.05 33.33
labor | 7 33.33 66.67
too big | 2 9.52 76.19
new field | 1 4.76 80.95
poor soil | 3 14.29 95.24
other | 1 4.76 100.00
------------+-----------------------------------
Total | 21 100.00
Table 21. Reasons for Fallow by Catchment
-> catchmnt= Kamundi
ynotcode| Freq. Percent Cum.
------------+-----------------------------------
fallow | 1 5.26 5.26
illness, etc| 1 5.26 10.53
money | 4 21.05 31.58
labor | 8 42.11 73.68
too big | 3 15.79 89.47
new field | 1 5.26 94.74
other | 1 5.26 100.00
------------+-----------------------------------
Total | 19 100.00
-> catchmnt= Njolomole
ynotcode| Freq. Percent Cum.
------------+-----------------------------------
illness, etc| 1 12.50 12.50
money | 2 25.00 37.50
labor | 1 12.50 50.00
new field | 1 12.50 62.50
poor soil | 2 25.00 87.50
other | 1 12.50 100.00
------------+-----------------------------------
Total | 8 100.00
-> catchmnt= Chulu
ynotcode| Freq. Percent Cum.
------------+-----------------------------------
fallow | 2 20.00 20.00
illness, etc| 2 20.00 40.00
labor | 6 60.00 100.00
------------+-----------------------------------
Total | 10 100.00
-> catchmnt= Chilindamaji
ynotcode| Freq. Percent Cum.
------------+-----------------------------------
fallow | 3 37.50 37.50
labor | 3 37.50 75.00
new field | 1 12.50 87.50
poor soil | 1 12.50 100.00
------------+-----------------------------------
Total | 8 100.00
Table 22. Uses of Forests in Order of Importance
-> rank= 1
wooduse| Freq. Percent Cum.
------------+-----------------------------------
conservation| 1 1.49 1.49
fuelwood | 47 70.15 71.64
grass | 1 1.49 73.13
hanging rack| 3 4.48 77.61
poles | 13 19.40 97.01
rope fiber | 2 2.99 100.00
------------+-----------------------------------
Total | 67 100.00
-> rank= 2
wooduse| Freq. Percent Cum.
------------+-----------------------------------
fuelwood | 8 12.12 12.12
grass | 4 6.06 18.18
hanging rack| 3 4.55 22.73
poles | 37 56.06 78.79
rope fiber | 7 10.61 89.39
fiber | 1 1.52 90.91
medicine | 1 1.52 92.42
timber | 2 3.03 95.45
fruit | 3 4.55 100.00
------------+-----------------------------------
Total | 66 100.00
-> rank= 3
wooduse| Freq. Percent Cum.
------------+-----------------------------------
fuelwood | 5 8.62 8.62
grass | 5 8.62 17.24
hanging rack| 3 5.17 22.41
poles | 8 13.79 36.21
rope fiber | 18 31.03 67.24
fiber | 8 13.79 81.03
medicine | 3 5.17 86.21
timber | 7 12.07 98.28
fruit | 1 1.72 100.00
------------+-----------------------------------
Total | 58 100.00
-> rank= 4
wooduse| Freq. Percent Cum.
------------+-----------------------------------
fuelwood | 3 6.82 6.82
grass | 6 13.64 20.45
hanging rack| 8 18.18 38.64
poles | 3 6.82 45.45
rope fiber | 7 15.91 61.36
fiber | 3 6.82 68.18
medicine | 2 4.55 72.73
timber | 1 2.27 75.00
fruit | 11 25.00 100.00
------------+-----------------------------------
Total | 44 100.00
Table 23. Preferred Species
. tabulate specode
specode| Freq. Percent Cum.
------------+-----------------------------------
bamba | 3 0.70 0.70
bamboo | 2 0.47 1.16
bluegum | 4 0.93 2.09
bthomnin | 1 0.23 2.33
chigwene | 2 0.47 2.79
chikabal | 1 0.23 3.02
chiombo | 37 8.60 11.63
chithowi | 9 2.09 13.72
chitimbe | 3 0.70 14.42
chiyere | 1 0.23 14.65
chothoui | 1 0.23 14.88
cyprus | 1 0.23 15.12
eucalypt | 5 1.16 16.28
g. arbor | 1 0.23 16.51
jombo | 1 0.23 16.74
kabvenje | 3 0.70 17.44
kachere | 2 0.47 17.91
kalama | 3 0.70 18.60
kalikuku | 1 0.23 18.84
kamemena | 7 1.63 20.47
kamphoni | 15 3.49 23.95
kamphoye | 1 0.23 24.19
kamsuni | 2 0.47 24.65
kamvenje | 1 0.23 24.88
kapirapi | 1 0.23 25.12
kasokolo | 1 0.23 25.35
katope | 3 0.70 26.05
kavwenje | 1 0.23 26.28
kawidzi | 3 0.70 26.98
kuvwenje | 2 0.47 27.44
libvungw | 1 0.23 27.67
lopo | 4 0.93 28.60
lulunga | 1 0.23 28.84
m'banga | 1 0.23 29.07
m'bawa | 2 0.47 29.53
mango | 13 3.02 32.56
masuku | 4 0.93 33.49
mateme | 1 0.23 33.72
matomo | 1 0.23 33.95
matowo | 2 0.47 34.42
mavuvu | 1 0.23 34.65
mawula | 1 0.23 34.88
maye | 1 0.23 35.12
mazaye | 4 0.93 36.05
mbanga m | 10 2.33 38.37
mbawa | 1 0.23 38.60
mbovu | 3 0.70 39.30
mbula | 4 0.93 40.23
mbuluka | 1 0.23 40.47
mbuwa | 2 0.47 40.93
mbuzi | 1 0.23 41.16
mchenga | 6 1.40 42.56
mchiwa | 1 0.23 42.79
mfutu | 1 0.23 43.02
mikuti | 2 0.47 43.49
miseza | 1 0.23 43.72
misolo | 1 0.23 43.95
mitondo | 3 0.70 44.65
miwanga | 2 0.47 45.12
miyumbu | 1 0.23 45.35
mkalakat | 1 0.23 45.58
mkulu | 1 0.23 45.81
mkuti | 8 1.86 47.67
mkuyu | 1 0.23 47.91
mlemba | 2 0.47 48.37
mlombwa | 2 0.47 48.84
mngotoka | 1 0.23 49.07
mnjoyi | 1 0.23 49.30
mombo | 2 0.47 49.77
mpalapal | 1 0.23 50.00
mpapa | 11 2.56 52.56
mpapaden | 2 0.47 53.02
mphatwe | 1 0.23 53.26
mpululu | 2 0.47 53.72
msani | 3 0.70 54.42
msekese | 8 1.86 56.28
msendalu | 1 0.23 56.51
msokolow | 3 0.70 57.21
msolo | 20 4.65 61.86
msuku | 12 2.79 64.65
msumbu | 8 1.86 66.51
mthethe | 1 0.23 66.74
mtondo | 40 9.30 76.05
mtowa | 3 0.70 76.74
mtowo | 2 0.47 77.21
mtwana | 1 0.23 77.44
mukuti | 2 0.47 77.91
mulombwa | 2 0.47 78.37
mumwa | 1 0.23 78.60
musawi | 1 0.23 78.84
musokolo | 1 0.23 79.07
musu | 1 0.23 79.30
musuku | 2 0.47 79.77
musumba | 1 0.23 80.00
muswenje | 1 0.23 80.23
muula | 2 0.47 80.70
muvukwe | 1 0.23 80.93
muwanga | 20 4.65 85.58
muwemba | 1 0.23 85.81
muwuwa | 2 0.47 86.28
mvukwe | 5 1.16 87.44
mwaphe | 4 0.93 88.37
mwuwa | 2 0.47 88.84
n'chakat | 2 0.47 89.30
naliusui | 1 0.23 89.53
naphini | 1 0.23 89.77
nemena | 1 0.23 90.00
ng'ona | 1 0.23 90.23
ngowe | 1 0.23 90.47
njombo | 1 0.23 90.70
nkaziwam | 1 0.23 90.93
nsindra | 1 0.23 91.16
nsolo | 3 0.70 91.86
nthema | 1 0.23 92.09
nthombod | 2 0.47 92.56
nthudza | 1 0.23 92.79
nthumbuz | 1 0.23 93.02
nyozi | 1 0.23 93.26
palibeka | 1 0.23 93.49
phuliphu | 2 0.47 93.95
pomapro | 1 0.23 94.19
sokolo | 1 0.23 94.42
strychno | 1 0.23 94.65
termi.se | 1 0.23 94.88
thedza | 2 0.47 95.35
thithion | 1 0.23 95.58
thombozi | 5 1.16 96.74
tsamba | 5 1.16 97.91
tsemba | 1 0.23 98.14
tsimba | 1 0.23 98.37
u. kirki | 4 0.93 99.30
usendalu | 1 0.23 99.53
utomoni | 1 0.23 99.77
yembe | 1 0.23 100.00
------------+-----------------------------------
Total | 430 100.00
Table 24. Preferred Species by Use
-> prodcode= fiber
specode| Freq. Percent Cum.
------------+-----------------------------------
chiombo | 2 10.53 10.53
chithowi | 2 10.53 21.05
jombo | 1 5.26 26.32
kamphoni | 1 5.26 31.58
mbanga m | 2 10.53 42.11
mchenga | 2 10.53 52.63
mkulu | 1 5.26 57.89
mkuti | 1 5.26 63.16
mombo | 1 5.26 68.42
mpapa | 1 5.26 73.68
msani | 1 5.26 78.95
mvukwe | 1 5.26 84.21
mwaphe | 1 5.26 89.47
thithion | 1 5.26 94.74
tsamba | 1 5.26 100.00
------------+-----------------------------------
Total | 19 100.00
-> prodcode= fruit
specode| Freq. Percent Cum.
------------+-----------------------------------
kasokolo | 1 2.94 2.94
mango | 10 29.41 32.35
masuku | 3 8.82 41.18
matomo | 1 2.94 44.12
matowo | 2 5.88 50.00
mavuvu | 1 2.94 52.94
mawula | 1 2.94 55.88
maye | 1 2.94 58.82
mazaye | 3 8.82 67.65
mbula | 2 5.88 73.53
mbuluka | 1 2.94 76.47
mbuwa | 1 2.94 79.41
msuku | 3 8.82 88.24
nthema | 1 2.94 91.18
nthudza | 1 2.94 94.12
nthumbuz | 1 2.94 97.06
u. kirki | 1 2.94 100.00
------------+-----------------------------------
Total | 34 100.00
-> prodcode=fuelwood
specode| Freq. Percent Cum.
------------+-----------------------------------
bamba | 1 0.71 0.71
bluegum | 1 0.71 1.43
chigwene | 1 0.71 2.14
chikabal | 1 0.71 2.86
chiombo | 11 7.86 10.71
chithowi | 4 2.86 13.57
chitimbe | 2 1.43 15.00
chothoui | 1 0.71 15.71
cyprus | 1 0.71 16.43
eucalypt | 2 1.43 17.86
g. arbor | 1 0.71 18.57
kabvenje | 1 0.71 19.29
kachere | 1 0.71 20.00
kamphoni | 11 7.86 27.86
kamphoye | 1 0.71 28.57
kamvenje | 1 0.71 29.29
kavwenje | 1 0.71 30.00
kuvwenje | 1 0.71 30.71
mango | 3 2.14 32.86
mazaye | 1 0.71 33.57
mbanga m | 5 3.57 37.14
mbawa | 1 0.71 37.86
mbovu | 1 0.71 38.57
mbula | 1 0.71 39.29
mchenga | 2 1.43 40.71
mikuti | 2 1.43 42.14
miseza | 1 0.71 42.86
mitondo | 2 1.43 44.29
mkalakat | 1 0.71 45.00
mkuti | 5 3.57 48.57
mombo | 1 0.71 49.29
mpapa | 7 5.00 54.29
msani | 2 1.43 55.71
msekese | 2 1.43 57.14
msolo | 1 0.71 57.86
msuku | 1 0.71 58.57
msumbu | 4 2.86 61.43
mthethe | 1 0.71 62.14
mtondo | 28 20.00 82.14
mtowa | 1 0.71 82.86
mtowo | 1 0.71 83.57
mukuti | 2 1.43 85.00
musumba | 1 0.71 85.71
muswenje | 1 0.71 86.43
muvukwe | 1 0.71 87.14
muwanga | 5 3.57 90.71
mvukwe | 4 2.86 93.57
n'chakat | 1 0.71 94.29
ngowe | 1 0.71 95.00
njombo | 1 0.71 95.71
nyozi | 1 0.71 96.43
thedza | 1 0.71 97.14
tsamba | 2 1.43 98.57
tsemba | 1 0.71 99.29
yembe | 1 0.71 100.00
------------+-----------------------------------
Total | 140 100.00
-> prodcode= poles
specode| Freq. Percent Cum.
------------+-----------------------------------
bluegum | 3 2.26 2.26
bthomnin | 1 0.75 3.01
chigwene | 1 0.75 3.76
chiombo | 2 1.50 5.26
chitimbe | 1 0.75 6.02
eucalypt | 3 2.26 8.27
kabvenje | 1 0.75 9.02
kalama | 3 2.26 11.28
kalikuku | 1 0.75 12.03
kamemena | 5 3.76 15.79
kamphoni | 1 0.75 16.54
kamsuni | 1 0.75 17.29
katope | 3 2.26 19.55
kawidzi | 2 1.50 21.05
kuvwenje | 1 0.75 21.80
lopo | 4 3.01 24.81
m'banga | 1 0.75 25.56
masuku | 1 0.75 26.32
mbanga m | 3 2.26 28.57
mbovu | 1 0.75 29.32
mbula | 1 0.75 30.08
mbuwa | 1 0.75 30.83
mbuzi | 1 0.75 31.58
mchenga | 2 1.50 33.08
mchiwa | 1 0.75 33.83
miwanga | 1 0.75 34.59
miyumbu | 1 0.75 35.34
mlemba | 2 1.50 36.84
mnjoyi | 1 0.75 37.59
mpapa | 2 1.50 39.10
mphatwe | 1 0.75 39.85
mpululu | 2 1.50 41.35
msekese | 4 3.01 44.36
msendalu | 1 0.75 45.11
msolo | 14 10.53 55.64
msuku | 5 3.76 59.40
msumbu | 1 0.75 60.15
mtondo | 5 3.76 63.91
mtowa | 2 1.50 65.41
mtowo | 1 0.75 66.17
mtwana | 1 0.75 66.92
mumwa | 1 0.75 67.67
musokolo | 1 0.75 68.42
musuku | 2 1.50 69.92
muwanga | 10 7.52 77.44
muwuwa | 1 0.75 78.20
mwaphe | 1 0.75 78.95
mwuwa | 2 1.50 80.45
n'chakat | 1 0.75 81.20
naphini | 1 0.75 81.95
nemena | 1 0.75 82.71
ng'ona | 1 0.75 83.46
nsindra | 1 0.75 84.21
nsolo | 2 1.50 85.71
nthombod | 2 1.50 87.22
phuliphu | 2 1.50 88.72
pomapro | 1 0.75 89.47
sokolo | 1 0.75 90.23
strychno | 1 0.75 90.98
termi.se | 1 0.75 91.73
thedza | 1 0.75 92.48
thombozi | 4 3.01 95.49
tsamba | 1 0.75 96.24
tsimba | 1 0.75 96.99
u. kirki | 3 2.26 99.25
utomoni | 1 0.75 100.00
------------+-----------------------------------
Total | 133 100.00
-> prodcode= rope
specode| Freq. Percent Cum.
------------+-----------------------------------
bamba | 2 4.65 4.65
chiombo | 21 48.84 53.49
chithowi | 3 6.98 60.47
kabvenje | 1 2.33 62.79
kachere | 1 2.33 65.12
kamphoni | 2 4.65 69.77
mbovu | 1 2.33 72.09
mitondo | 1 2.33 74.42
mkuti | 2 4.65 79.07
mpapa | 1 2.33 81.40
mtondo | 2 4.65 86.05
musawi | 1 2.33 88.37
mwaphe | 2 4.65 93.02
nsolo | 1 2.33 95.35
tsamba | 1 2.33 97.67
usendalu | 1 2.33 100.00
------------+-----------------------------------
Total | 43 100.00