Southwest U.S. Burn Period Tracker
Updated:2024-04-26
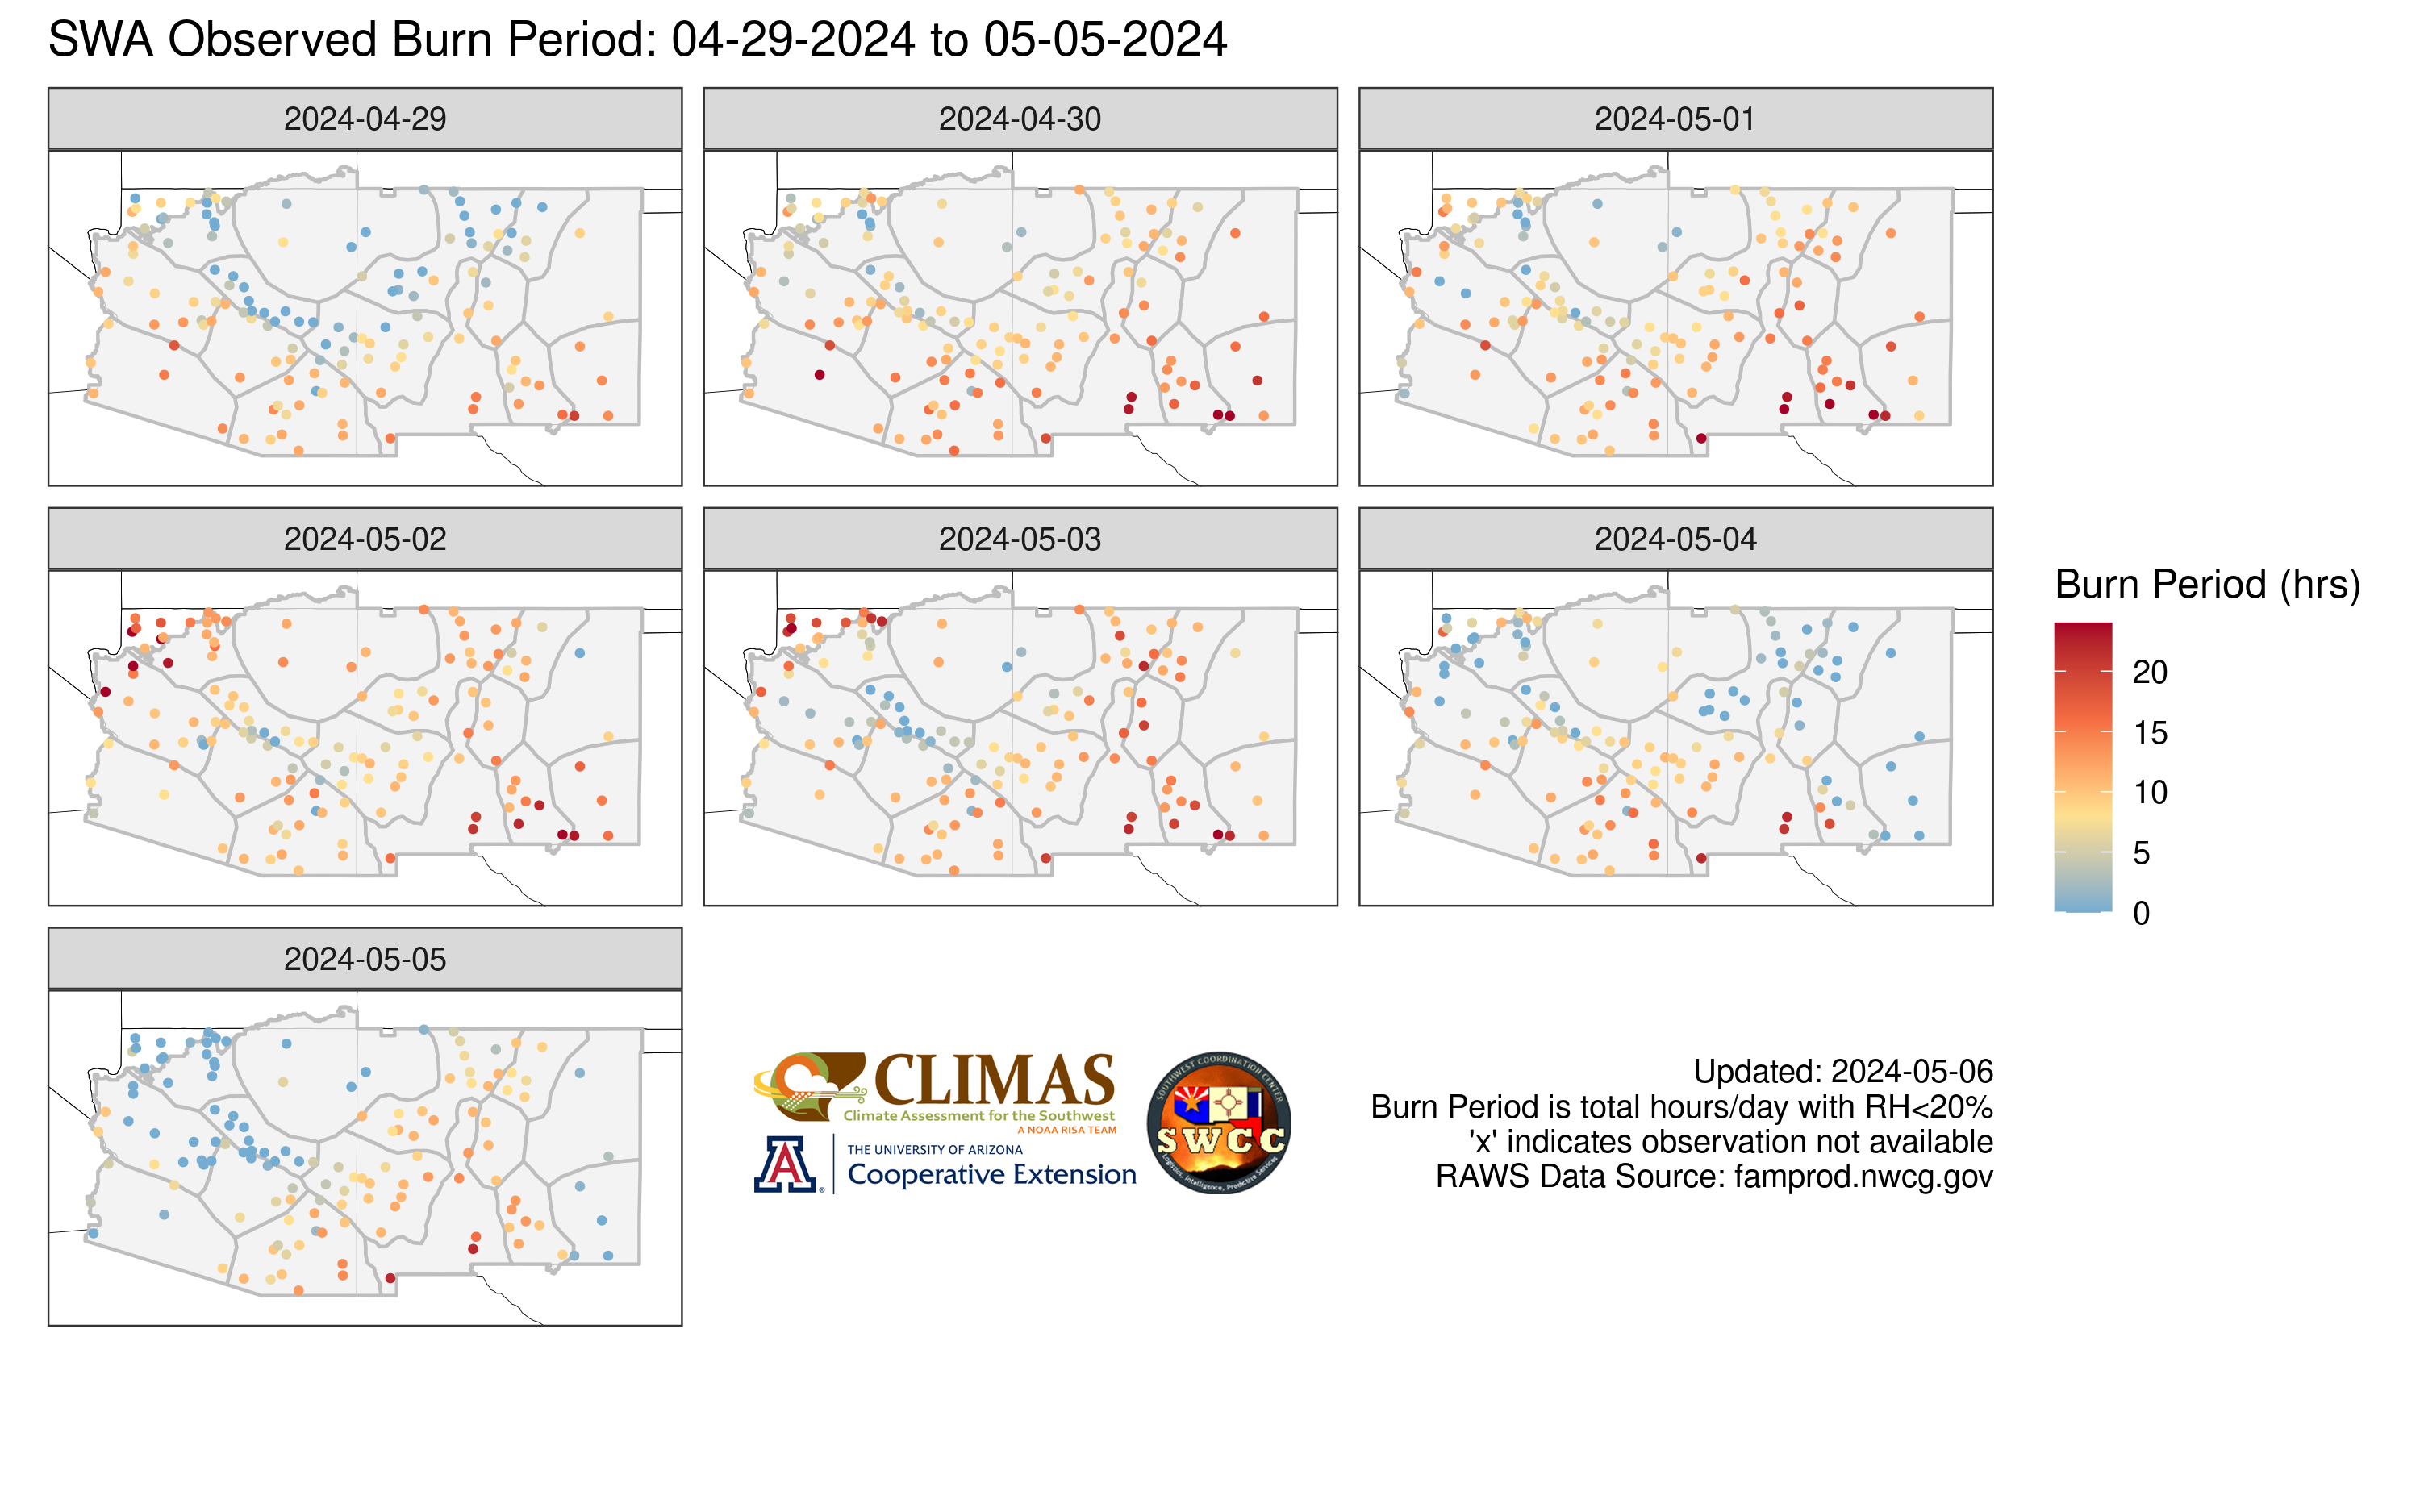
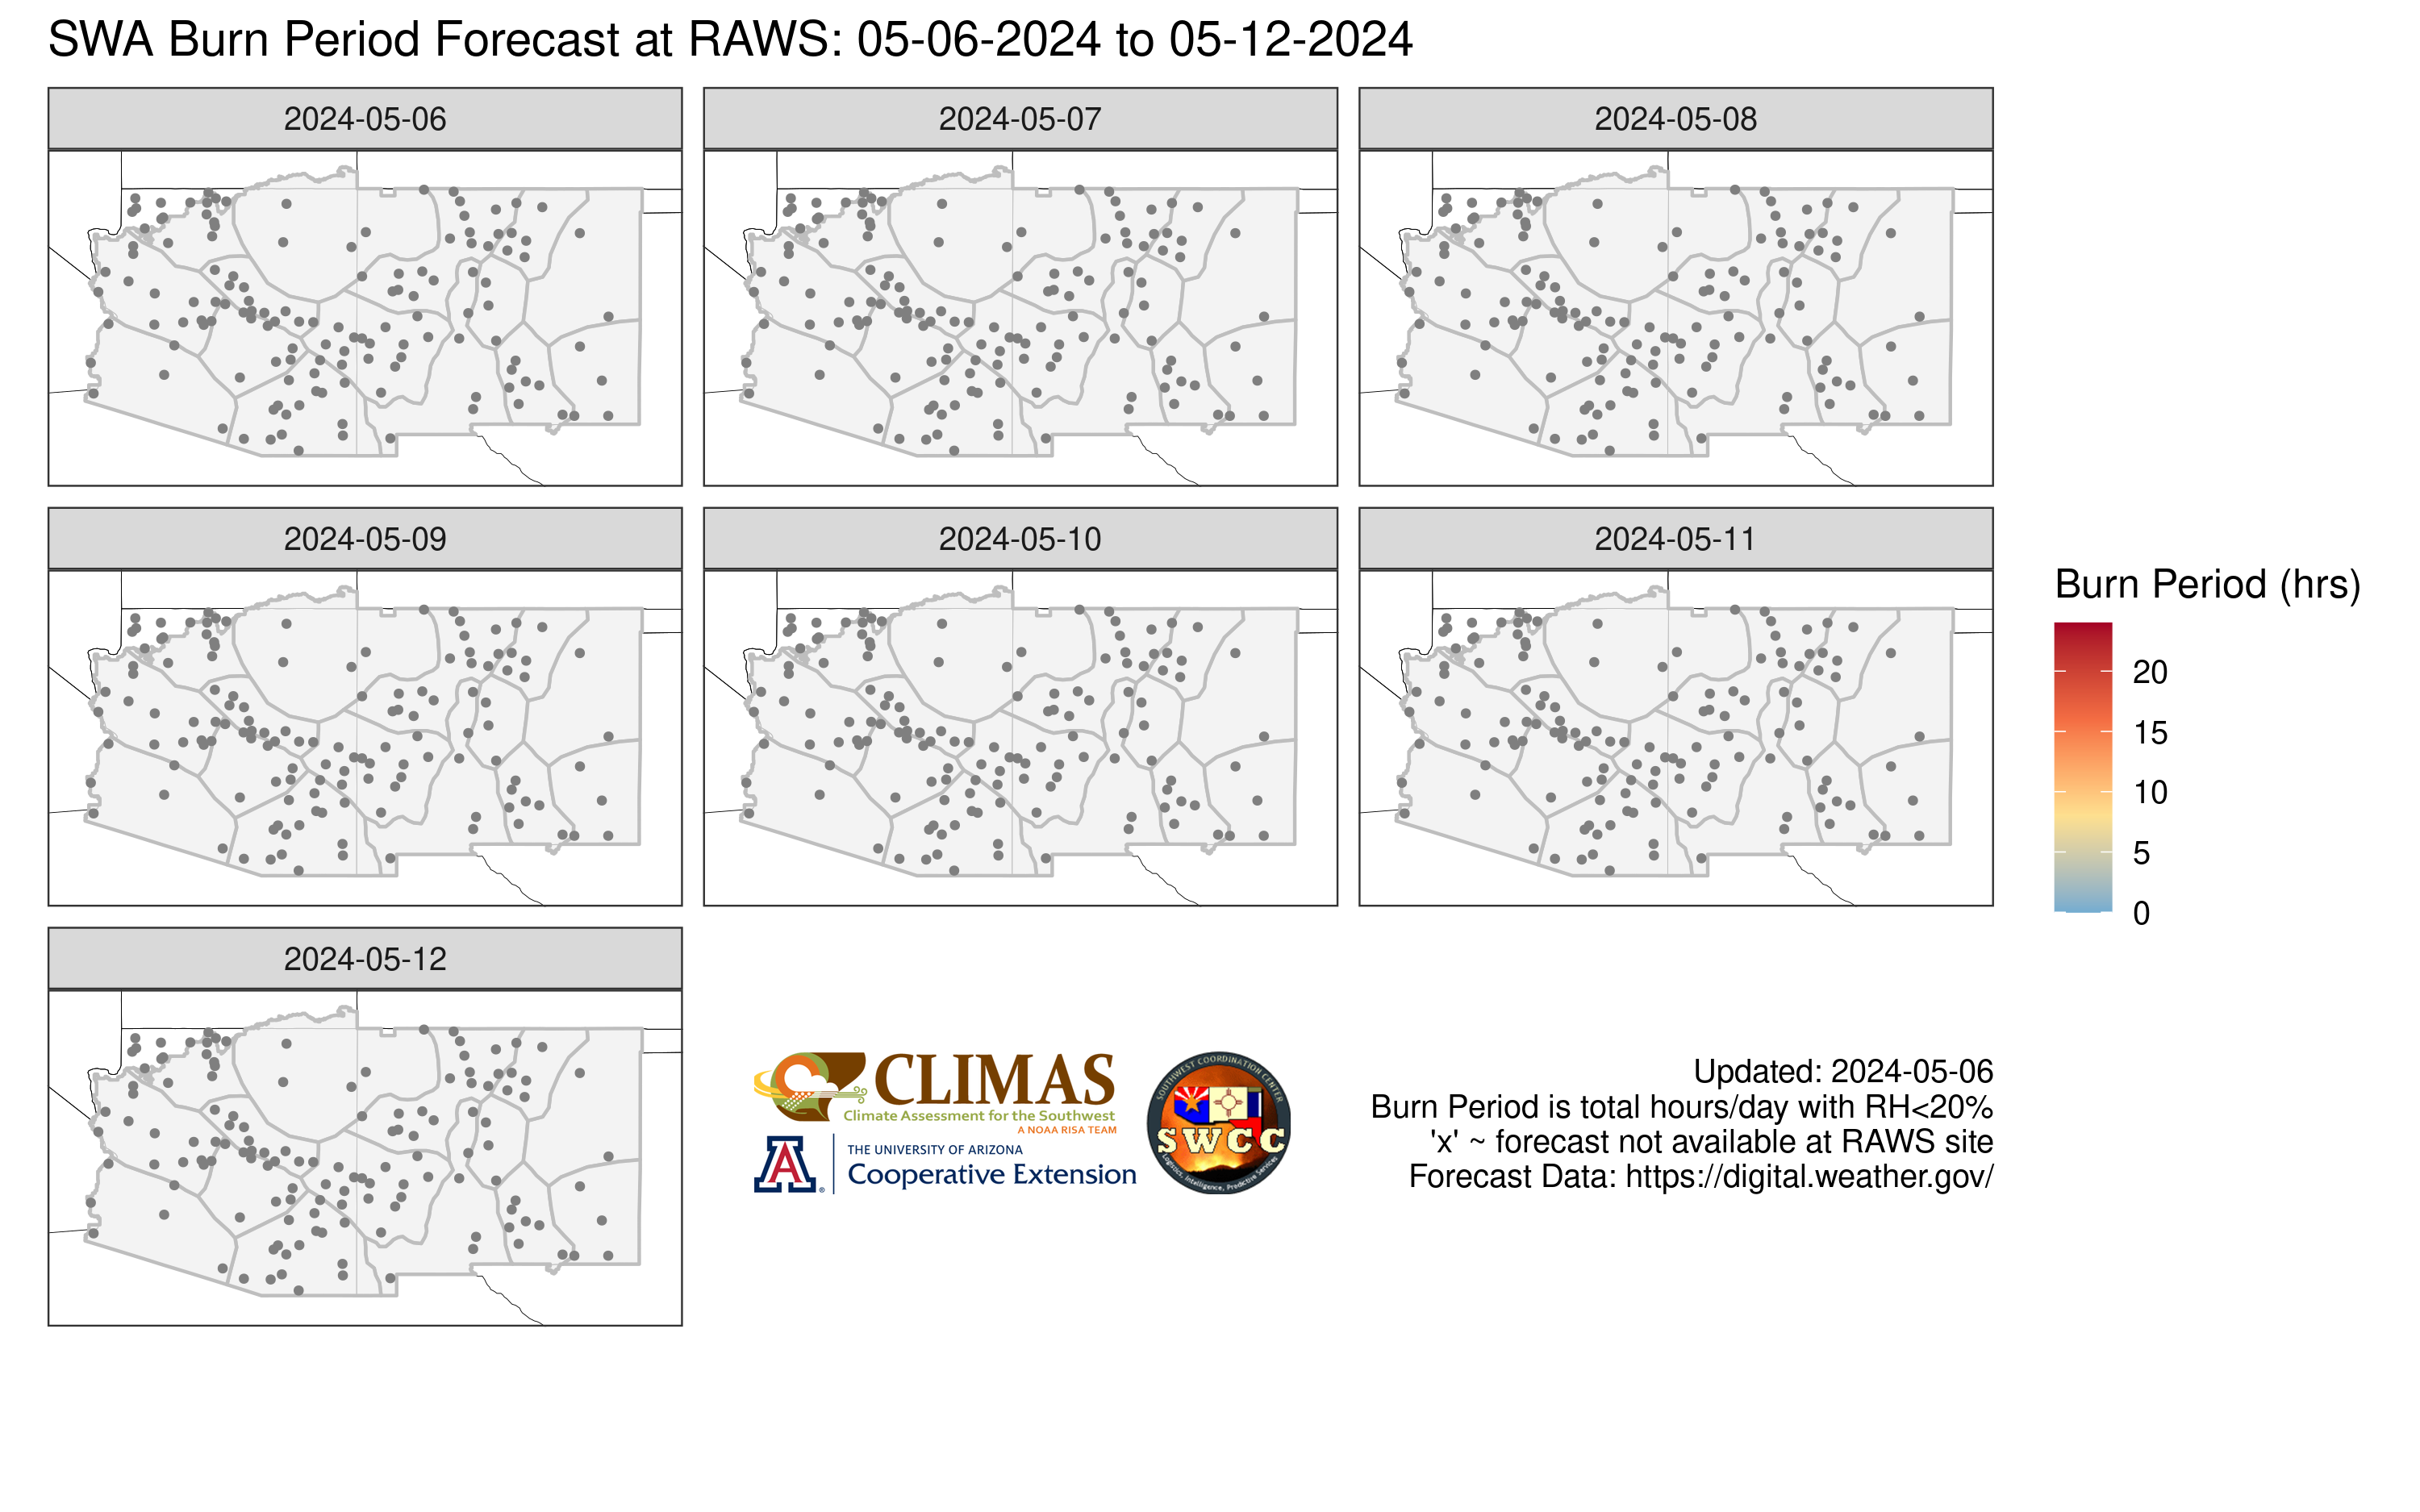
This page provides access to an experimental fire weather monitoring product called the Burn Period Tracker. Burn period is defined as the number of hours per day where the hourly average relative humidity is less than or equal to 20% and is calculated at Remote Automated Weather Stations with real-time data and several years of historical data. Values range from 0 to 24 hours per day with higher values associated with increased fire danger.
Click on markers on the map below to access Burn Period Tracker plots and recent observations at available RAWS sites (Click on marker to bring up plot and observation links; click again to access either product). Active and recent fires are shown in red polygons on the map. Burn Tracker Plots and recent observations are also available through the table below the map.


Plots
Forecast Table

Climate Science Applications Program - University of Arizona Cooperative Extension
 https://github.com/Climate-Science-Applications-Program/Burn-Period-Tracker