Southwest U.S. Summer Monsoon Season Precipitation Mapping
The maps below are focused on capturing unique elements of the summer monsoon season hydroclimate across Arizona and New Mexico including total precipitation, intensity, and frequency of precipitation events. Maps are updated once a day from June 15 - September 30th using gridded PRISM precipitation data (nominally 4km by 4km) provided by the Applied Climate Information System (RCC-ACIS). The daily data represent the 24 hour total precipitation measured at 12:00 UTC (locally 5:00am Mountain Time). PRISM data availability is lagged by one day so totals through 12Z of the previous day are available here. The gridded data provide a spatial estimate of true precipitation amounts across the region and should be interpreted with caution at very fine scales. More information on how the gridded data are produced can be found here.
A companion site of station level plots can be found here
[NOAA-AHPS Arizona maps here]
[NOAA-AHPS New Mexico maps here]
Email Mike Crimmins with questions and/or suggestions on how to improve these plots or ideas for additional variables
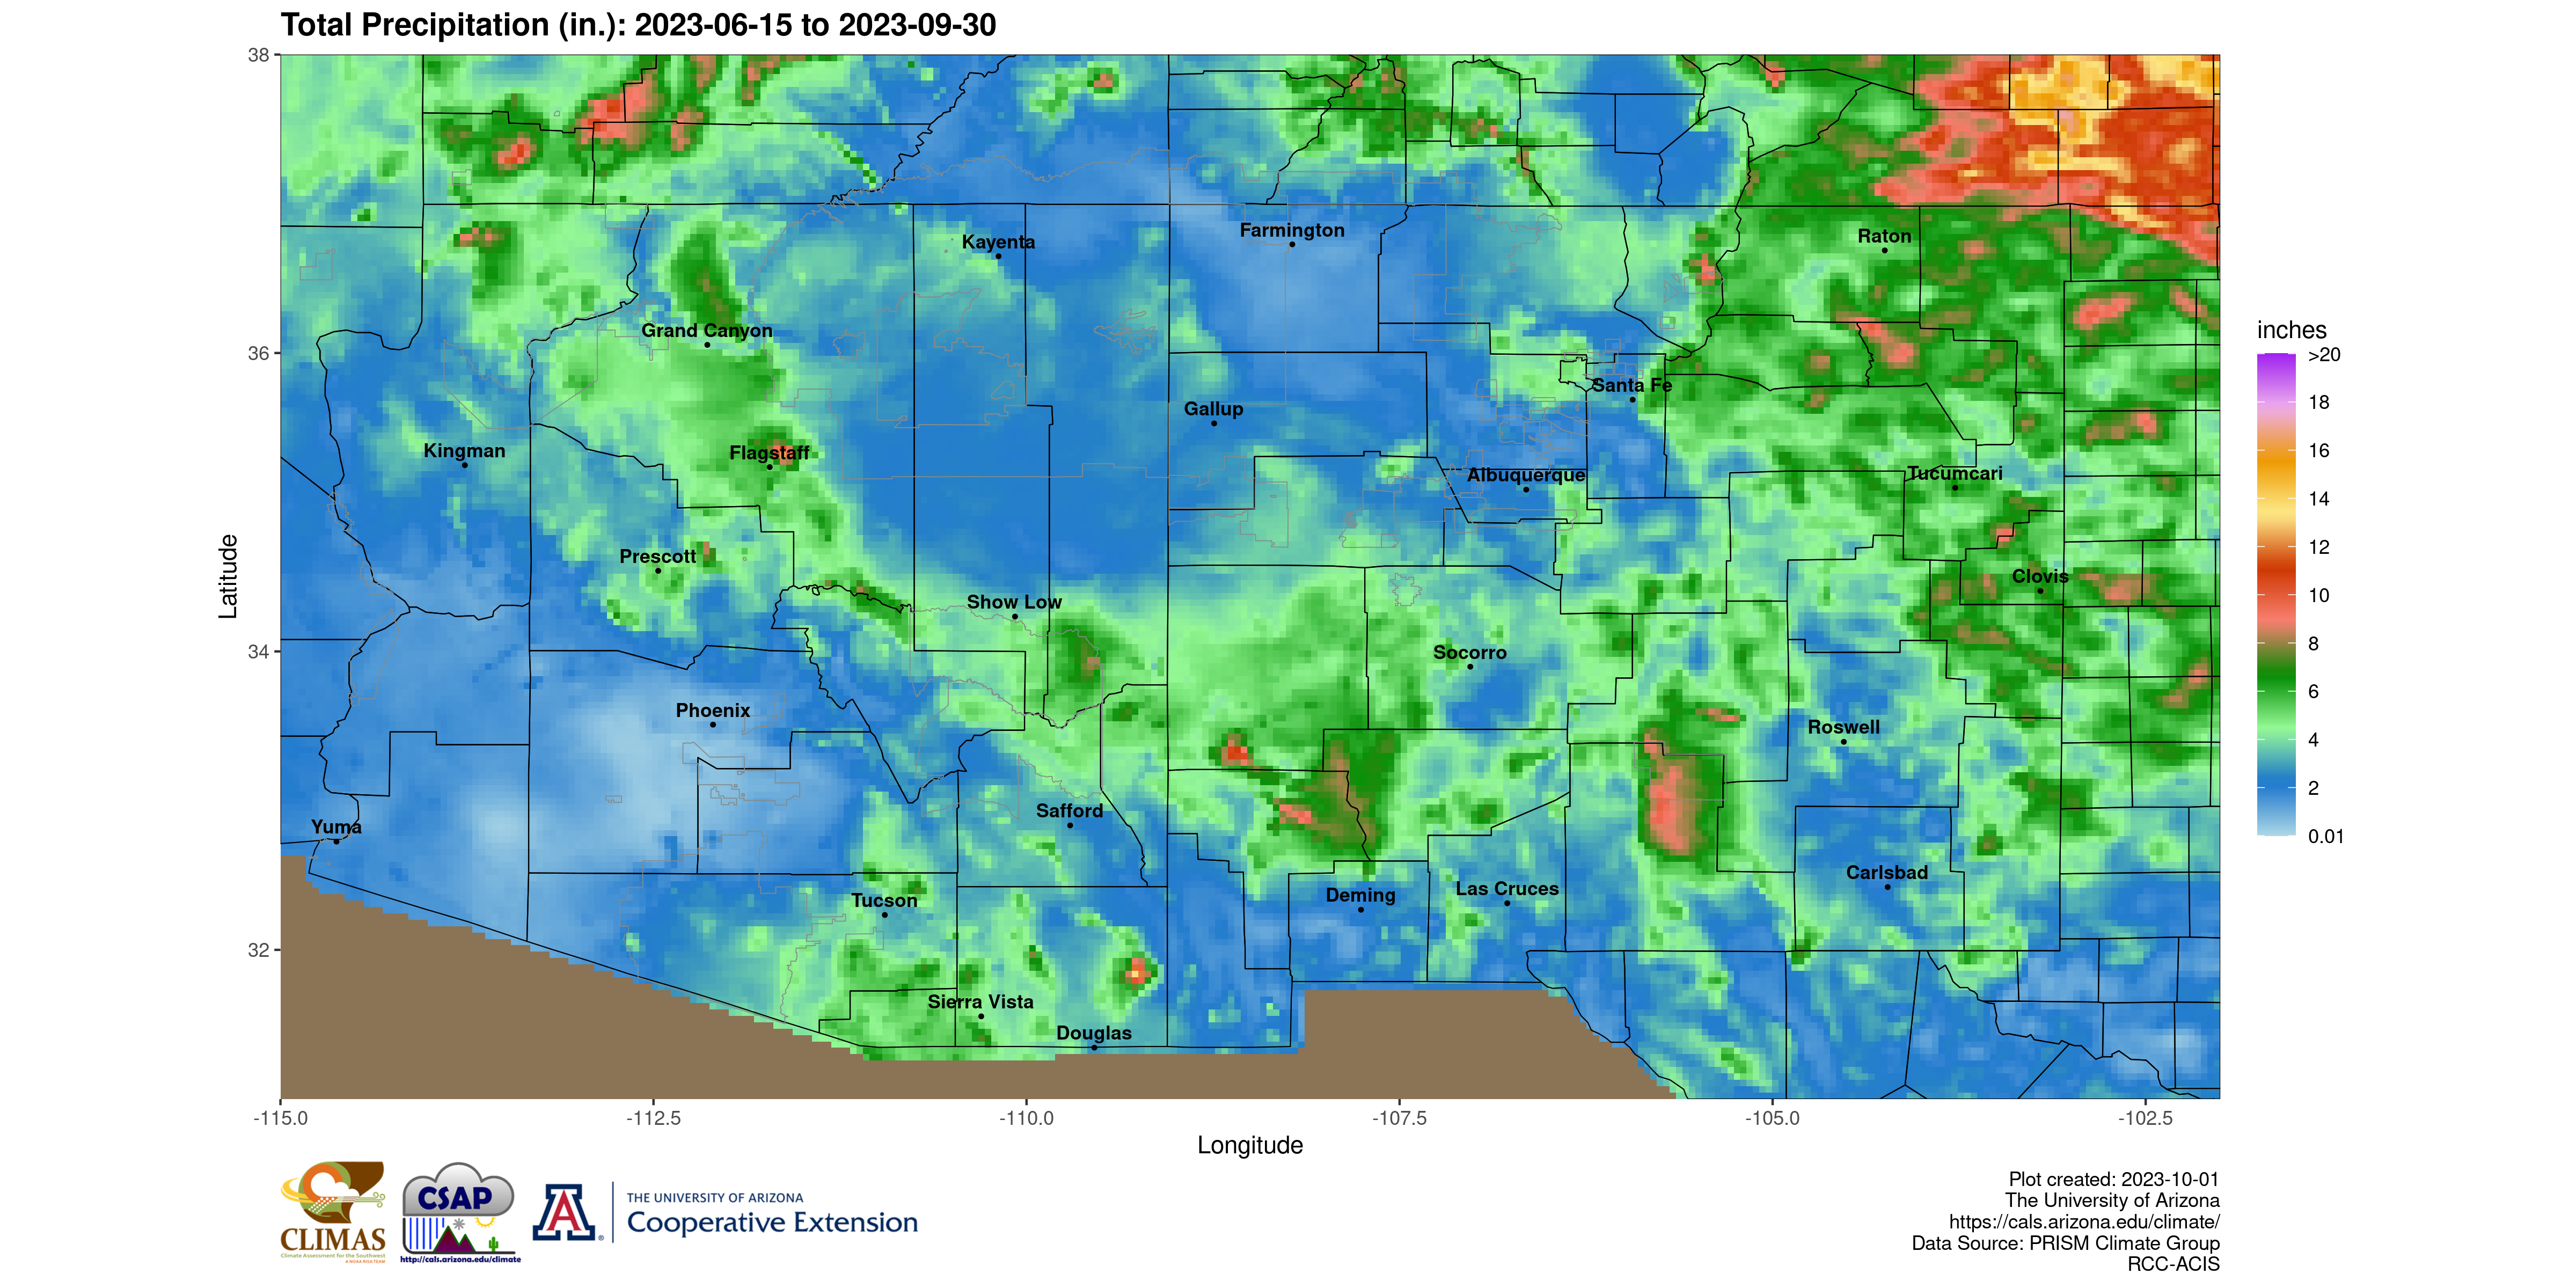
Total precipitation: Daily precipitation data summed from 6/15 to present.
Daily Precipitation Data (1981-2015) from PRISM Climate Group, http://prism.oregonstate.edu/
| Site Name: | Data grid cell |
|---|---|
| Latitude: | Latitude: |
| Longitude: | Longitude: |
| Elevation (ft): | Elevation (ft): |
Cumulative precipitation observation log with percentile thresholds (all values in inches)
Notes
This chart was produced by the Reference Cumulative Precipitation Chart Generator found at: https://uaclimateextension.shinyapps.io/precipChart/