|

|

|
|

|
|
|

|
|
|
|
|
|
|
|
Yuma Leaf Wetness Network
(December 13, 2017)
|
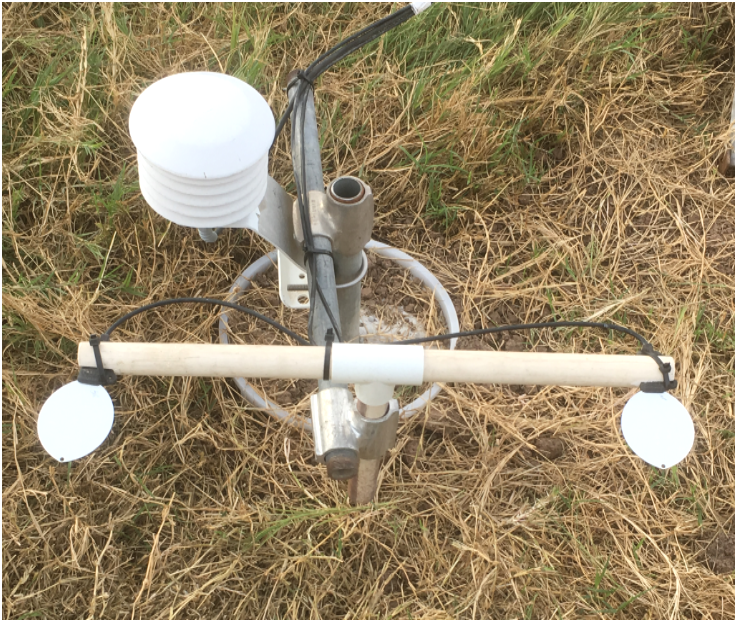 Figure 1. Leaf wetness equipment recently
installed at Yuma area AZMET weather station sites.
Figure 1. Leaf wetness equipment recently
installed at Yuma area AZMET weather station sites.
Leaf wetness equipment has been installed at the four AZMET weather stations located
in Yuma County (Roll, Yuma North Gila, Yuma Valley and Yuma South). The equipment
consists of two leaf wetness sensors located at 1’ above the surface and a combination
air temperature and relative humidity sensor, also located 1’ above the surface
(Fig. 1).
Data from the leaf wetness network is updated every 15 minutes and is presented
in graphical form via the internet at the following address:
http://128.196.12.122:460/
Upon entering the internet address above, you will be directed to a display page
that provides the outputs from the wetness sensors at each weather station for the
past 24 hours (Fig. 2). Scroll up and down the display page to view the various
locations. Output from the leaf wetness sensors (2 at each location) are displayed
using green and red lines. The sensors are dry (no leaf wetness) when the green
and red lines remain in the grey area labeled DRY. The sensors are wet when the
red and green lines move up into the blue area labeled WET with higher readings
indicating increased wetness (heavier dew). The warning light to the right of the
graph will turn from grey to red when the sensors are wet. The black line provides
the air temperature at the height of the wetness sensors (1’ above surface) and
is provided for disease models that require both wetness and temperature data. Use
the scale on the right axis of the graph to determine the temperature. The current
temperature is also displayed in numerical format to the right of the graph. Always
check on the date and time of the last update from the sensors to make sure the
displayed information is current. Weather station maintenance and/or problems with
local cell phone service can delay data.

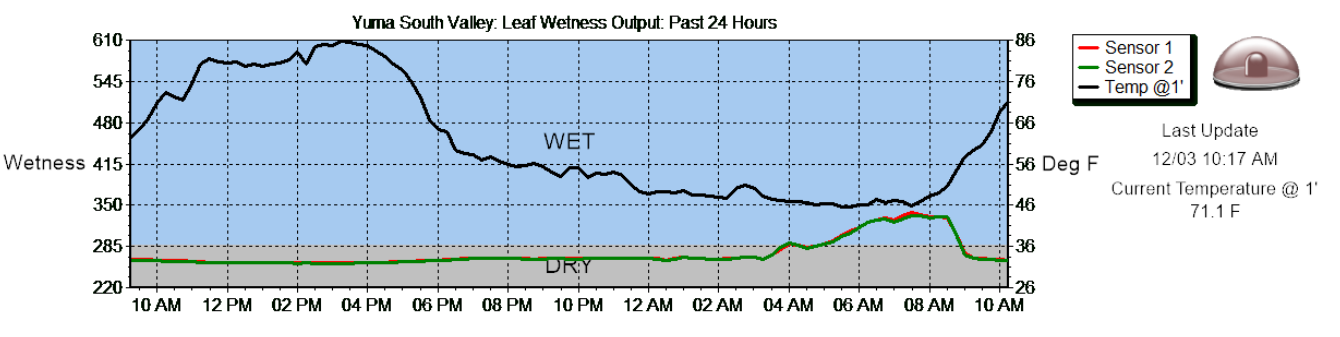 Figure 2. Example of graph showing leaf
wetness (green & red lines) and temperature data (black line) for the most recent
24 hours.
Figure 2. Example of graph showing leaf
wetness (green & red lines) and temperature data (black line) for the most recent
24 hours.
At the conclusion of each day the leaf wetness data are summarized into daily totals
in units of hours of wetness per day. Graphs showing these daily wetness totals
for the past 14 days (Fig. 3) are provided by clicking the tab at the top of the
display labeled “Most Recent 2 Weeks: All Locations.” Scroll up and down the display
page to view the various locations. These data sets will also be summarized in tabular
form every two weeks for this newsletter (Table 1).
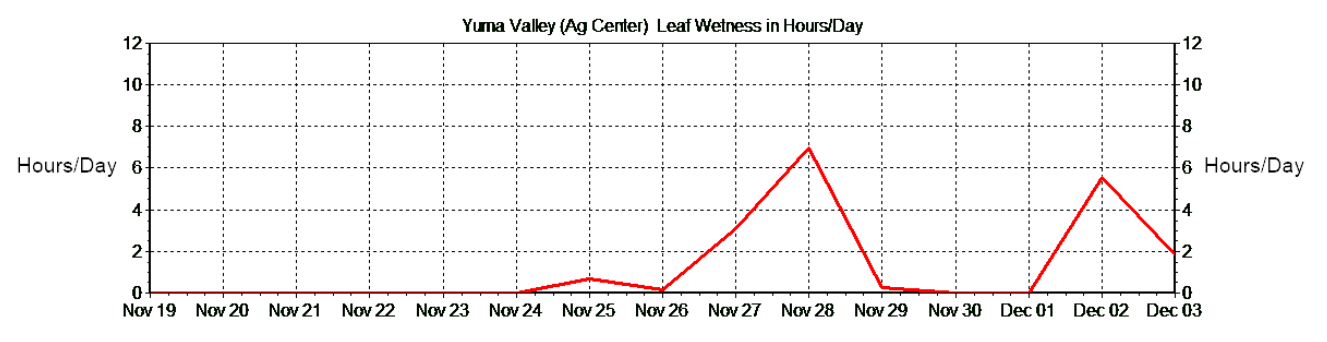 Figure 3. Graph showing the number of hours
of leaf wetness per day for the past 2 weeks at the Yuma Valley station.
Figure 3. Graph showing the number of hours
of leaf wetness per day for the past 2 weeks at the Yuma Valley station.
Additional, location-specific data may be examined by clicking on the tabs labeled
with the station names. These display pages provide graphs of: 1) leaf wetness,
2) temperature and dew point, and 3) relative humidity and wind speed for the most
recent 24 hours as measured by the leaf wetness equipment located 1’ above the surface
(wind speed at 10’ above surface). Also included at the bottom of these displays
is a graph showing the maximum, minimum and dew point temperatures for the past
two weeks as measured by the standard AZMET station sensors located at 5’ above
the surface (shelter height).
The temperature-dew point and relative humidity graphs serve as a check or backup
for the leaf wetness data. Dew (leaf wetness) forms when the temperature approaches
the dew point (typically within ~ 2-3°F) which equates to relative humidity values
above 90%. If the temperature-dew point difference exceeds ~3°F or the relative
humidity is less than 90% the wetness signal should be declining (indicating drying)
or remain in the dry zone on the graphs.
Table 1. Hours of leaf wetness per day.
Hours are accumulated for the 24-hour period ending at noon on the indicated date
to ensure data includes entire nighttime period when wetness is more likely.
|
|
Back
|
For questions or comments on any of the topics please contact Marco Pena at the Yuma Agricultural Center.
College of Agriculture, The University of Arizona, Tucson, AZ.
|
Home |
Cotton | Veggies |
Forages | Grains
| Citrus |
Crop x Crop
Insects |
Diseases| Weeds |
Pesticides | Economics |
News | Weather |
Research | Photos
| Contacts |
General Info.
Copyright © 2001 University
of Arizona,
College of Agriculture and Life
Sciences
Webmaster: Al Fournier (acis@ag.arizona.edu)
|