
Climate Viticulture Newsletter - 2019 November
< Back to Climate Viticulture Newsletter
Hello, everyone!
This is the 2019 November issue of the Climate Viticulture Newsletter – a quick look at some timely climate topics relevant to winegrape growing in Arizona and New Mexico.
A Recap of October Temperature and Precipitation
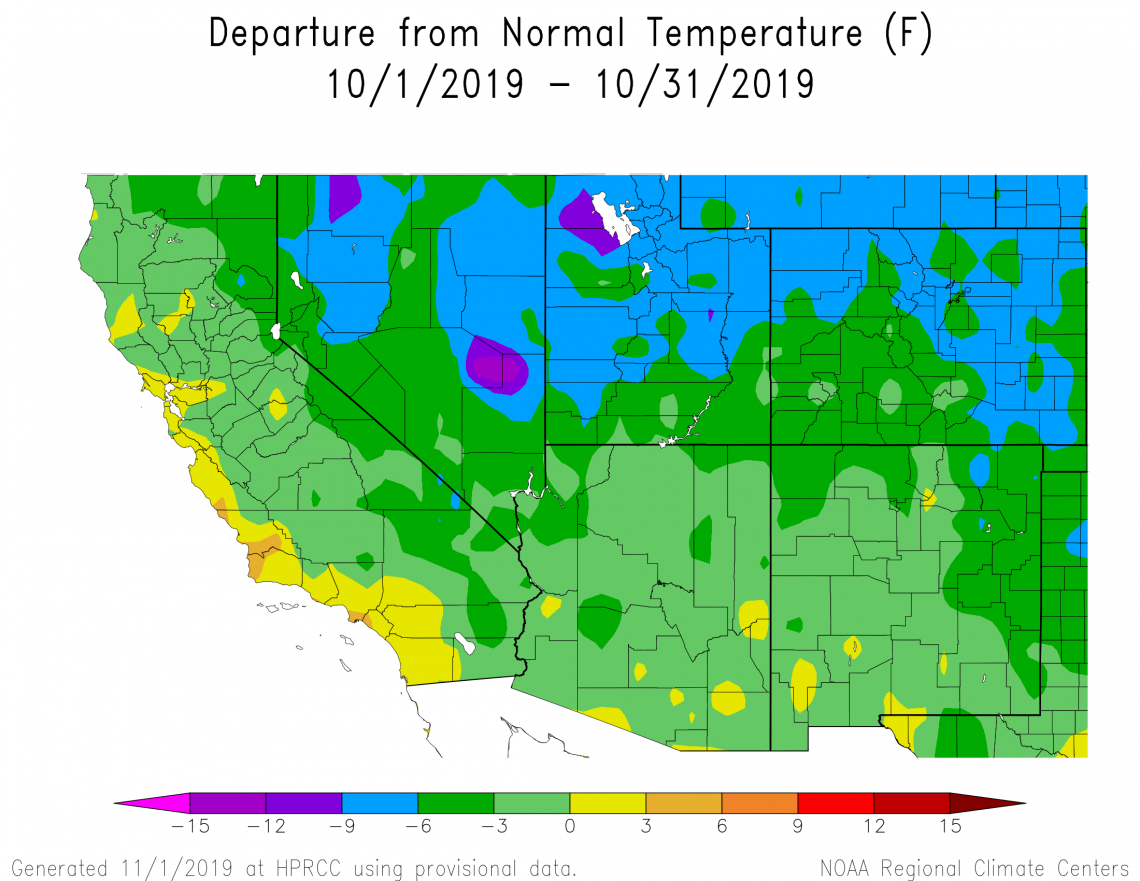
Monthly average temperatures in October were within 3° Fahrenheit of the 1981-2010 average for almost all of Arizona and much of New Mexico (yellow and light green areas on map). A few locations in central and northern Arizona and northern and eastern New Mexico were 3° to 6° Fahrenheit below average (dark green areas on map). Of particular note was the arrival of the first fall freeze during the latter part of the month for relatively warmer winegrape-growing areas, like the Sonoita, Willcox, and proposed Verde Valley American Viticultural Areas (AVAs) in Arizona and the Mesilla Valley and Mimbres Valley AVAs in southern New Mexico. Hopefully, the last of the 2019 harvests took place in time.
2019-nov-last1m-temp-noaa-acis.png
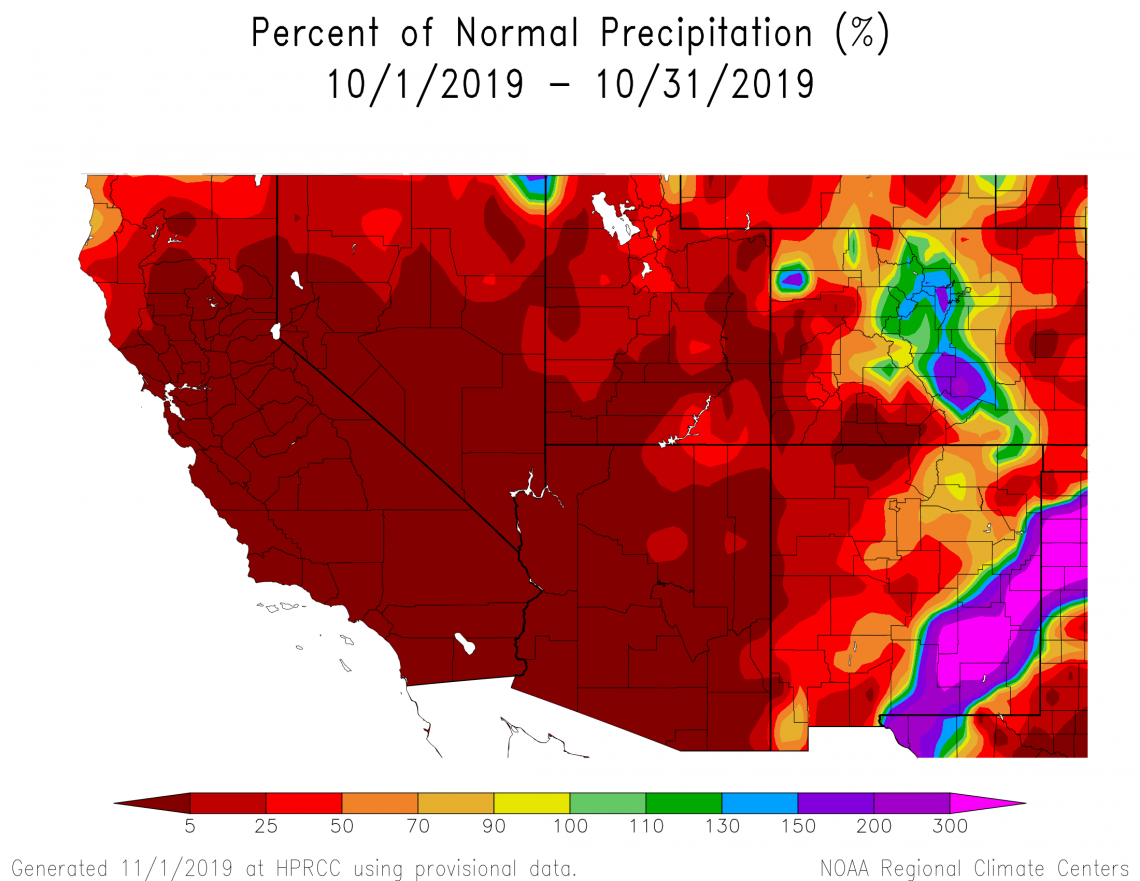
Monthly precipitation totals were below 50% of normal for all of Arizona, with most of the state experiencing less than 5% of average (dark red area on map). Except for a swath of above-average amounts across the southeastern part of the state due to remnants of tropical storm Norda (green, blue, purple, and magenta areas on map), precipitation totals were below normal over New Mexico (yellow, orange, and red areas on map). With such dry conditions, irrigation likely was needed for vineyards in warmer growing areas to help vines continue accumulating carbohydrates through photosynthesis and to support the second seasonal peak in root growth, at least for the first part of the month.
2019-nov-last1m-prcp-noaa-acis.png
The Outlook for November Temperature and Precipitation
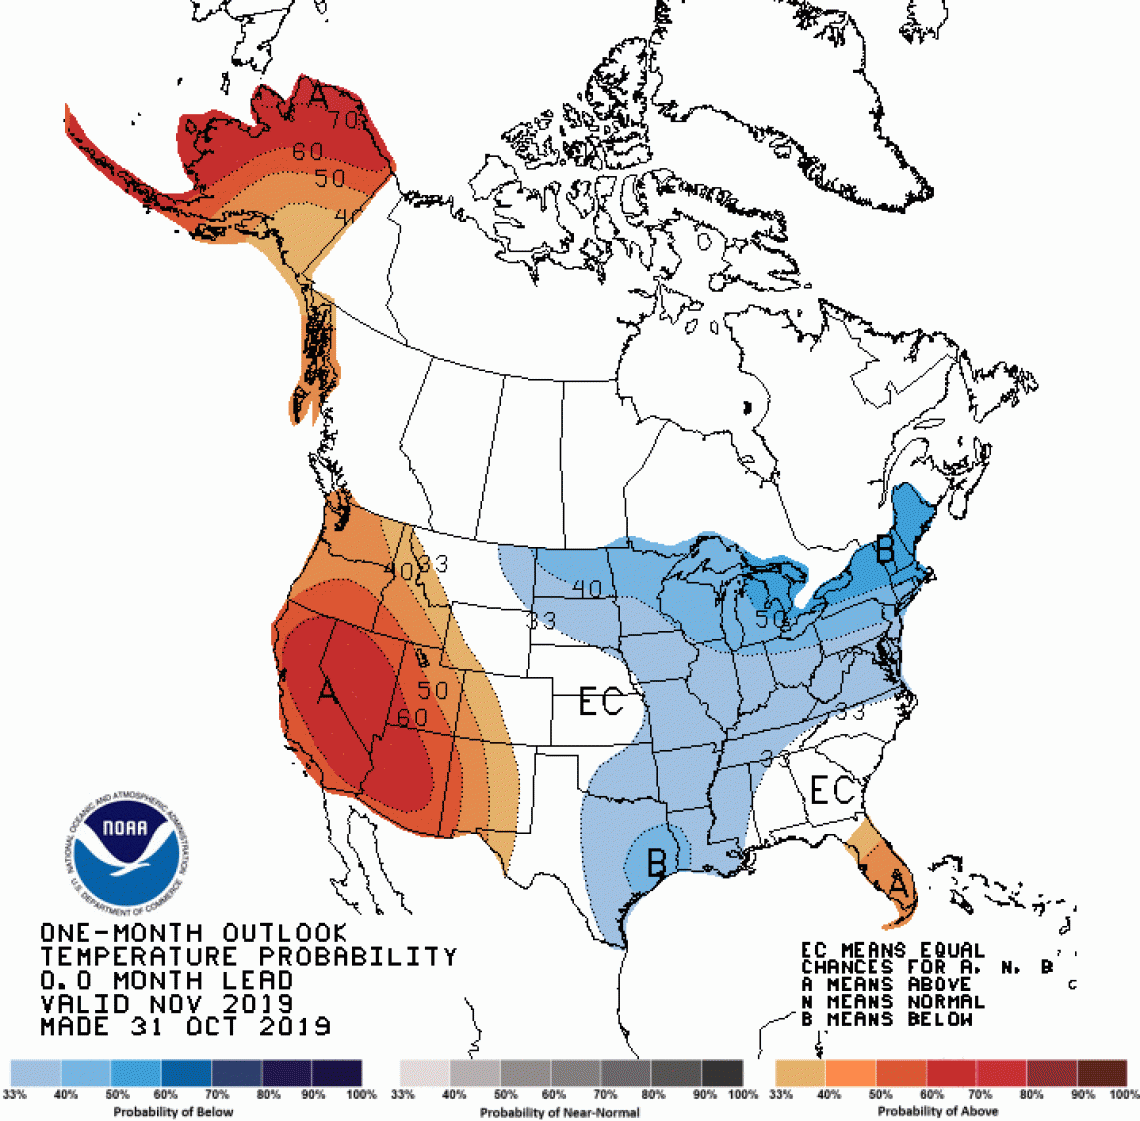
A moderate increase in chances for above-average temperatures exists for Arizona (dark orange and red areas on map). A slight increase exists across New Mexico (light orange areas on map) except for the eastern plains, where there are equal chances for above-, near-, or below-normal temperatures for the month (white area on map). As recent freezing temperatures may have knocked back canopies or otherwise influenced vines in the warmer growing areas of the region to start wrapping up the 2019 growing season, higher-than-average temperatures this time of year may pressure the plants to leaf out again before going dormant for the winter. This comes at a cost to the vines, as they spend carbohydrate reserves that otherwise would have been used during dormancy and for bud break next spring. Whether or not this is a detriment to the plant is something we’d like to learn more about.
2019-nov-temp-outlook-noaa-cpc.gif
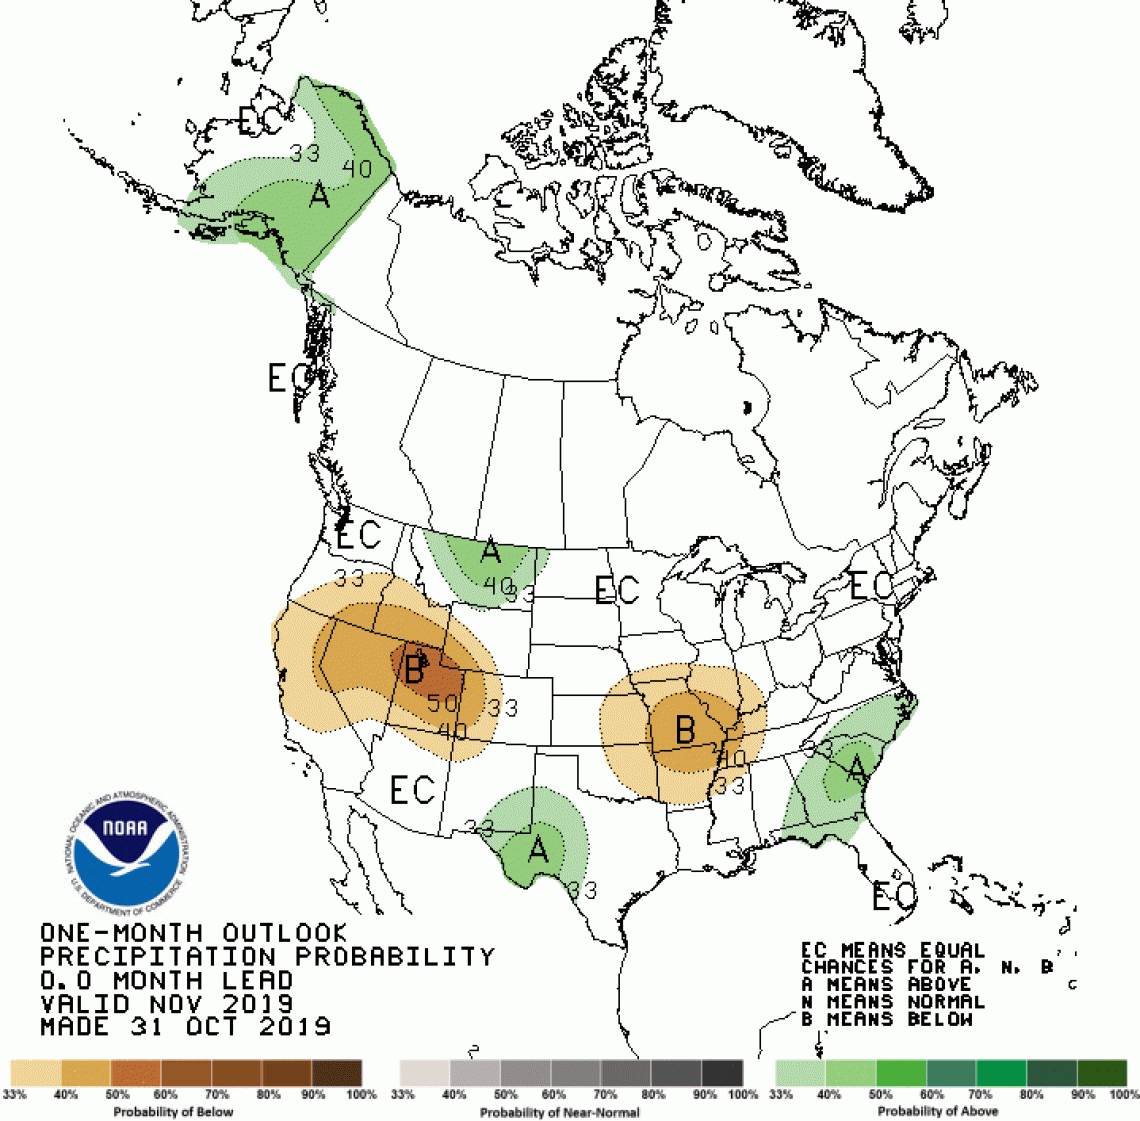
There is a slight increase in chances for below-normal precipitation across extreme northern Arizona and northwestern New Mexico (light brown area on map). A slight increase in chances for above-normal precipitation exists for southeastern New Mexico (light green area on map). Otherwise, equal chances exist for above-, near-, or below-average precipitation totals for the month (white area on map). Although the 2019 growing season has or is coming to a close, it is still critical to keep an eye on soil moisture levels in the vineyard. Levels that are too low for this time of year can lead to delayed spring growth, which manifests as uneven bud break, stunted growth, reduced flower clusters, and other issues. Without a good series of cool-season storms, irrigating over the next few months may be necessary.
2019-nov-prcp-outlook-noaa-cpc.gif
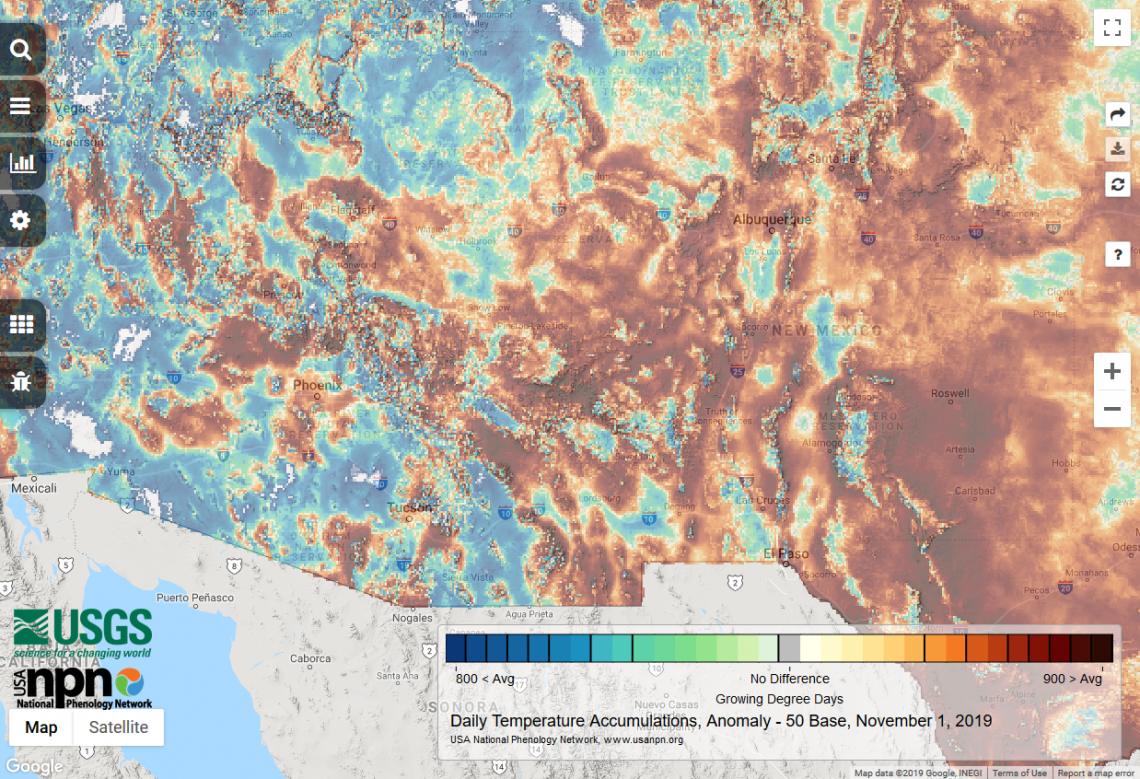
Wrapping Up Heat Accumulation for the 2019 Growing Season
A variable that helps us understand and predict the timing of vine growth stages is the accumulation of heat during the year, often quantified by the sum of growing degree days (GDDs).
As mentioned in previous newsletter issues, timing of vine growth stages appears more sensitive to cooler- or warmer-than-normal temperatures during spring. If growth stages earlier in the year like budburst and flowering are behind or ahead of their average dates, the timing of subsequent phenological stages like the start of ripening and harvest often follow suit.
Several Arizona growers noted at our ‘growing season in review’ workshops that relatively cool May and June temperatures across the state had a role in delaying harvests this year. This is reflected by current accumulated GDDs that show heat accumulation for the 2019 growing season is below normal for several parts of Arizona (blue and green areas on map). This is the case, for example, in the Sonoita, Willcox, and, to a lesser degree, locations within the proposed Verde Valley American Viticultural Areas (AVAs). Heat accumulations in several other parts of the state, however, are above average (yellow, orange, and brown areas on map). In New Mexico, where May temperatures weren’t as much below normal, heat accumulations are slightly to much above-average for almost all of the state (yellow, orange, and brown areas on map). Current accumulated GDDs also are lower than values from this time last year for several winegrape growing areas.
Another interesting observation from growers this year was the shortened duration of the harvest period. Part of the explanation may be due to above-average temperatures in August leading to rapid increases in grape sugar levels. Another part may be due to which grape varieties had their phenology delayed in a relatively cool May and June. If early varieties – those that reach growth stages earlier than others – were slowed down, and late varieties – those that reach growth stages later than others – were not, it may have delayed harvest of the early varieties and moved it closer to that of the late varieties. The result: a vineyard traffic jam.
2019-nov-cgdd-usgs-npn.png
Growing Season Temperature
Another way to characterize a growing season is by looking at the average temperature between April 1 and October 31. We have seen this measure used as a simple way to compare different winegrape growing regions and as a first guess of which grape varieties might do well in a new area.
In 2019, the growing season temperature (orange and blue solid lines) was slightly above the 1981-2010 average value (orange and blue dashed lines) for both the Willcox and proposed Verde Valley American Viticultural Areas (AVAs). In contrast, the growing season temperature (green solid line) for the Sonoita AVA was slightly below normal (green dashed line). Shading on the three graphs represents the range of growing season temperature across an individual AVA, except for the coldest and hottest locations.
Looking back to 1981, a few things stand out. The proposed Verde Valley AVA often is slightly warmer than the Willcox AVA, and both of these AVAs are warmer than the Sonoita AVA. All three AVAs follow a similar up-and-down pattern from year to year, which reflects interannual variations of the regional climate. Also, growing season temperatures have been near or above normal since 2000, particularly for the Willcox and proposed Verde Valley AVAs.
But we know that the devil is in the details. As described in this and previous newsletter issues, it matters when below-, near-, or above-average temperatures occur during a growing season. It’s a big part of what makes a vintage a vintage.
gst-time-series-stack-logo.png
A big thank you to those who attended the Verde Valley and southeastern Arizona editions of our first-ever ‘growing season in review’ workshop for Arizona winegrape growers! We are combining all of the great input and plan to have a summary document available soon.
For those of you in southeastern Arizona, Cooperative Extension manages an email listserv in coordination with the Tucson forecast office of the National Weather Service to provide information in the days leading up to agriculturally important events, like heavy precipitation related to tropical cyclones and the first fall freeze. Please contact us if you'd like to sign up.
Please feel free to give us feedback on this issue of the Climate Viticulture Newsletter, suggestions on what to include more or less often, and ideas for new topics.
Did someone forward you this newsletter? Please contact us to subscribe.
Have a wonderful November!
With support from:
