
Climate Viticulture Newsletter - 2020 April
< Back to Climate Viticulture Newsletter
Hello, everyone!
This is the 2020 April issue of the Climate Viticulture Newsletter – a quick look at some timely climate topics relevant to winegrape growing in Arizona and New Mexico.
A Recap of March Temperature and Precipitation
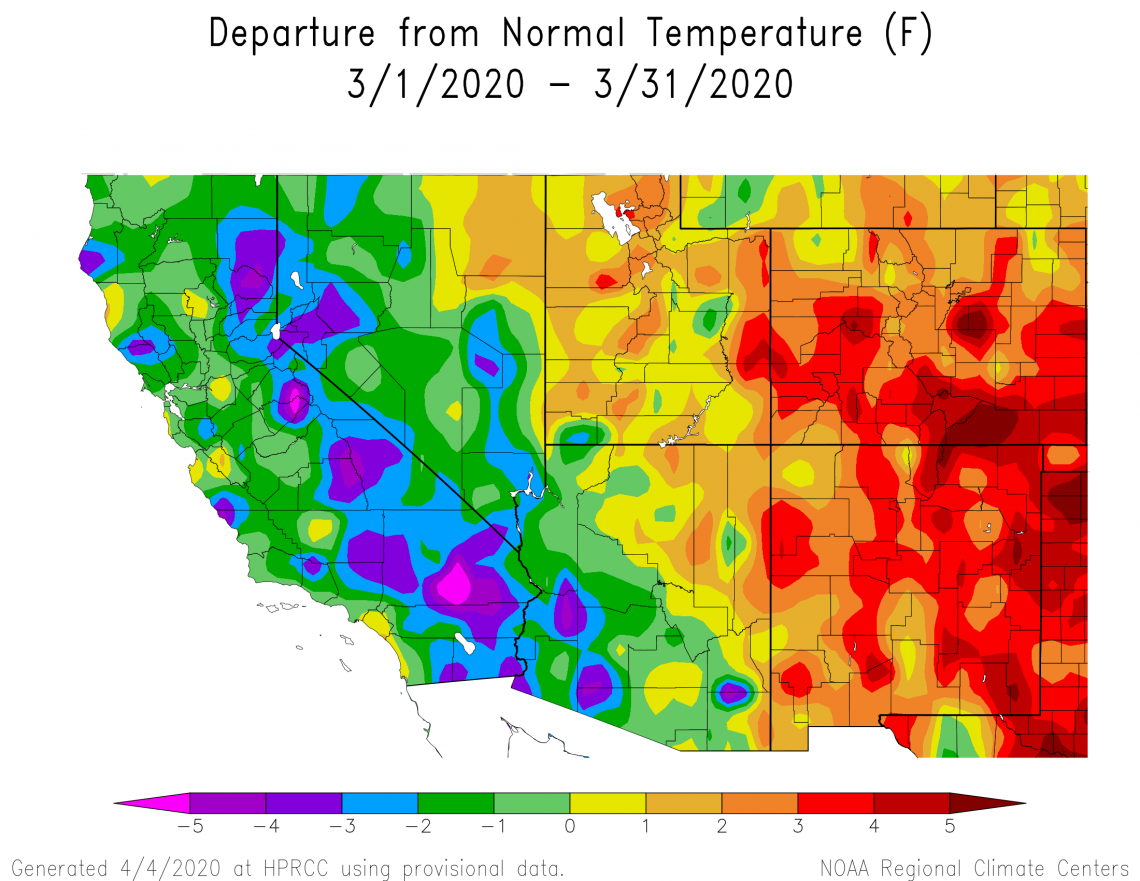
Talk about covering both ends of the spectrum! Monthly average temperatures in March went from 1° to 5° Fahrenheit below the 1981-2010 normal across southwestern Arizona (dark green, blue, and purple areas on map) to 1° to 5° Fahrenheit above normal across much of northwestern Arizona and almost all of New Mexico (orange and red areas on map). Near-normal temperatures for southeastern and north-central Arizona were sandwiched in between (light green and yellow areas on map). Perhaps the most important lens through which to look at temperature this time of year is heat accumulation and its influence on the start of the growing season for varieties in the warmer winegrape-growing areas of the region. More on this below.
2020-apr-last1m-temp-noaa-acis.png
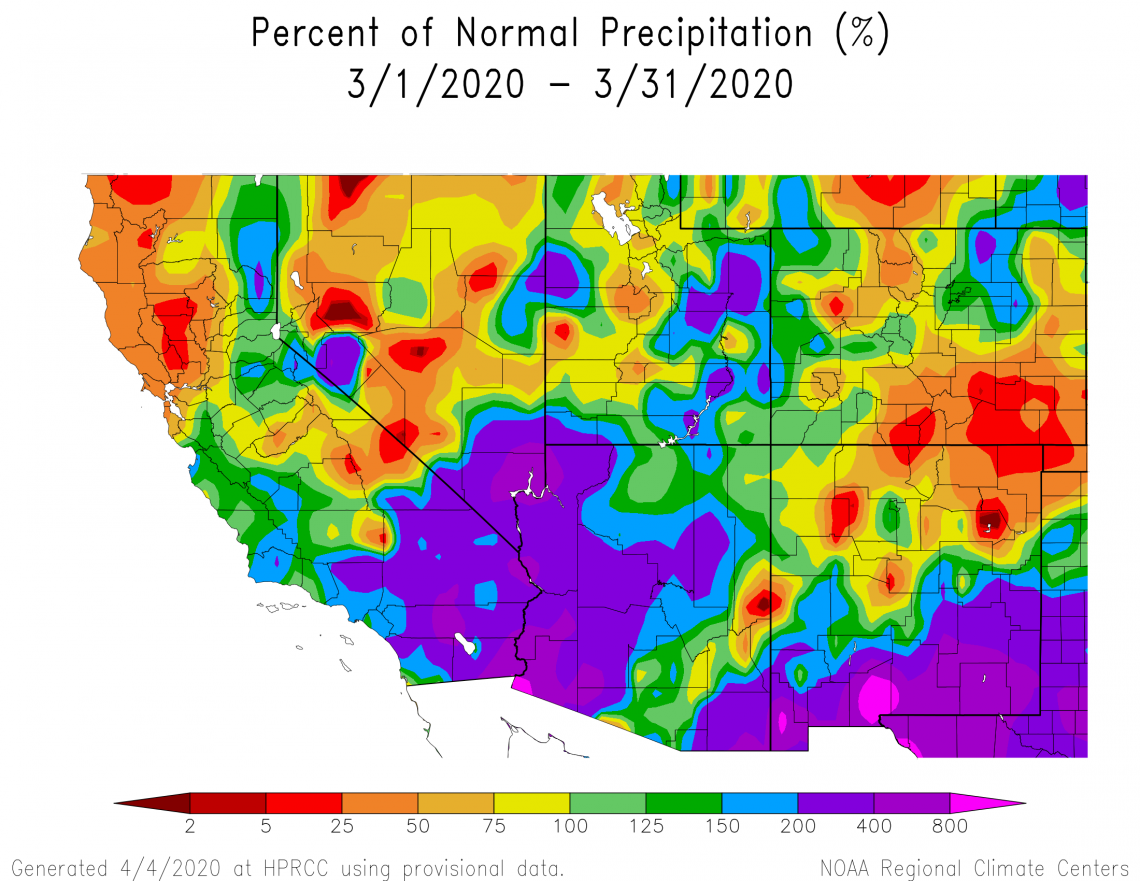
Like February, monthly precipitation totals were a story of ‘haves’ and ‘have nots’. Amounts above the 1981-2010 average covered much of western and central Arizona, as well as a swath across extreme southeastern Arizona and southern New Mexico (dark green, blue, purple, and magenta areas on map). Near-normal amounts occurred for much of the rest of Arizona and northern New Mexico (light green and yellow areas on map), except for the extreme northeastern part of the Land of Enchantment that experienced below-normal amounts (orange and red areas on map). Precipitation totals over the past four months were above average for the American Viticultural Areas (AVAs) in Arizona and southern New Mexico, which could help set a stage for good initial growth this spring.
2020-apr-last1m-prcp-noaa-acis.png
The Outlook for April Temperature and Precipitation
Equal chances for above-, near-, or below-normal temperatures for the month exist for almost all of the region (white area on map). There is a slight increase in chances for above-average temperatures across southeastern New Mexico (light orange area on map). Without a strong leaning toward cooler- or warmer-than-average conditions for the coming few weeks, it is hard to say if shoots will develop more slowly or quickly than one might expect in vineyards where the growing season has started.
2020-apr-temp-outlook-noaa-cpc.gif
Like the temperature outlook, there are equal chances for above-, near-, or below-average precipitation totals for almost all of the region this month (white area on map). There is a slight increase in chances for above-normal precipitation across extreme northwestern Arizona (green area on map). Despite this uncertainty, many areas across southern Arizona and New Mexico head into April having received above-average precipitation totals over the past four months. The resulting increase in soil moisture may lower irrigation needs as we start the growing season.
2020-apr-prcp-outlook-noaa-cpc.gif
An Update on Vine Dormancy and the Start of the Growing Season
If we had to guess when bud burst occurred or will occur near the Willcox Bench station of the Arizona Meteorological (AZMET) Network, we would be strongly inclined to say ‘about the same time as last year’. Much like the story in newsletter issues for the past two months, accumulated chill portions and growing degree days in 2020 (solid and dotted pink lines, respectively) continue to closely follow chill and heat accumulations from winter 2018-2019 (solid and dotted purple lines, respectively).
As mentioned in the March special issue, we have been taking the ‘analogs’ page from the weather forecasting playbook to get a better idea of when the growing season might start by pairing information in these graphs with your experience from previous years. We also noted the importance of having phenology records for not only an analog approach to be useful, but also for it to be possible to develop region-specific phenological models with greater predictive power. Let’s keep working together on this!
Based on growing-degree-day information from the National Phenology Network, heat accumulations are similar to or slightly lower than those at this time last year for the Willcox, Sonoita, and proposed Verde Valley American Viticultural Areas (AVAs). Thus, it’s possible that timing of bud burst is like or a bit later than last year in some Arizona AVA locations. It’s a similar situation for the Mesilla Valley and Mimbres Valley AVAs in southern New Mexico and the Middle Rio Grande Valley AVA in central New Mexico. Nonetheless, heat accumulation already has been enough in some warmer winegrape-growing locations, like the New Mexico State University Fabian Garcia Science Center in Las Cruces, for early varieties to leaf out.
chill-heat-time-series-stack-2020apr-logo.png
Next up in the Classification Series, the Huglin Index
As noted in the February and March newsletter issues, climate-viticulture classifications are relatively simple measures that enable us to compare different winegrape-growing regions and provide us with a first guess of which grape varieties might do well in a new area. The latter application is related to vine phenology studies showing that some varieties require more heat accumulation during the growing season to ripen fruit than do others.
We’ve so far considered Growing Season Temperature and the Winkler Index. This month, we look at the Huglin Index. Like the Winkler Index, the Huglin Index is based on an accumulation of growing degree days during the growing season, but differs by including maximum daily temperatures and day length from April through September in its calculation. Pierre Huglin originally developed this heat-sum based index in the late 1970s for viticulture in France. Since then, this index has been widely applied to characterize winegrape-growing regions in Europe, the western U.S., Australia, and elsewhere.
With data from 1981 through 2010, Huglin Index values across Arizona and New Mexico reflect what we saw with the Growing Season Temperature and Winkler Index measures, namely that American Viticultural Areas (AVAs) in both states lie at the warm end of the winegrape-growing spectrum. For instance, the proposed Verde Valley, Willcox, Mimbres Valley, and Mesilla Valley AVAs fall almost entirely within the ‘very warm’ and ‘too hot’ categories, whereas much of the Sonoita and Middle Rio Grande Valley AVAs fall within the ‘warm’ and ‘very warm’ categories.
What other winegrape-growing regions of world have Huglin Index values like those for these AVAs? The ‘very warm’ and ‘too hot’ categories, for instance, also characterize the Lodi and Madera AVAs in central California1, the Condado de Huelva and Jerez-Xérès-Sherry Denominaciónes de Origen Protegido in southwestern Spain2, and the Riverina and Riverland Geographical Indications in Australia3. So, although the Huglin Index is useful in a general context, examination of additional climate and other environmental factors seems necessary to better understand viticulture, terroir, and varietal suitability in Arizona and New Mexico. We will be doing just that in coming newsletter issues.
1Jones and others
cvn-v202004-huglin-index-topowx800m-logo.png
For those of you in southeastern Arizona, Cooperative Extension manages an email listserv in coordination with the Tucson forecast office of the National Weather Service to provide information in the days leading up to agriculturally important events, like late spring freezes and excessively windy days. Please contact us if you'd like to sign up.
Please feel free to give us feedback on this issue of the Climate Viticulture Newsletter, suggestions on what to include more or less often, and ideas for new topics.
Did someone forward you this newsletter? Please contact us to subscribe.
Stay healthy!
With support from:
