
Climate Viticulture Newsletter - 2020 March
< Back to Climate Viticulture Newsletter
Hello, everyone!
This is the 2020 March issue of the Climate Viticulture Newsletter – a quick look at some timely climate topics relevant to winegrape growing in Arizona and New Mexico.
A Recap of February Temperature and Precipitation
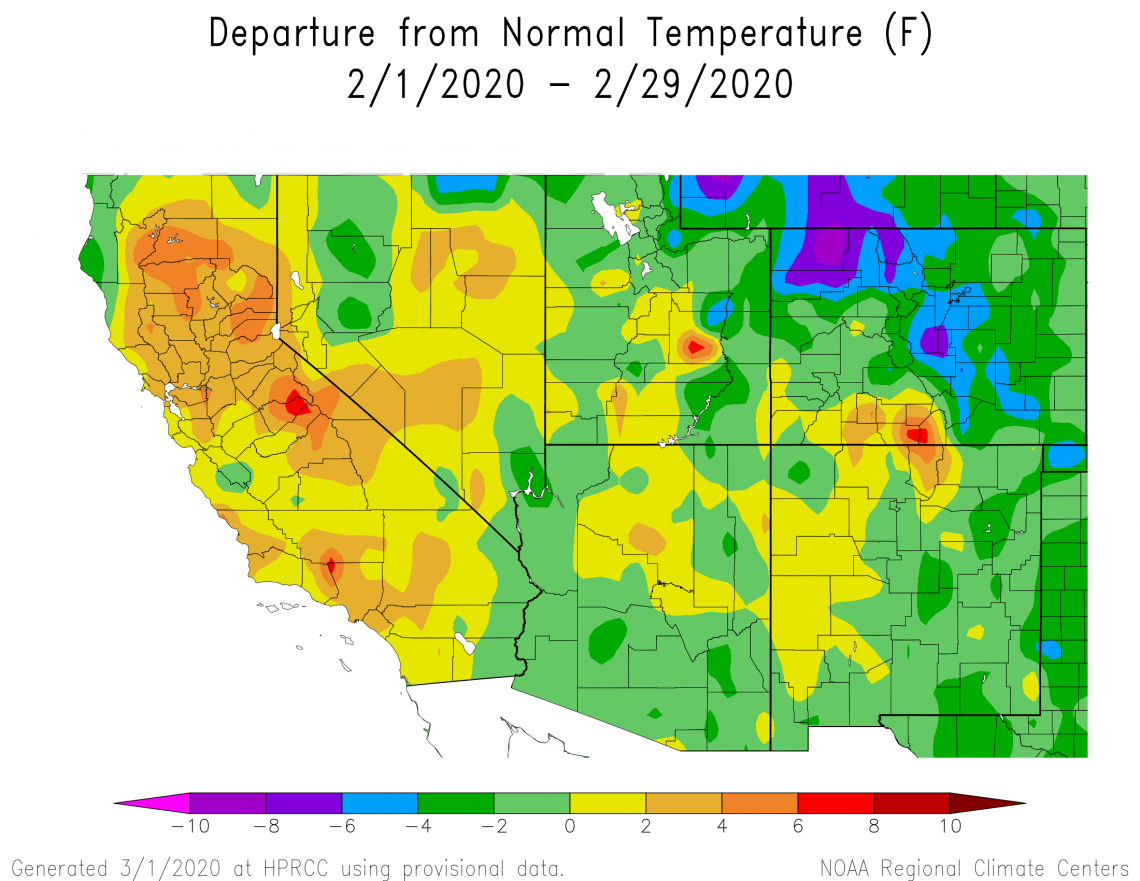
Monthly average temperatures in February were within 2° Fahrenheit of the 1981-2010 average for almost all of Arizona and New Mexico (yellow and light green areas on map). A few parts of the eastern plains of New Mexico, in contrast, were 2° to 4° Fahrenheit below normal (dark green areas on map). Despite a possible threat of cold injury to dormant vines in some locations during the first week of the month, extreme cold didn’t make any appearances. Nor were there any stretches of really warm temperatures to send the accumulation of heat units skyward and quickly draw the start of the growing season nearer, unlike at some vineyards in Sonoma County, California.
2020-mar-last1m-temp-noaa-acis.png
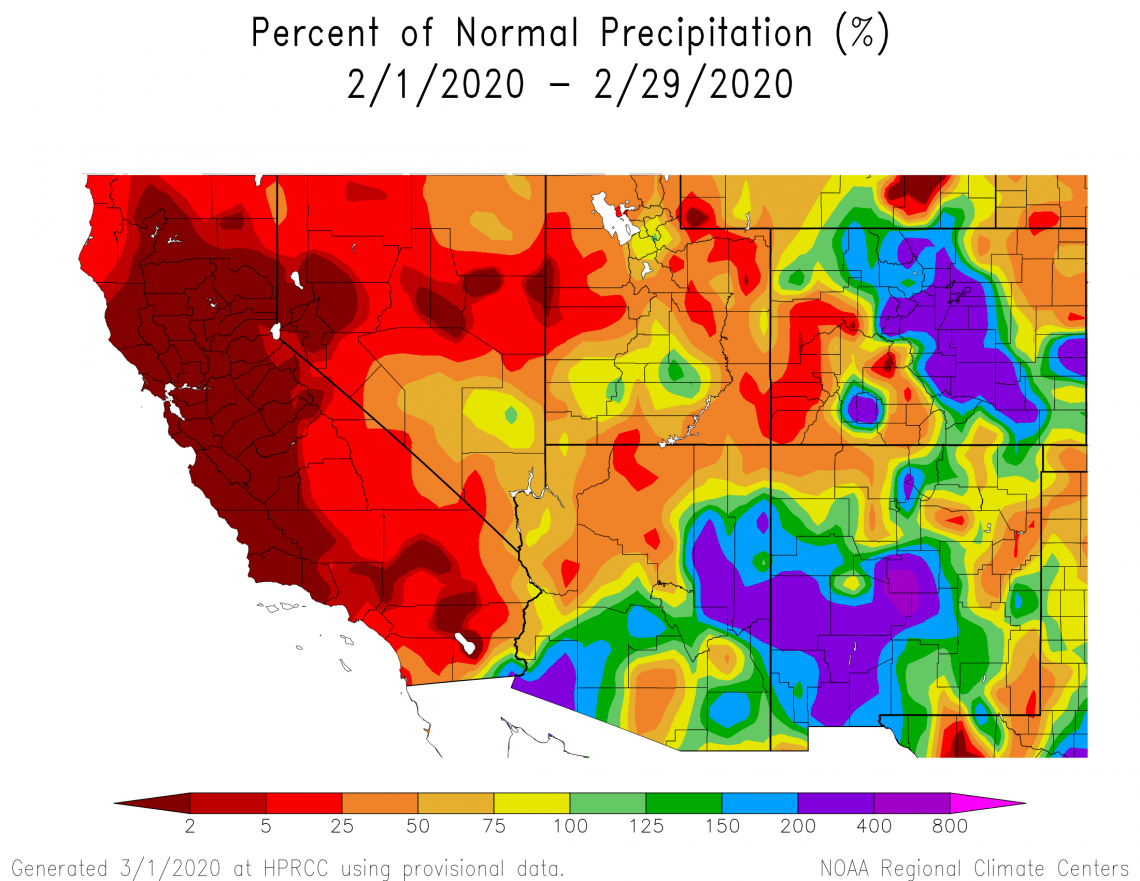
Monthly precipitation totals reflect the paths of the two storms that tracked across the region last month. Amounts above the 1981-2010 average occurred over a swath from southwestern Arizona to central New Mexico (dark green, blue, and purple areas on map). Below-average amounts fell over much of northern Arizona and extreme northern and eastern New Mexico (orange and red areas on map). Looking back over the past four months, cool-season precipitation totals have been above average for most of both states and could help set a stage like last year for good initial growth this spring.
2020-mar-last1m-prcp-noaa-acis.png
The Outlook for March Temperature and Precipitation
Variable weather is the anticipated backdrop for this month, especially as one moves towards the western part of the region. As a result, there is a slight increase in chances for above-average temperatures across all but northwestern New Mexico (light orange area on map). Equal chances for above-, near-, or below-normal temperatures for the month exist for the rest of the state and for all of Arizona (white area on map). Even more so than last month, how March turns out in terms of temperature will have a strong influence on whether bud break is relatively early, on-time, or late this growing season. More on this below.
2020-mar-temp-outlook-noaa-cpc.gif
The anticipated variable weather also leads to a slight increase in chances for above-normal precipitation across all of Arizona and the southwestern half of New Mexico (green areas on map). Equal chances exist for above-, near-, or below-average precipitation totals for the rest of the Land of Enchantment (white area on map). Having good soil moisture levels in vineyards as we get closer to the start of the growing season helps guard against delayed spring growth, which manifests as uneven bud break, stunted growth, reduced flower clusters, and other issues.
2020-mar-prcp-outlook-noaa-cpc.gif
An Update on Vine Dormancy and the Start of the Growing Season
Not much has changed since the February issue in terms of how current accumulated chill portions and growing degree days compare to recent years. In fact, you might even say that it would be very difficult to match chill and heat accumulations from winter 2018-2019 (solid and dotted purple lines, respectively) any better than with where conditions are right now (solid and dotted pink lines, respectively). At least this is the story at the Arizona Meteorological (AZMET) Network Willcox Bench station and, based on accumulated-growing-degree-day information from the National Phenology Network, also at other relatively warmer grape-growing areas in the region.
With the slight increase in chances for above-average temperatures across all but northwestern New Mexico and equal chances for above-, near-, or below-normal temperatures across Arizona that we saw above, there aren’t really any clear signs whether conditions diverge from or stay in line with a path like last year that would suggest a relatively late start to the growing season. Please let us know if you would like to see a special update on this topic in the middle of March.
chill-heat-time-series-stack-2020mar-logo.png
A Look towards the Last Spring Freeze
A significant challenge for many winegrape growers throughout the world is the potential for freezing temperatures close to the start of the growing season. The resulting freeze damage can vary by location within a vineyard, variety, and vine growth stage (green swollen buds versus bud burst versus two leaves present, for example). Even though the plants can regrow from a secondary bud if the primary bud is damaged, yield typically is less than 50% in such circumstances, especially for Vitis vinifera varieties.
We can expect the last spring freeze to occur in May or later for much of northern Arizona and New Mexico (darker blue areas on map), based on an average of dates during the 1981-2010 climatological period. We generally find relatively cool winegrape-growing areas in these parts of the region. For the relatively warmer winegrape-growing areas in Arizona, we can expect it to occur in late March or early April for the proposed Verde Valley American Viticultural Area (AVA) and sometime in April for the Sonoita and Willcox AVAs (lighter blue areas on map). Climatological dates for the last spring freeze are similar for the Mesilla Valley and Mimbres Valley AVAs in southern New Mexico and the Middle Rio Grande Valley AVA in central New Mexico.
cvn_v202003_lsf_topowx800m_logo.png
Next up in the Classification Series, the Winkler Index
As noted last month, climate-viticulture classifications are relatively simple measures that enable us to compare different winegrape-growing regions and provide us with a first guess of which varieties might do well in a new area. The latter application is related to vine phenology studies showing that some varieties require more heat accumulation during the growing season to ripen fruit than do others.
About 50 years ago, A. J. Winkler and colleagues published a book on viticulture, part of which showed five climatic regions for grape growing in California that were mapped based on different amounts of accumulated growing degree days from April through October. More recent studies have applied this index to describe winegrape-growing regions in the northwestern U.S. and Australia.
Using data from 1981 through 2010 across Arizona and New Mexico, you’ll note that what we see with the Winkler Index is very similar to what we saw with the average-growing-season-temperature measure we looked at last month. With the Winkler Index, for example, much of the proposed Verde Valley and Willcox American Viticultural Areas (AVAs) fall within Region V, whereas much of the Sonoita AVA falls within Region IV.
So, what does this tell us? One thing is that these AVAs are at the warm end of the winegrape-growing spectrum. This isn’t surprising given that there is no problem ripening fruit from varieties like Grenache / Garnacha and Tannat, which have high heat-accumulation requirements to do so.
Nonetheless, if you hear about Winkler Index classes in other winegrape-growing regions, you now know how such areas in Arizona and New Mexico compare. We’ll continue our tour of climate-viticulture classifications in coming newsletter issues.
cvn_v202003_wi_topowx800m_logo.png
Registration is now open for the 2020 University of Arizona Viticulture Symposium on March 31. Contact Joshua Sherman, Commercial Horticulture Agent with Cooperative Extension, by email or telephone at 520-766-3603 for more information.
For those of you in southeastern Arizona, Cooperative Extension manages an email listserv in coordination with the Tucson forecast office of the National Weather Service to provide information in the days leading up to agriculturally important events, like late spring freezes and excessively windy days. Please contact us if you'd like to sign up.
Please feel free to give us feedback on this issue of the Climate Viticulture Newsletter, suggestions on what to include more or less often, and ideas for new topics.
Did someone forward you this newsletter? Please contact us to subscribe.
Have a great March!
With support from:
