
Climate Viticulture Newsletter - 2020 November
< Back to Climate Viticulture Newsletter
Hello, everyone!
This is the 2020 November issue of the Climate Viticulture Newsletter – a quick look at some timely climate topics relevant to winegrape growing in Arizona and New Mexico.
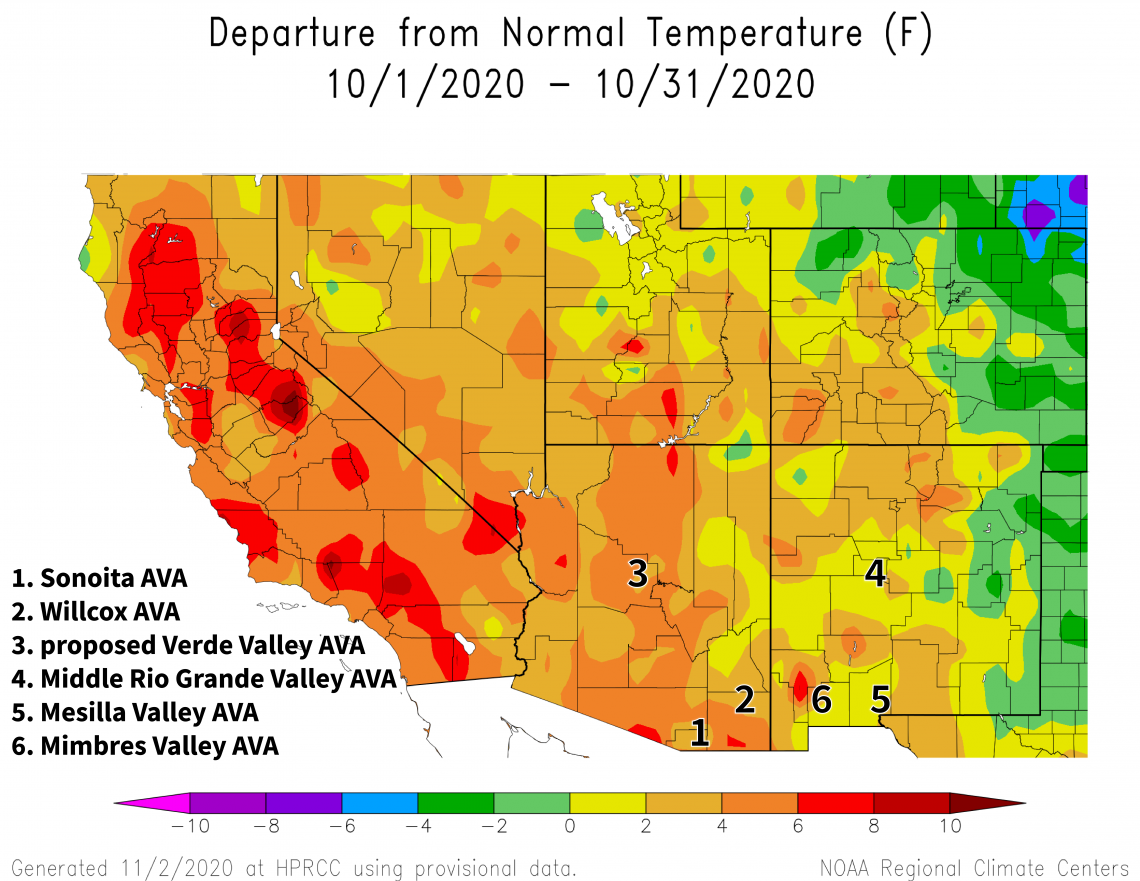
A Recap of October Temperature and Precipitation
Average temperatures last month were 2°F to 6°F warmer than the 1981-2010 normal for much of Arizona (light and dark orange areas on map). Such warmer-than-normal temperatures also were widespread in northwestern and southwestern New Mexico, while near-normal temperatures occurred over much of the rest of the state (yellow and light green areas on map). Despite the mostly warm conditions, a few days of noticeably colder temperatures appeared late in the month, resulting in some records as well as the first fall freeze that marked the end of the 2020 growing season for many locations. For comparison, temperatures in October 2019 were within 3°F of normal for much of the region, with parts of northern and eastern New Mexico 3°F to 6°F below normal.
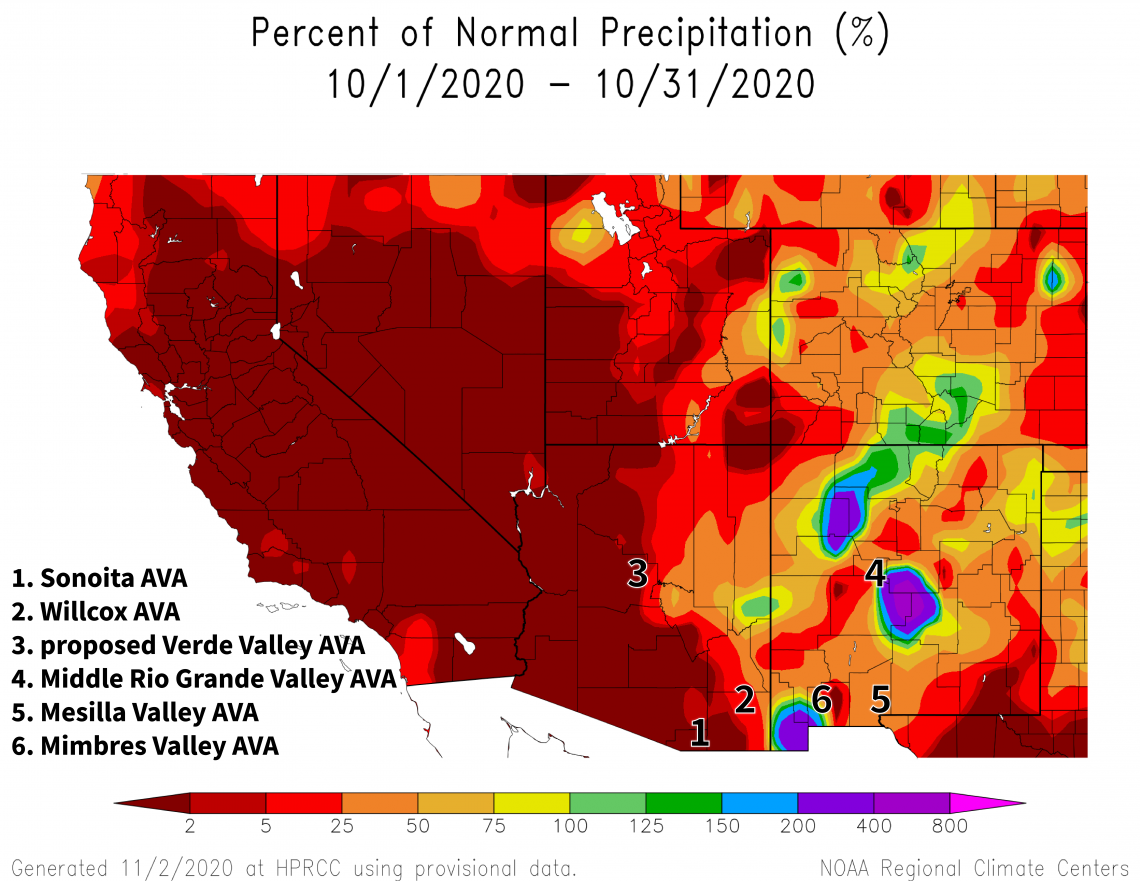
Even though the cold, late-October storm brought rain and snow, monthly precipitation totals still were less than 50% of the 1981-2010 normal for almost all of Arizona (dark orange and red areas on map) and between 25% and 75% of normal for most of New Mexico (dark and light orange areas on map). A few locations in the latter state did luck out, however, and measure above-normal totals (green, blue, and purple areas on map). October precipitation last year was similarly dry except for southeastern New Mexico, where tropical-storm remnants arrived and above-normal amounts occurred.
For some areas of the region like southeastern Arizona, fall 2020 so far ranks as the warmest and driest on record. After a record-setting hot and dry summer, such conditions likely did no favors during the post-harvest period, unless vineyard irrigation was adequate. Further affecting this part of the growing season for the second year in a row was a late-October hard freeze. The time after harvest for vines to photosynthesize and store carbohydrates thus may have been less effective and shorter relative to some previous years, particularly for warmer growing areas. Hopefully, these events do not impact carbohydrate reserves that plants will use for canopy and fruit growth in 2021.
The Outlook for November Temperature and Precipitation
There is a moderate increase in chances for above-normal temperatures across all of Arizona and New Mexico (dark orange area on map). As a comparison, temperatures in November last year were within 2°F of normal for much of the region, except for southern Arizona where temperatures were 2°F to 4°F above normal.
2020-nov-temp-outlook-noaa-cpc.gif
A moderate increase in chances for below-normal precipitation exists for eastern New Mexico (brown area on map), while a slight increase in chances for below-normal precipitation exists for western New Mexico and all but southwestern Arizona (light and dark tan areas on map). Equal chances for below-, near-, or above-normal precipitation exist for this corner of the Grand Canyon state (white area on map). Monthly precipitation totals in November 2019 were above 200% of normal for many areas, as several storms passed through the region.
With an elevated potential for warm and dry conditions to continue, due in part to the ongoing La Niña event, soil moisture in the vineyard may need closer attention this winter relative to the past two. Adequate levels will help guard against delayed spring growth, which manifests as uneven bud break, stunted growth, reduced flower clusters, and other issues.
2020-nov-prcp-outlook-noaa-cpc.gif
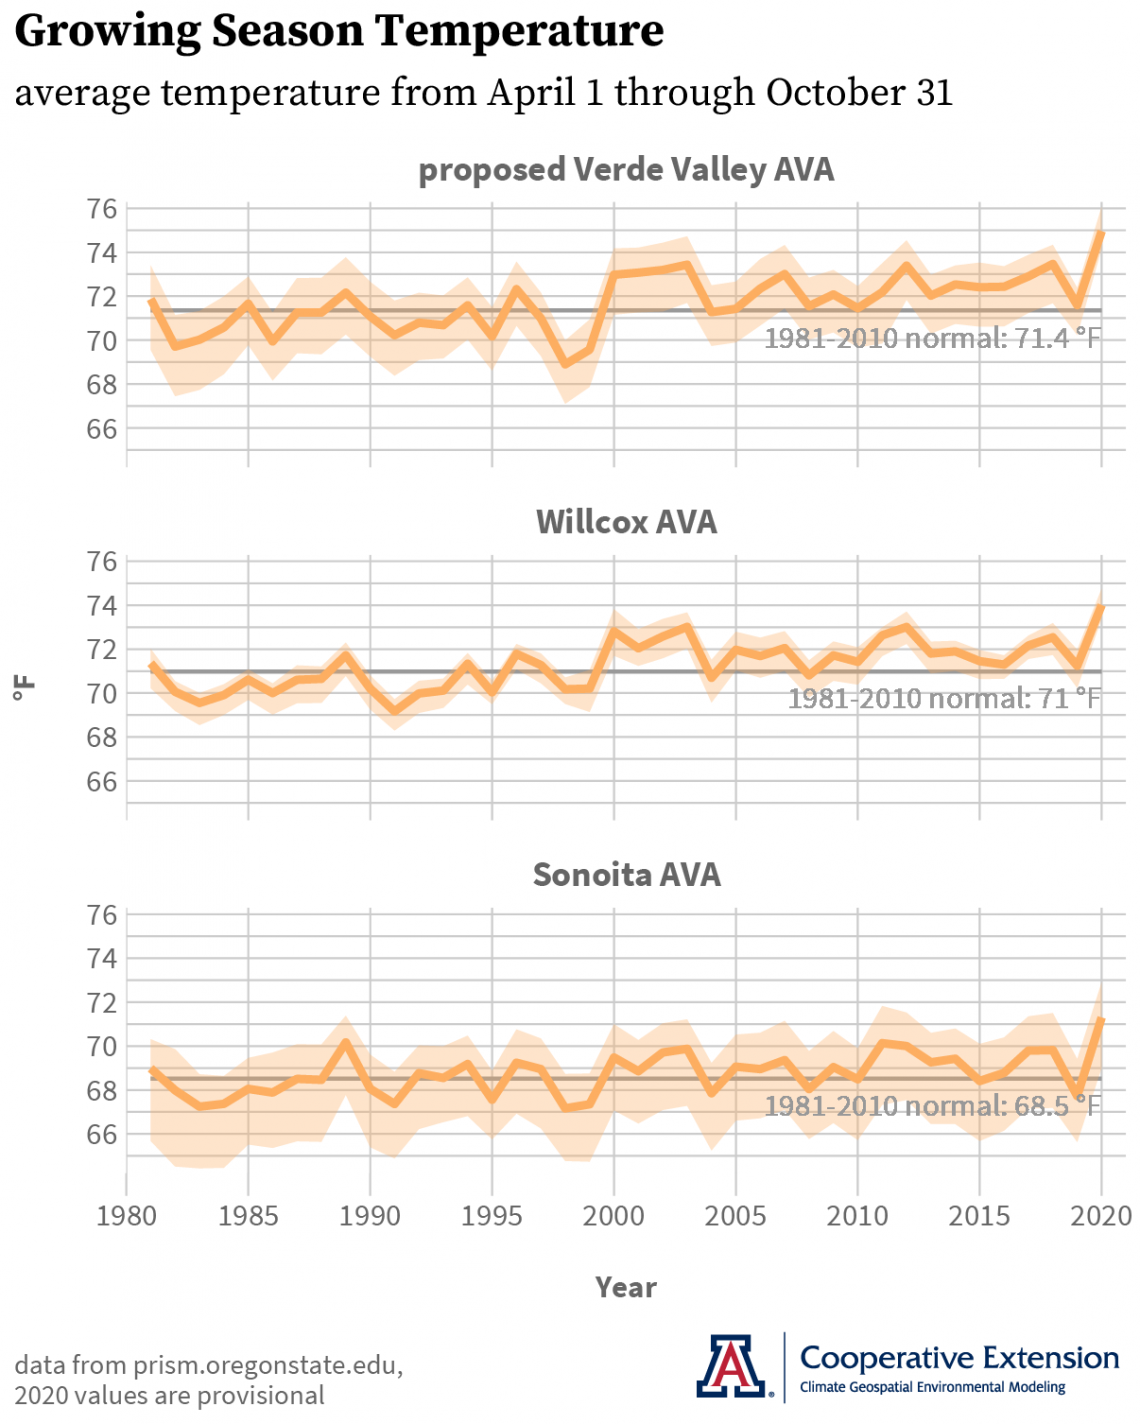
Growing Season Temperature
The average temperature between April 1 and October 31 is a simple measure used to compare different winegrape growing regions and as a first guess of which grape varieties might do well in a new area. Looking at the Sonoita, Willcox, and proposed Verde Valley AVAs as an example for our region, 2020 growing season temperatures – unsurprisingly – are the warmest of the past 40 years (orange lines and shading in graphs1). They also are the most recent in a string of mostly above-normal years since 2000.
As noted in our look at this topic last year, however, the devil is in the details. It matters when below-, near-, or above-normal temperatures occur during a growing season, because temperature influences so many aspects of vine growth and fruit quality. We’ve touched upon several of these in this and previous newsletter issues this year, often in the context of heat stress. Please let us know how much of a mark you think temperature will make on the 2020 vintage.
1 Orange lines represent the average growing season temperature across an individual AVA, and orange shading represents the range of growing season temperatures across an individual AVA, except for the coldest and hottest locations.
arizona-ava-gst-time-series-2020-11-04.png
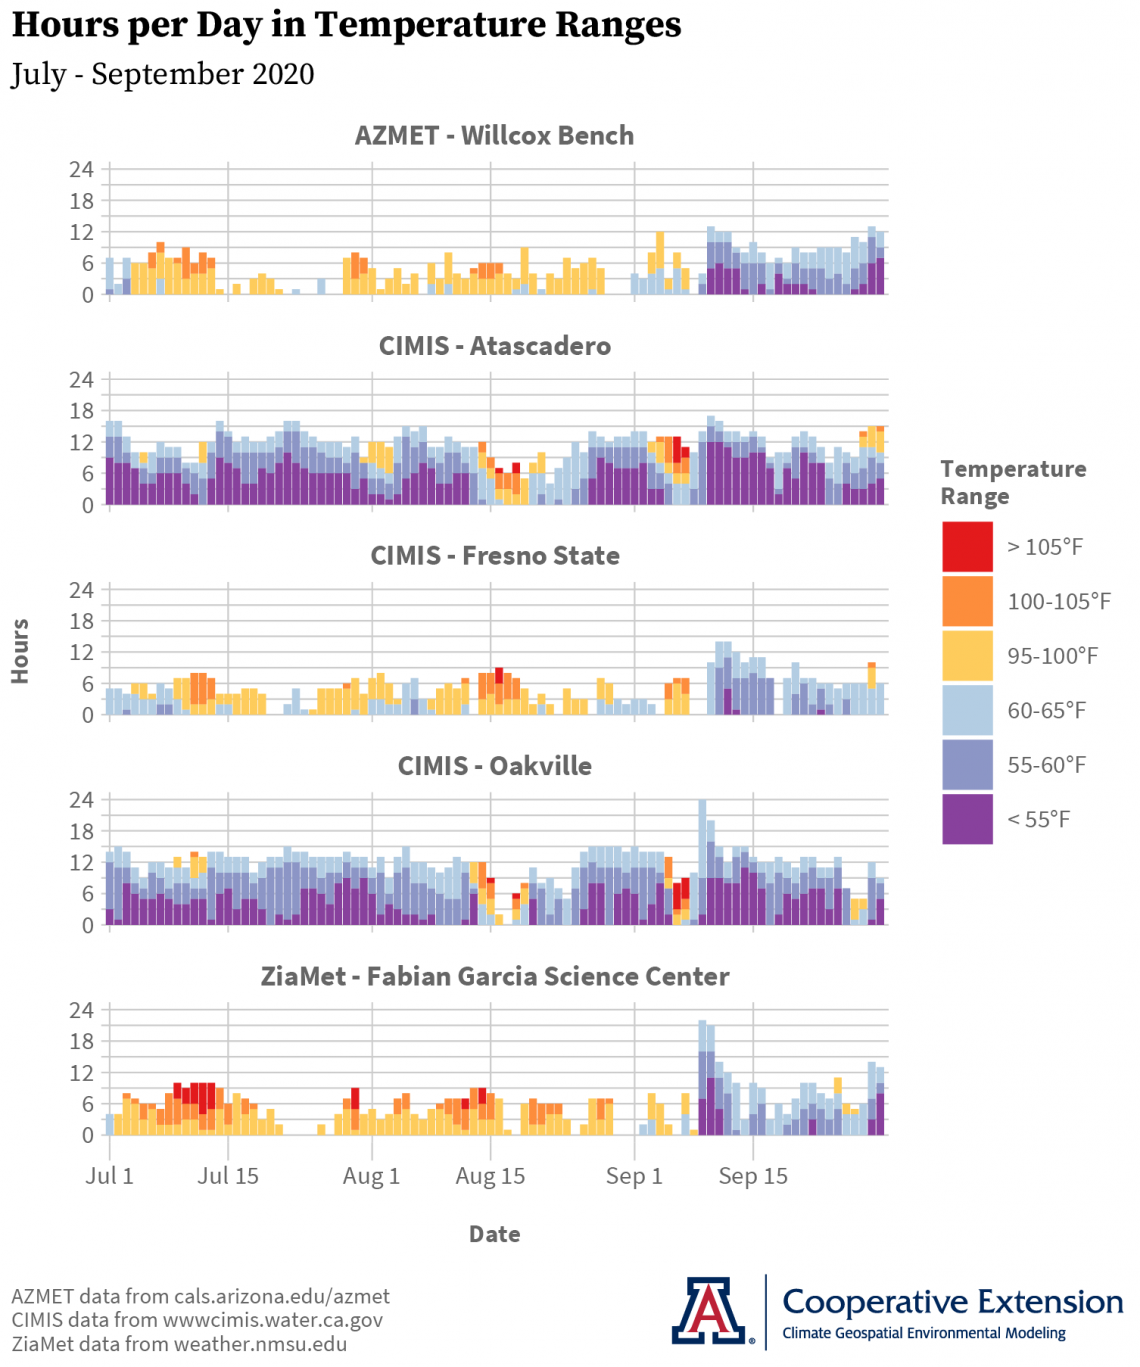
Temperature Ranges and the Ripening Period
One way in which we’ve tracked the influence of temperature this year is by the number of hours below 65°F and above 95°F during the ripening period. The reason why is that temperatures affect fruit quality through both afternoon maximums and early morning minimums.
At the AZMET Willcox Bench station in the Willcox AVA and ZiaMet Fabian Garcia Science Center station in the Mesilla Valley AVA, hours below 65°F were almost non-existent (blue and purple bars on graph) during July, August, and the first week of September in 2020, whereas hours above 95°F were almost a daily occurrence (yellow, orange, and red bars on graph). Only during the second, third, and fourth weeks of September did hours above 95°F relent and hours below 65°F return.
How similar is this amount of heat to other growing regions? Using California as an example, the hours per day below 65°F and above 95°F at these two stations look similar to those at the CIMIS Fresno State station in Fresno, CA. The pattern of daily temperature ranges at the Atascadero station in the Paso Robles AVA and Oakville station in the Napa Valley AVA, however, is different. Most days throughout the ripening period show several hours below 65°F, whereas very few days – many of which are during mid-August and early-September heat waves – show hours above 95°F. Comparisons like this can help with evaluating vineyard management options, such as trellis design and canopy characteristics, that are used in other growing regions and determining whether they are optimal for mitigating heat impacts in warmer growing areas of the Southwest.
Given the current situation regarding COVID-19, we currently are postponing the Growing Season in Review workshops for 2020.
Current forecasts still show that a weak or moderate La Niña event is very likely this winter and spring. A few forecast models recently have hinted that a strong event is even possible. Does the strength of a La Niña event matter for cool-season weather in the region? Yes. In general, the stronger the event, the greater the chances for below-average precipitation in the Southwest. With current forecasts, dry conditions in the region over the coming months are more likely but not heavily favored.
Undergraduate students in the College of Agriculture and Life Sciences at the University of Arizona are looking for internships with businesses and companies in the viticulture and winery industry during 2021. Please contact Danielle Buhrow, Senior Academic Advisor and Graduate Program Coordinator in the Department of Agricultural and Resource Economics, for more information.
University of Arizona colleagues in the Center for Regional Food Studies are surveying agricultural producers – including winegrape growers – in or near Arizona who sell to processors, distributors, or directly to consumers in Pima County. Their goal is to assess the impacts of the COVID-19 pandemic on the southern Arizona food system. The survey should take 15 to 30 minutes to complete and they are offering $15 compensation for the first 100 eligible respondents who complete the survey by November 28, 2020. More information is available here.
Isaac Mpanga, Area Associate Agent with Cooperative Extension in the Verde Valley, is leading a monthly series of remote meetings for commercial horticulture and small-scale farmers to share science-based information on topics like pests, diseases, marketing, and food safety. The goal is to help improve farm productivity, profitability, sustainability, and food security. Please email yavapaipres@cals.arizona.edu to register. The last meeting for 2020 is on November 16.
For those of you in southeastern Arizona, Cooperative Extension manages an email listserv in coordination with the Tucson forecast office of the National Weather Service to provide information in the days leading up to agriculturally important events, like winter storms and cold-air outbreaks. Please contact us if you'd like to sign up.
Please feel free to give us feedback on this issue of the Climate Viticulture Newsletter, suggestions on what to include more or less often, and ideas for new topics.
Did someone forward you this newsletter? Please contact us to subscribe.
Have a wonderful November!
With support from:
