
Climate Viticulture Newsletter - 2021 December
< Back to Climate Viticulture Newsletter
Hello, everyone!
This is the December 2021 issue of the Climate Viticulture Newsletter – a quick look at some timely climate topics relevant to wine grape growing in Arizona and New Mexico.
November Recap | December Outlook | La Niña 2021-2022 | Growing Season Temperature | Extra Notes
A Recap of November Temperature and Precipitation
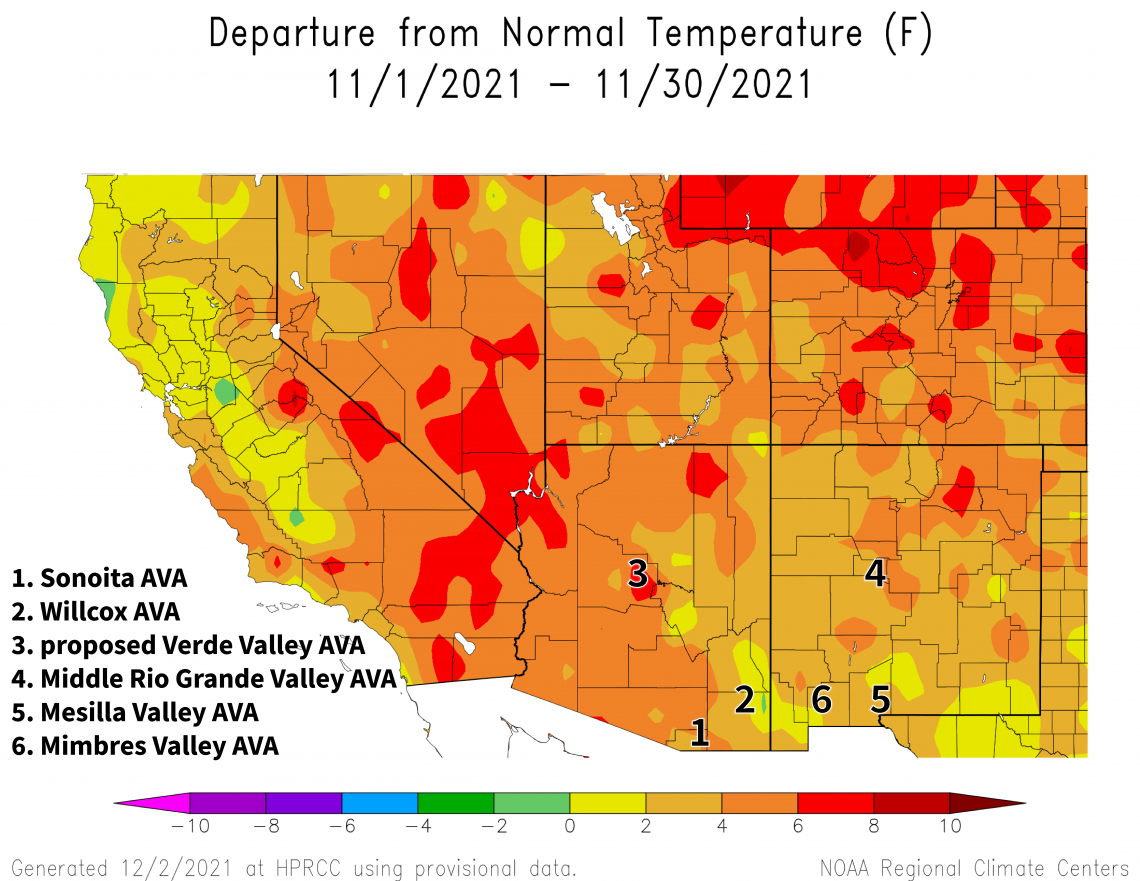
Monthly average temperatures were 2 to 6 °F above the 1991-2020 normal for almost all of the region (light and dark orange areas on map). This is similar to November last year when monthly temperatures were 2 to 6 °F warmer than the 1981-2010 normal for almost all of the Southwest.
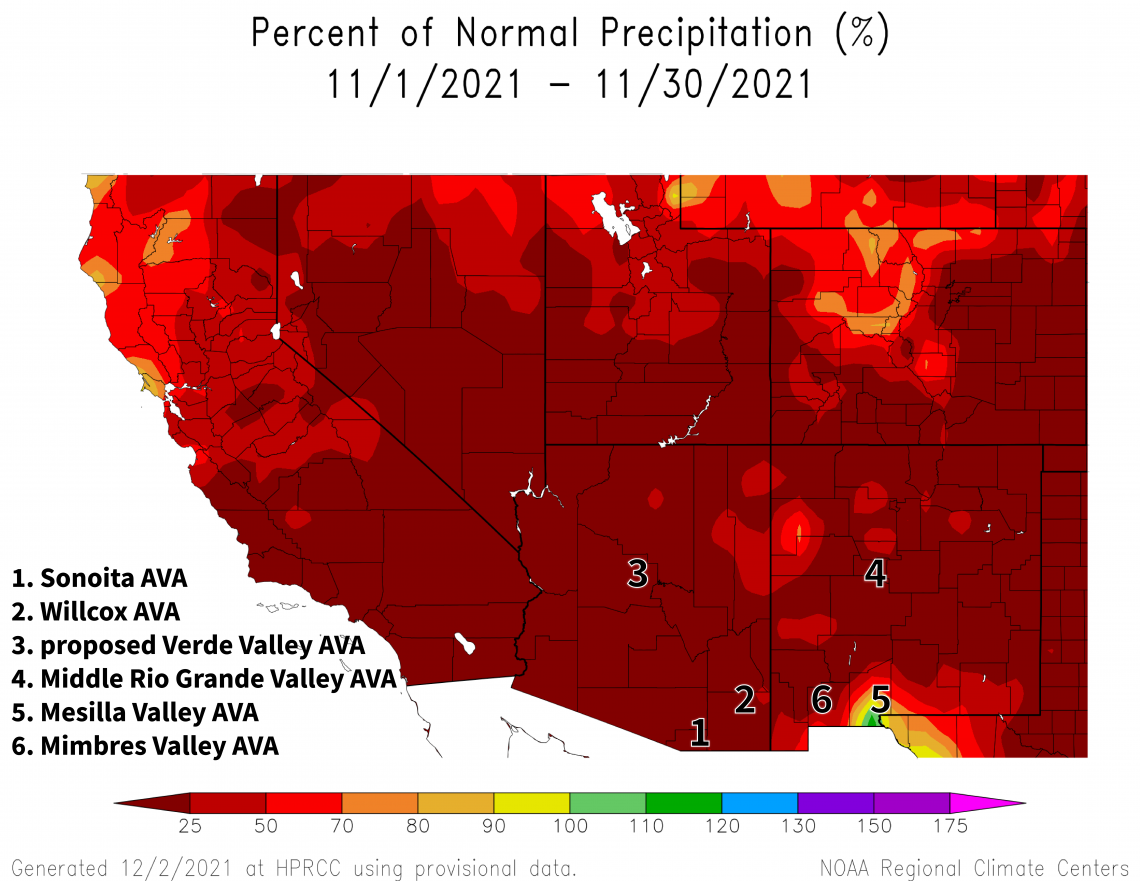
Monthly precipitation totals were less than 25 % of the 1991-2020 normal for almost the entire region (dark red area on map). This roughly translates to a loss of one-half to one inch for many growing areas. Precipitation during November 2020 was less than 50 % of the 1981-2010 normal for almost all of the region.
Like this past October, it isn’t surprising that last month was on the dry side for Arizona and New Mexico, as we’re now locked in to a ‘double-dip’ La Niña event. More on this below. Combining a relative lack of precipitation with relatively warm temperatures at this time of year may bring attention to the need for winter irrigation and the prevention of delayed spring growth. We recently caught a details-rich article on these topics from the Lodi Wine Growers.
View more NOAA ACIS climate maps
The Outlook for December Temperature and Precipitation
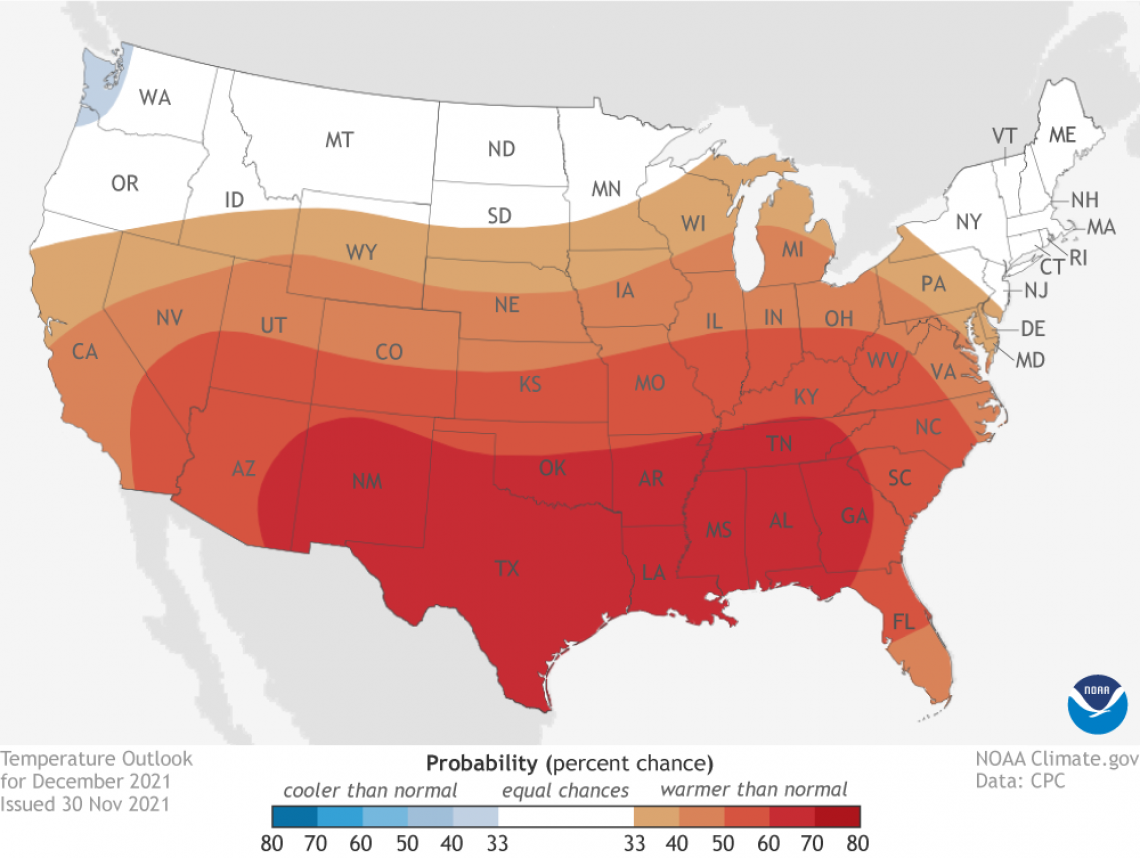
Temperatures for the coming month have moderate chances for being above the 1991-2020 normal for the entire region (dark orange and red areas on map). For reference, monthly temperatures in December last year were within 2 °F of the 1981-2010 normal for almost all of the Southwest.
2021-dec-temp-outlook-noaa-cpc.png
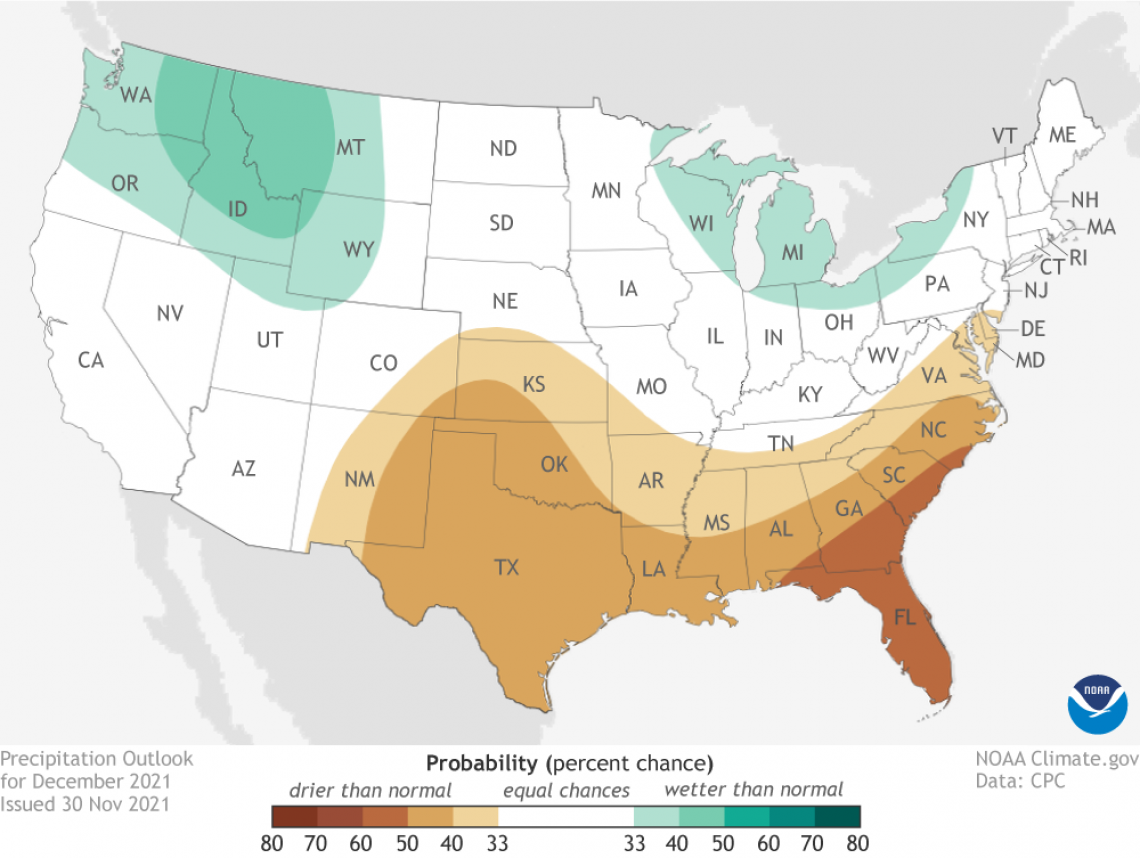
Precipitation totals for the coming month have slight chances for being below the 1991-2020 normal for the eastern two-thirds of New Mexico (tan and light-brown areas on map). Otherwise, there are equal chances for below-, near-, or above-normal amounts (white area on map). Precipitation during December 2020 was less than 50 % of the 1981-2010 normal for almost all of Arizona and much of New Mexico.
Given the relatively warm and dry conditions last month along with leanings towards a repeat of them this month, the November-December period in 2021 looks like it could be similar to what we experienced in 2017. Although it’s good practice to review field notes from any year, having another look at those from four years ago may be particularly worthwhile.
To stay informed of long-range temperature and precipitation possibilities beyond the coverage of a standard weather forecast, check in, too, with the six-to-ten-day outlook and eight-to-fourteen-day outlook issued daily by NOAA’s Climate Prediction Center.
Read more about the December 2021 temperature and precipitation outlook
2021-dec-prcp-outlook-noaa-cpc.png
La Niña 2020-2021
La Niña conditions strengthened over the past month. The most recent official forecast for ENSO, or El Niño Southern Oscillation – parts of the atmosphere and ocean across the tropical Pacific Ocean that cause El Niño and La Niña events – now shows a 90 % chance that this event will persist through February, and a 50 % chance of continuing from March through May. As we know, La Niña events generally mean below-normal precipitation for the Southwest during the cooler months of the year, something that won’t help the continuing regional drought conditions.
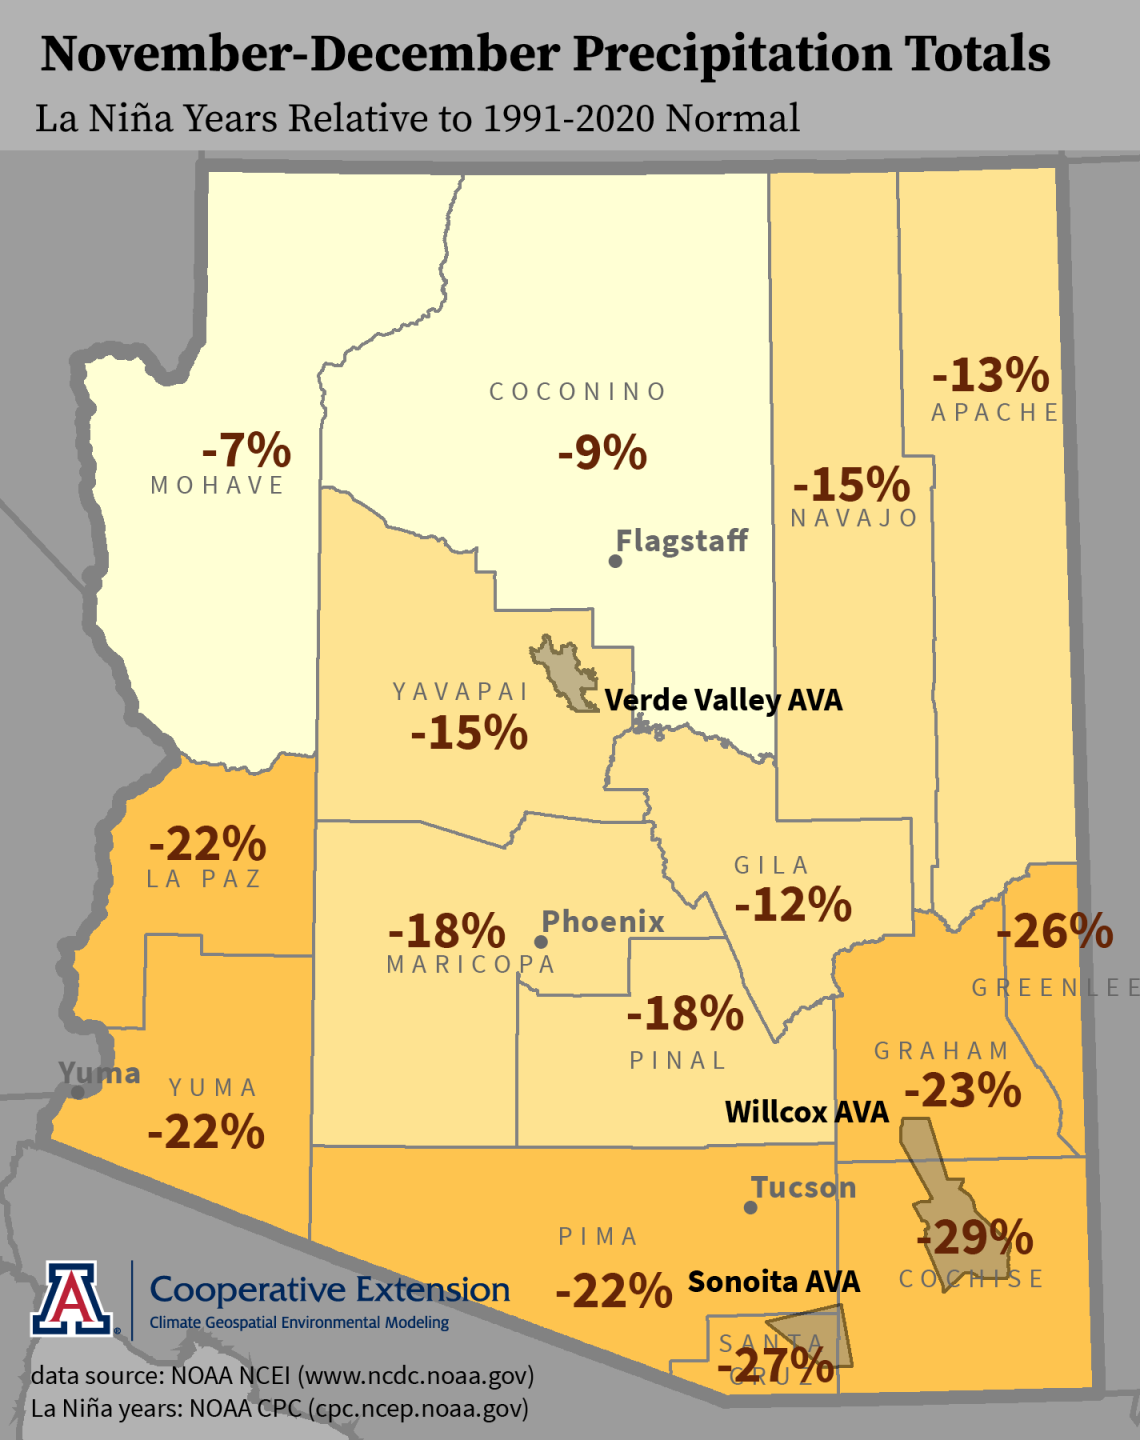
Despite generally bringing drier-than-normal conditions to the Southwest, how much past La Niña events influenced precipitation totals in November and December is not uniform across the region. In Arizona, for example, areas in the northern part of the state have been less affected than those in the southern part. Relative to the 1991-2020 normal, there has been an average 15 % reduction for Yavapai County and an average 25 to 30 % reduction for Santa Cruz and Cochise counties. Should rain and snow deficits this year follow a similar pattern, we might see less impact from the current La Niña event in the Verde Valley AVA than in the Sonoita and Willcox AVAs, at least at this early point of the dormancy season.
cvn-v202112-la-nina-county-prcp.png
Growing Season Temperature
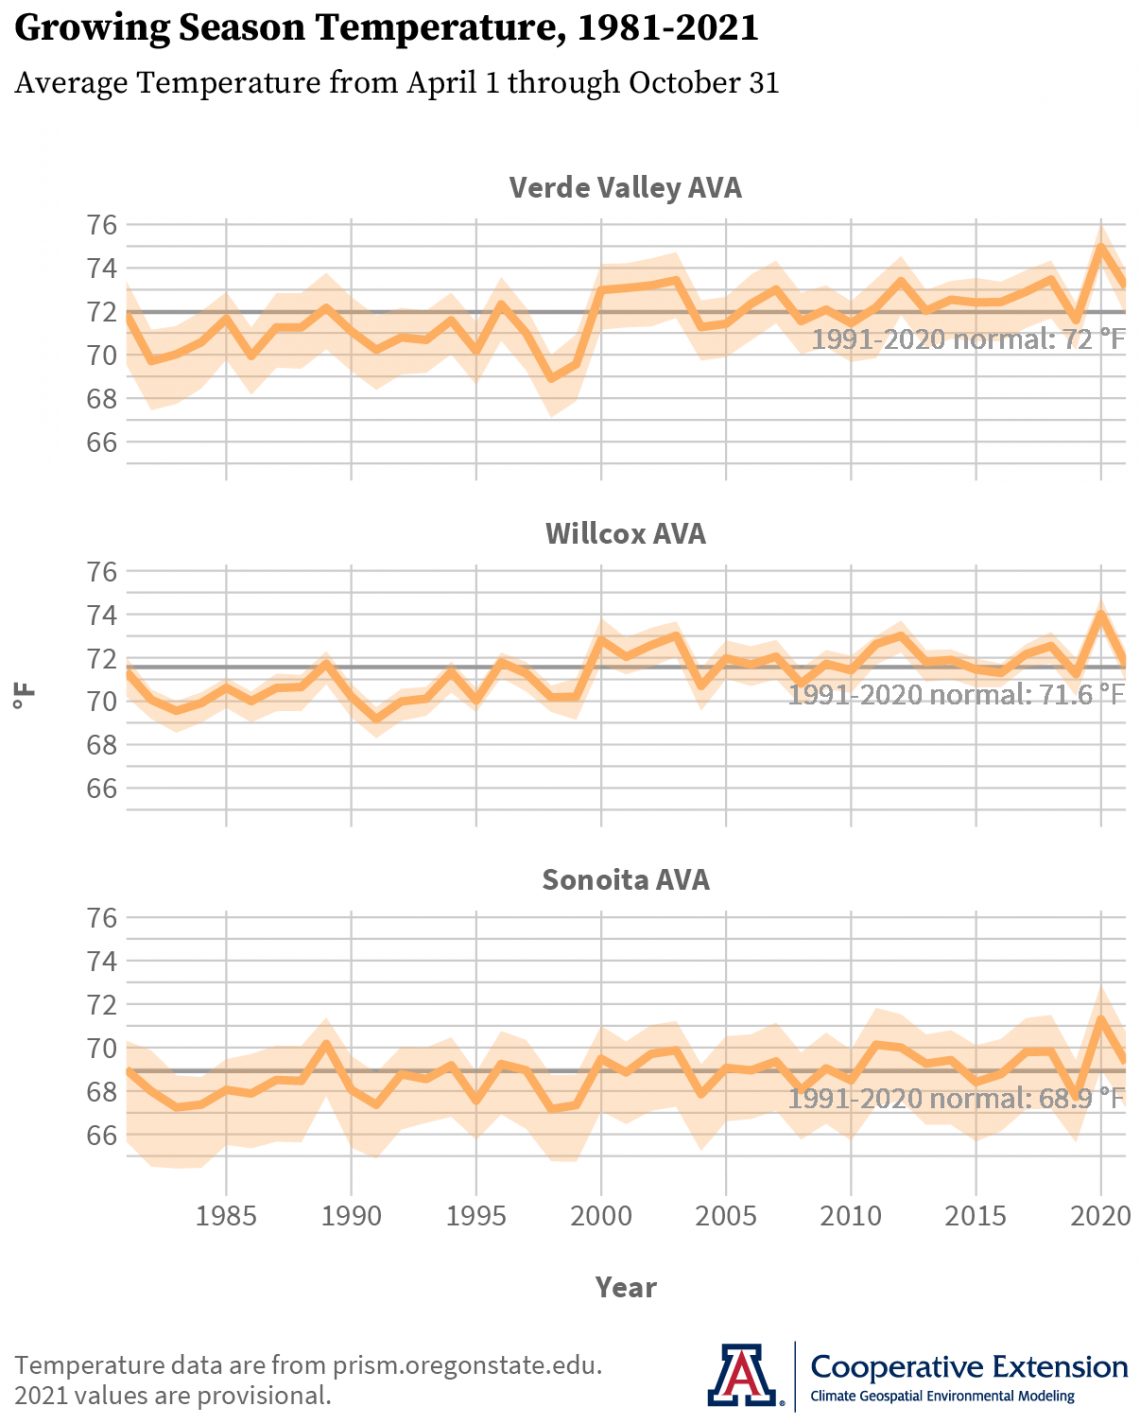
With it now the early part of the dormancy season, we can start characterizing conditions of the growing season this past year. Growing season temperature, the average temperature between April 1 and October 31, is one such way and a simple measure that often is used to compare different wine grape growing regions and as a first guess of which grape varieties might do well in a new area.
Looking once again at the Arizona AVAs as examples, growing season temperatures in 2021 were about 1 °F above the 1991-2020 normal for the Verde Valley AVA (top graph in figure1) and close to normal for the Willcox and Sonoita AVAs (middle and bottom graphs in figure, respectively1). All three were below the record-setting heat in 2020, due in large part to a relatively wet monsoon and despite near-record to record-high temperatures once again this past June.
Looking at growing season temperatures from a longer-term perspective, the 1991-2020 normal is 0.6 °F warmer than the 1981-2010 normal for the Verde Valley and Willcox AVAs, and 0.4 °F warmer for the Sonoita AVA. This reflects the regional warming trend over the past several decades, and is consistent with models used to project plausible future climatic conditions.
As we’ve noted before, however, the devil is in the details. It matters when below-, near-, or above-normal temperatures occur during a growing season, because temperature influences so many aspects of vine growth and fruit quality. We’ve touched upon several of these in previous newsletter issues over the past couple of years, and particularly in the context of budbreak and ripening conditions. Please let us know how much of a mark you think temperature will make on the 2021 vintage.
1 Orange lines represent the average growing season temperature across an individual AVA, and orange shading represents the range of growing season temperatures across an individual AVA, except for the coldest and hottest locations.
arizona-ava-gst-time-series-2021-12-01.png
Congratulations to the Verde Valley AVA for finally shaking off its proposed status and becoming the third American Viticultural Area in Arizona! We now and happily have some name edits to make on few maps.
We also now and happily have some summarizing of sticky-note posters to do from the Verde Valley and southeastern Arizona editions of the ‘Growing Season in Review’ workshops last month. Our plan is to have a report done in early 2022. Thanks to all who attended!
Although we do not yet know if sticky-note posters will be part of the program, we do know that we plan to have our next workshops in late spring or early summer in 2022. The events will be about the effects of Arizona climate on wine grape composition and part of our new specialty crop grant from the Arizona Department of Agriculture. Stay tuned!
Also new in recent months was Jeremy’s transition within Cooperative Extension to the new program manager for the Arizona Meteorological Network, or AZMet. His near-term focus will be on its modernization, after which the development of new, network-data-driven information products will be an activity that comes to the fore. As you know, the AZMet Willcox Bench station is in the Willcox AVA and we’ve been using data from it for different climate-viticulture topics like predicting budbreak and assessing ripening conditions. Please let us know if you have ideas on how AZMet can help support wine grape growing in the state.
For those of you in southeastern Arizona, Cooperative Extension manages an email listserv in coordination with the Tucson forecast office of the National Weather Service to provide information in the days leading up to agriculturally important events, like winter storms and cold-air outbreaks. Please contact us if you'd like to sign up.
And for those of you in north-central and northeastern Arizona, Cooperative Extension is starting to coordinate with the Flagstaff forecast office of the National Weather Service to soon provide a similar email listserv for those in agriculture in this part of the state. Please contact us if you'd like to sign up.
In case you missed the past few newsletters, there is a new study on the economic activity associated with state wine grape growing, winemaking, wine sales, and investments in vineyard and winery establishments. Produced by Ashley Bickel, Dari Duval, and George Frisvold from the Department of Agricultural and Resource Economics at the University of Arizona, the study also accounts for economic activity that is supported in other industries through linkages and presents information about the size, structure, and vertical integration of Arizona’s wine industry.
Undergraduate students in the College of Agriculture and Life Sciences at the University of Arizona are looking for internships with businesses and companies in the viticulture and winery industries during 2022. Please contact Danielle Buhrow, Senior Academic Advisor and Graduate Program Coordinator in the Department of Agricultural and Resource Economics, for more information.
Please feel free to give us feedback on this issue of the Climate Viticulture Newsletter, suggestions on what to include more or less often, and ideas for new topics.
Did someone forward you this newsletter? Please contact us to subscribe.
Our thanks to all of you for supporting our climate-viticulture project over the past few years. We look forward to its next iteration in 2022.
Have a wonderful December and holiday season!
With current and past support from:

