
Climate Viticulture Newsletter - 2021 July
< Back to Climate Viticulture Newsletter
Hello, everyone!
This is the July 2021 issue of the Climate Viticulture Newsletter – a quick look at some timely climate topics relevant to winegrape growing in Arizona and New Mexico.
A Recap of June Temperature and Precipitation
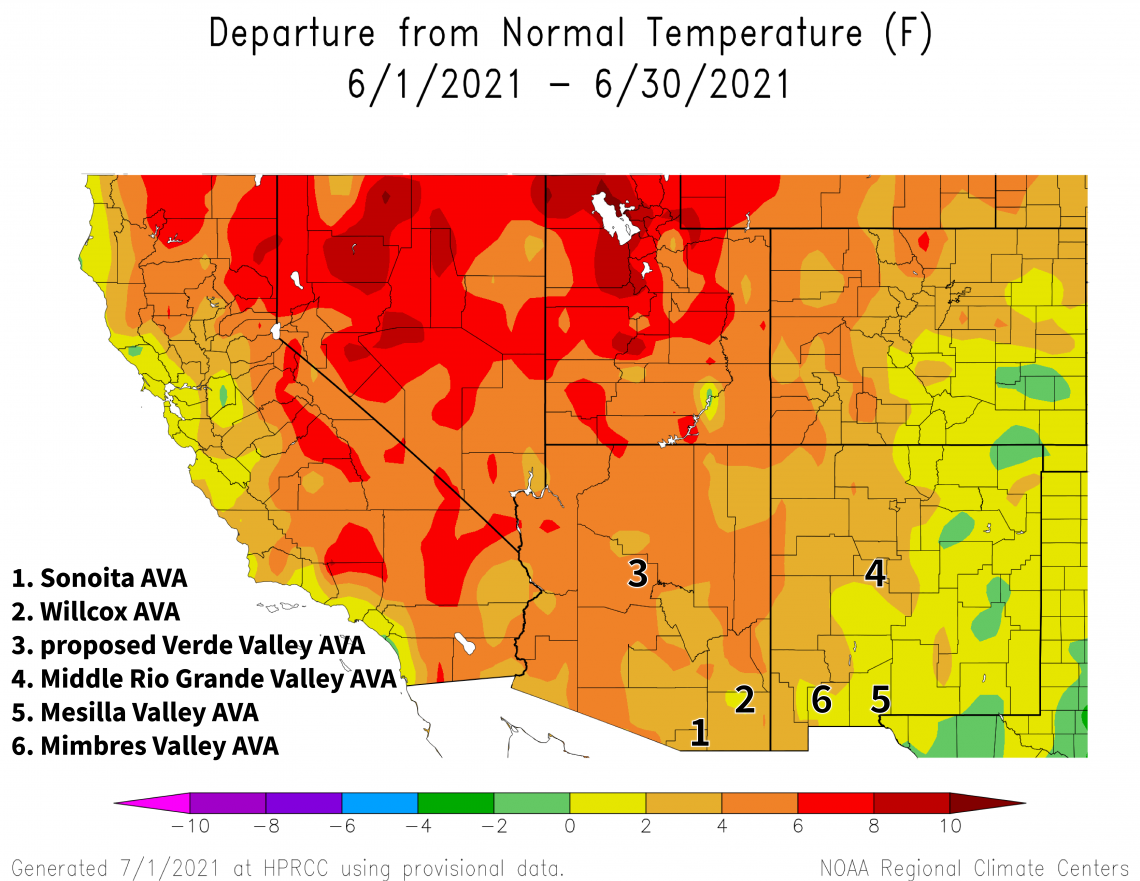
Temperatures last month were 2 to 6 °F above the 1991-2020 normal for much of Arizona and the western half of New Mexico (light and dark orange areas on map), driven in large part by the mid-month heat wave. The eastern half of New Mexico was within 2 °F of normal (yellow and light green areas on map). For comparison, monthly temperatures in June last year were near or up to 2 °F warmer than the 1981-2010 normal for most of Arizona and 2 to 4 °F warmer for much of New Mexico.
For many warm-climate growing areas in both states, the near record- and record-hot month translated to daytime temperatures that were well above 95 °F (35 °C) and likely slowing or stopping vine photosynthesis and growth. We take a look at what this might mean for veraison – the start of the ripening period – below.
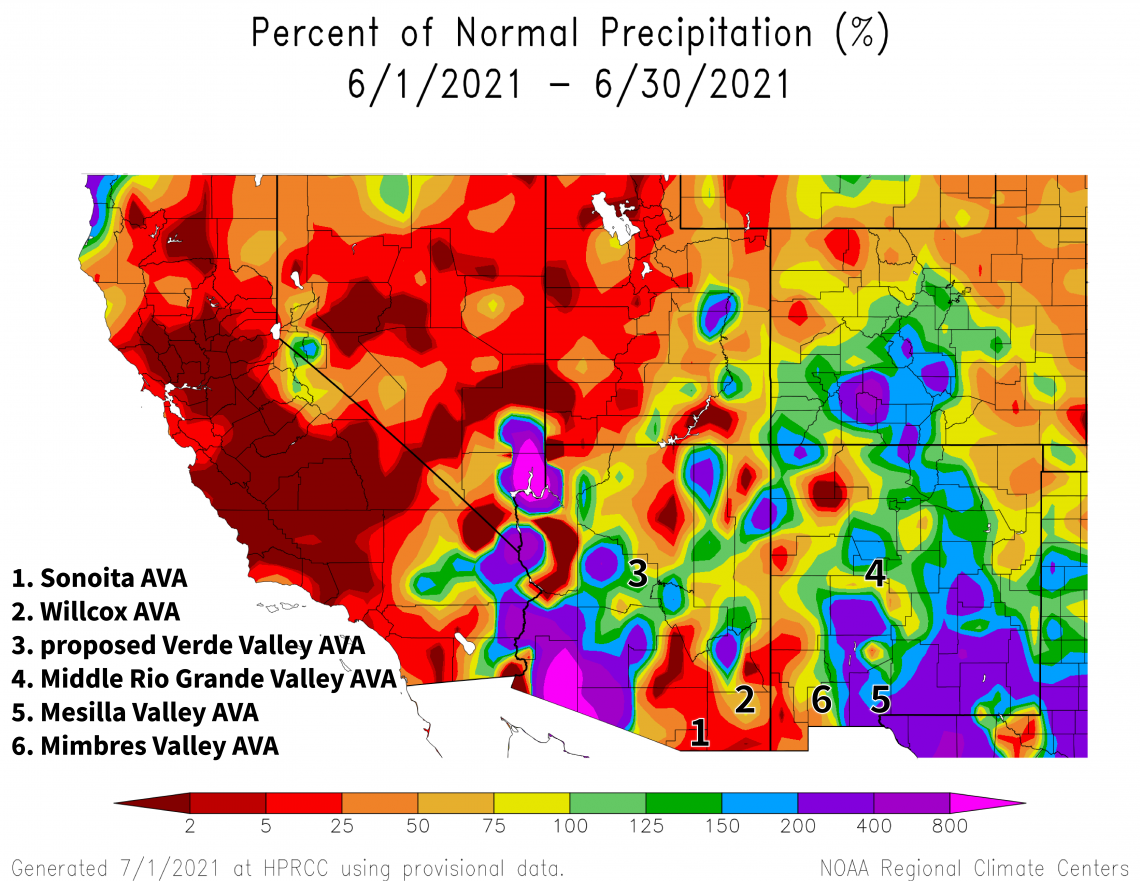
Monthly totals ranged from less than 50% (dark orange and red areas on map) to more than 200% (purple areas on map) of the 1991-2020 normal across the region in a complicated spatial pattern, reflecting the hit-or-miss nature of rainfall at this time year. But for many locations, June is a relatively dry month. Apart from the eastern half of New Mexico, where amounts were greater than one inch, totals were less than one-half inch, regardless of percentage value. Looking back at June 2020, monthly precipitation totals were less than 50% of the 1981-2010 normal for almost the entire region.
Although this is the time of year when the monsoon typically sets up shop, conditions for the region haven’t been so typical, including a highly unusual early-season influence of tropical cyclones from the eastern Pacific Ocean. After the parade of record-low precipitation amounts over the past 12 months and the ongoing regional drought conditions, however, we’ll take whatever rainfall we can get.
View more NOAA ACIS climate maps
View more-detailed regional maps and station summaries of monsoon rainfall
The Outlook for July Temperature and Precipitation
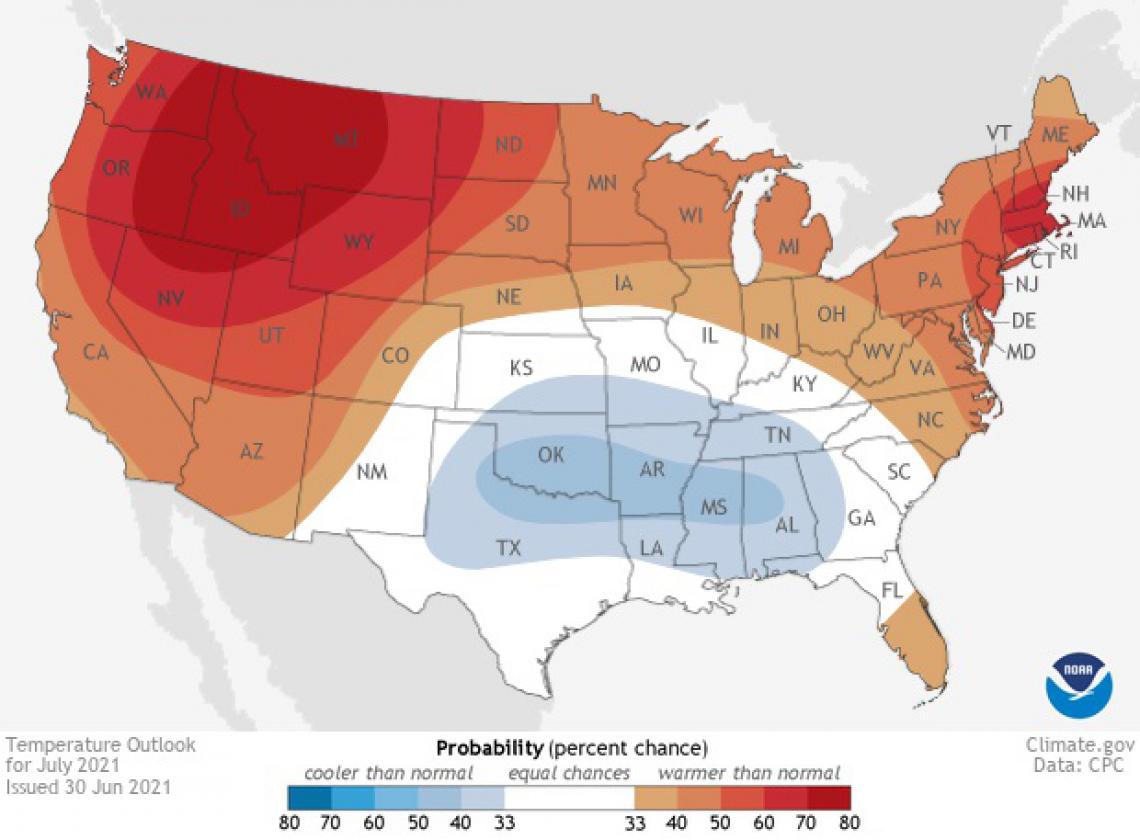
Moderate chances for temperatures above the 1991-2020 normal cover extreme northern Arizona (dark orange area on map), while slight chances for above-normal temperatures extend across the rest of the state and into the western third of New Mexico (orange and light orange areas on map). For the rest of the Land of Enchantment, there are equal chances for below-, near-, or above-normal temperatures (white area on map). As a comparison, monthly temperatures in July last year were near or up to 2 °F warmer than the 1981-2010 normal for much of northern Arizona and northwestern New Mexico, and and 2 to 6 °F warmer for most of the rest of the region.
2021-jul-temp-outlook-noaa-cpc.jpg
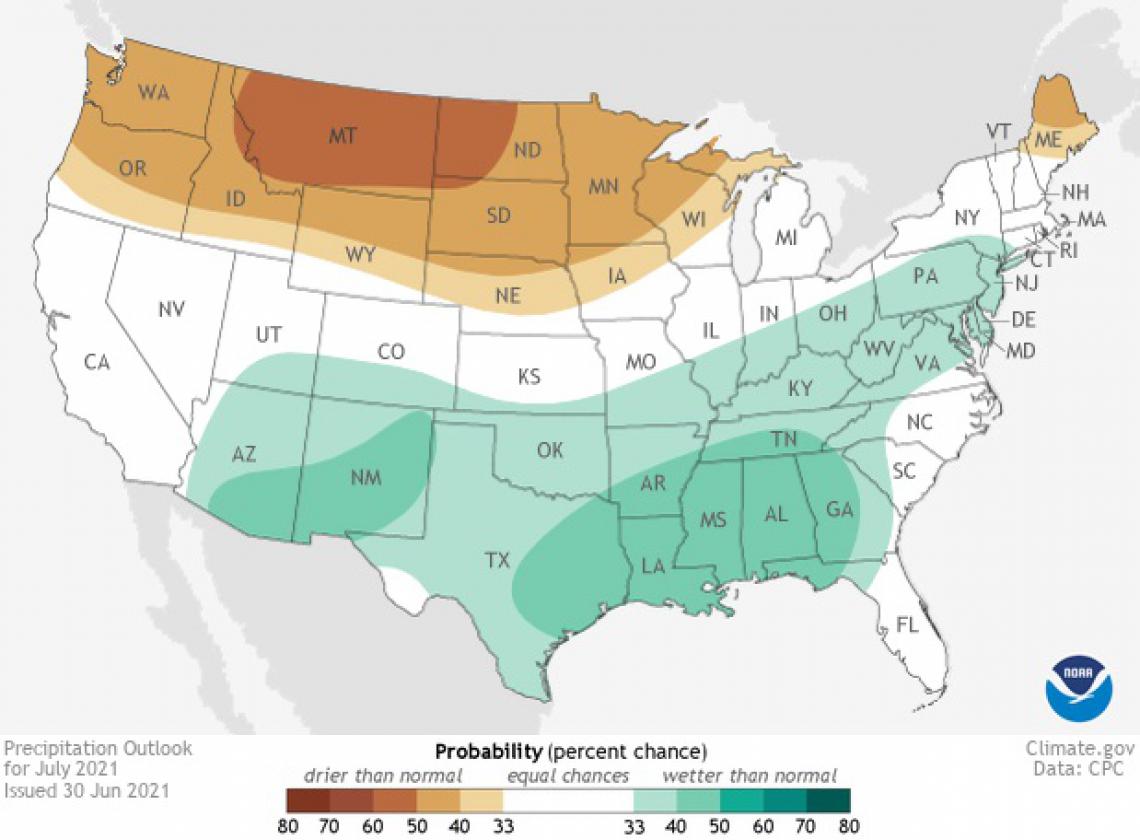
There is a slight increase in chances for precipitation above the 1991-2020 normal for the entire region (light aqua and aqua areas on map) except for extreme western Arizona, where equal chances for below-, near-, or above-normal precipitation exist (white area on map). Looking back at July 2020, monthly precipitation totals were less than 70% of the 1981-2010 normal for most of Arizona and several areas in New Mexico due to a late start to and a weak first half of the monsoon.
With veraison approaching for many vineyards, the interplay between temperature and precipitation over the coming weeks may have a say on fruit quality, particularly if warmer-than-normal temperatures appear through afternoon maximums or early morning minimums. Over the past five years, exposure of fruit to such conditions during July has taken a few different forms. We’ll be tracking hours per day in these key temperature ranges again this growing season with updates in upcoming issues.
Read more about the July 2021 temperature and precipitation outlook
2021-jul-prcp-outlook-noaa-cpc.jpg
Heat Accumulation and High Temperatures
With the heat wave last month, there were several days for several growing areas during which afternoon temperatures were well above 95 °F (35 °C) and likely slowing or stopping vine photosynthesis and growth. Such situations are something we want to account for when it comes to calculating heat accumulation and predicting phenological stages during the growing season.
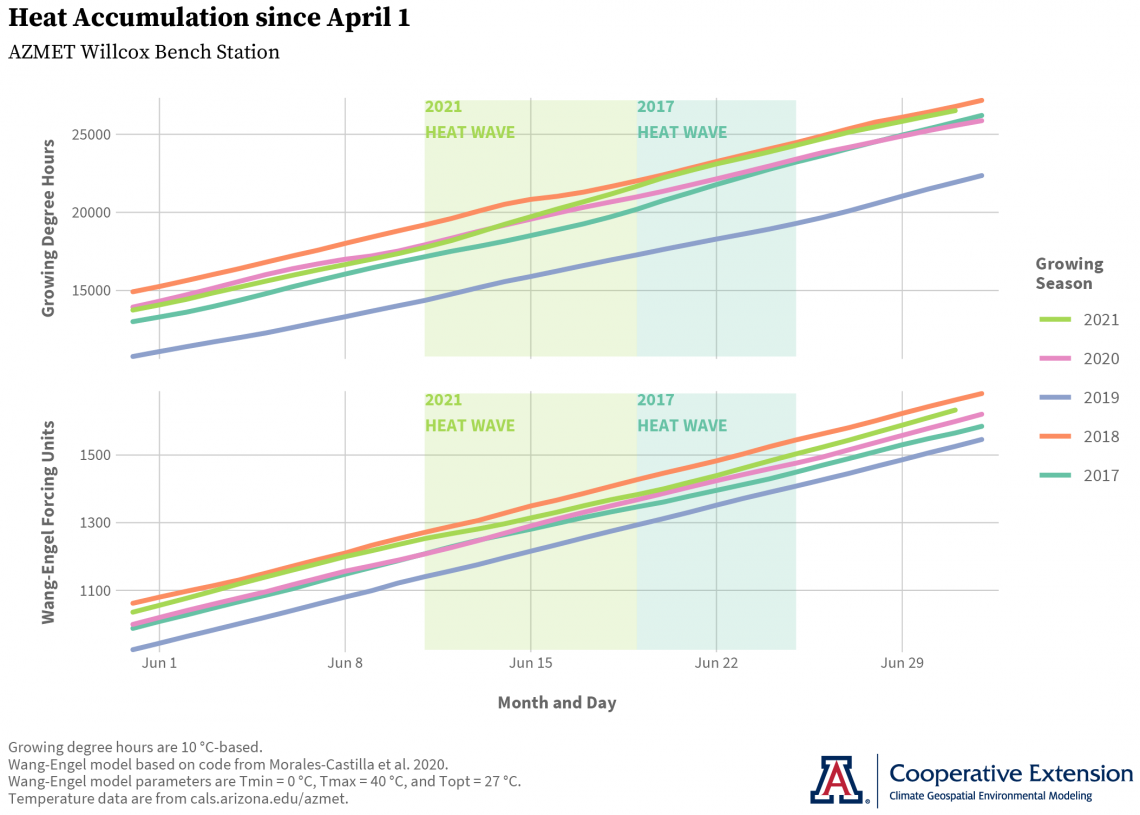
This month, we continue our search for heat-accumulation models that consider high temperatures in this way by comparing growing degree hours and Wang-Engel forcing units. Growing degree hours, similar to growing degree days but calculated with hourly temperature data instead of daily, are considered to be more accurate and precise than their daily counterpart when it comes to this relatively simple and widely used linear approach for modeling heat accumulation. Growing degree hours do not account for the above-mentioned high-temperature effects.
The Wang-Engel model, originally developed for wheat but more recently adapted to winegrapes, however, does account for these effects through a non-linear, process-based approach with three specified thresholds of minimum, optimum, and maximum temperature. Below the minimum temperature, no heat accumulation occurs. Between the minimum and optimum temperatures, the response to heat accumulation increases almost exponentially before leveling off. Between the optimum and maximum temperatures, the response to heat accumulation decreases rapidly. Above the maximum temperature, no heat accumulation occurs.
Looking at heat accumulation during June, the differences between these two models becomes apparent during the mid-month heat wave (green-shaded region on graphs). During this stretch of record-high afternoon temperatures in the region, accumulation of growing degree hours occurred at a faster rate at the AZMET Willcox Bench station (green line on top graph), even though afternoon temperatures were well above 95 °F (35 °C). In contrast, the rate of accumulation of Wang-Engel forcing units decreased during this period (green line on bottom graph), reflecting the likely slowing or stopping of vine photosynthesis and growth. Similar patterns are evident for the heat wave during June 2017 (aqua-shaded region and aqua line on graphs).
Heat Accumulation and Veraison
As noted above, growing degree hours have a potential limitation when it comes to prediction of growth stage timing in the coming weeks, namely the absence of accounting for the slowing and eventual stopping of vine photosynthesis and growth as temperatures rise above 95 °F (35 °C). This is an important consideration, as a resulting delay in phenology can lead to later veraison dates, and thus potentially different conditions under which grapes ripen and later harvest dates.
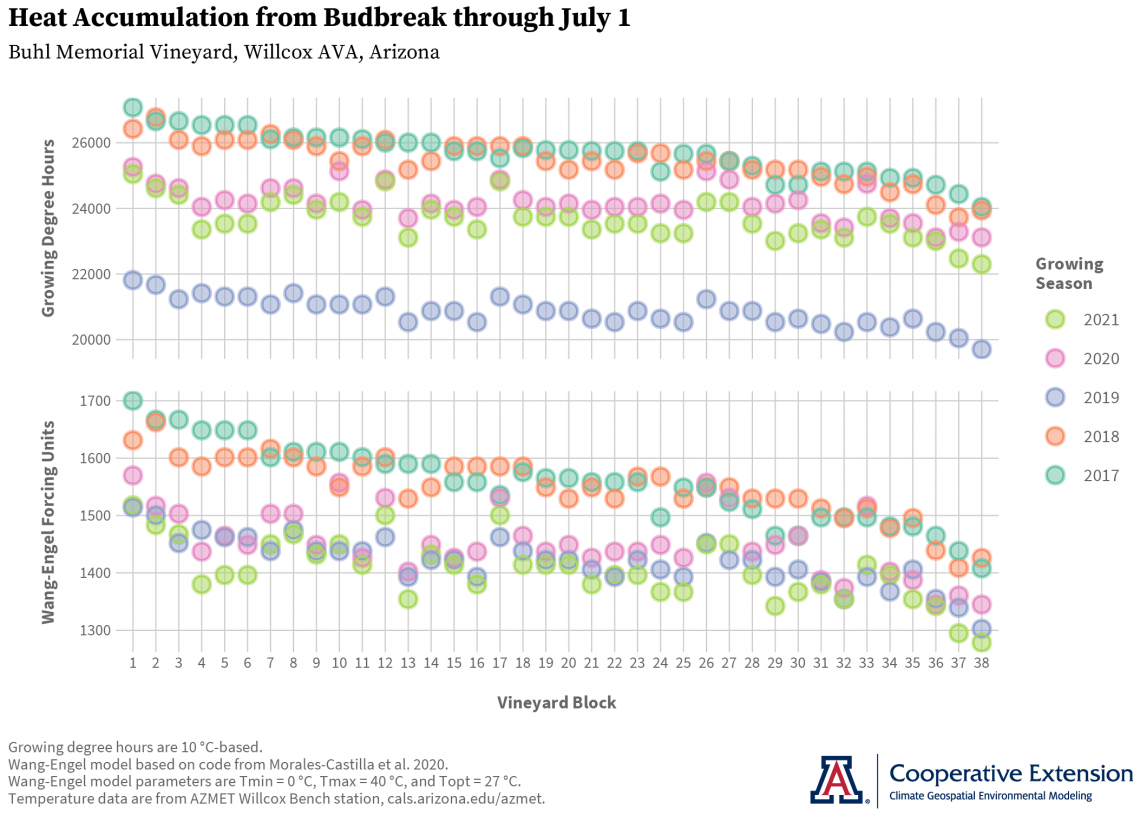
Climate and viticulture studies use heat accumulation during the growing season to predict when veraison – the start of the ripening period – occurs. Using the two models from the previous section, hourly temperature data from the AZMET Willcox Bench station, and budbreak dates from different blocks provided by Jesse Noble at Merkin Vineyards, let’s once again draw on the analog approach from weather forecasting to get a better idea of when the ripening period might start this year.
Heat accumulation since budbreak and based on growing degree hours places this growing season and the previous four into three fairly distinct groups (upper graph). High values at this point in the year from 2017 and 2018 suggest early veraison dates (aqua and orange dots, respectively). Relatively lower values in 2020 and 2021 suggest relatively later dates (pink and green dots, respectively), whereas the lowest values in 2019 imply the latest dates (blue dots). Recall, however, that growing degree hours do not account for the above-mentioned high-temperature effects.
Heat accumulation based on the Wang-Engel model, which does account for these effects, paints a somewhat different picture (lower graph). Values from 2017 and 2018 still group together with the highest values and suggest the earliest veraison dates in recent growing seasons. Heat accumulation values and implied veraison dates from 2020 and 2021, however, are more comparable to those of 2019. In fact, heat accumulation for several blocks at this point in the 2021 growing season are some of the lowest values of the five-year span. This isn’t due to cool May temperatures, like in 2019, but slightly later budbreak dates and near record- and record-hot June temperatures. For early July, an analog approach suggests that veraison dates in 2021 could be similar to or slightly later than those in 2020 and 2019, at least at this location.
We’ll continue with this analysis in the coming weeks and look to compare it to veraison dates from the vineyard. For future growing seasons, calibrating the Wang-Engel model parameters of minimum, optimum, and maximum temperature as well as marking heat accumulation from flowering instead of budbreak are improvements we plan to make.
Once past veraison, high temperatures not only can affect a vineyard by slowing down the growth rate of vines, but also by impacting fruit quality. How much daily minimum temperatures cool off at night, for example, may influence how much malic acid is consumed by respiration. Lower amounts of malic acid can lead to musts with higher pH that affect final wine composition. To learn more about this issue, we’ll be attending a webinar from Washington Advancements in Viticulture and Enology later this month. If you’re also interested in attending, register here.
A see-saw battle between regional drought conditions and monsoon rainfall is the backdrop for wildland fire this month in the Southwest. There is a normal potential in July for significant wildland fires for all of Arizona and New Mexico.
Undergraduate students in the College of Agriculture and Life Sciences at the University of Arizona are looking for internships with businesses and companies in the viticulture and winery industries during 2021. Please contact Danielle Buhrow, Senior Academic Advisor and Graduate Program Coordinator in the Department of Agricultural and Resource Economics, for more information.
A recent donation of 40 acres near Willcox plus recent funding from the USDA-AZDA Specialty Crop Block Grant program are some of the first steps of a newly formed public-private collaboration towards a Viticulture Center of Research (VCOR) that will help support winegrape growing in Arizona. The funding will provide resources to convene the state viticulture industry and its supporters in the latter half of 2021 to determine common interests and develop plans for moving the VCOR project forward. Another first step is to gather letters of support that demonstrate backing of the VCOR project from the Arizona viticulture industry to relevant leaders in the University of Arizona. To learn more about the VCOR project and how to contribute a letter of support, please contact Joshua Sherman, commercial horticulture agent with University of Arizona Cooperative Extension.
For those of you in southeastern Arizona, Cooperative Extension manages an email listserv in coordination with the Tucson forecast office of the National Weather Service to provide information in the days leading up to agriculturally important events, like days with severe monsoon storms or excessive heat. Please contact us if you'd like to sign up.
Please feel free to give us feedback on this issue of the Climate Viticulture Newsletter, suggestions on what to include more or less often, and ideas for new topics.
Did someone forward you this newsletter? Please contact us to subscribe.
Have a wonderful July!
With support from:

