
Climate Viticulture Newsletter - 2021 October
< Back to Climate Viticulture Newsletter
Hello, everyone!
This is the October 2021 issue of the Climate Viticulture Newsletter – a quick look at some timely climate topics relevant to winegrape growing in Arizona and New Mexico.
A Recap of September Temperature and Precipitation
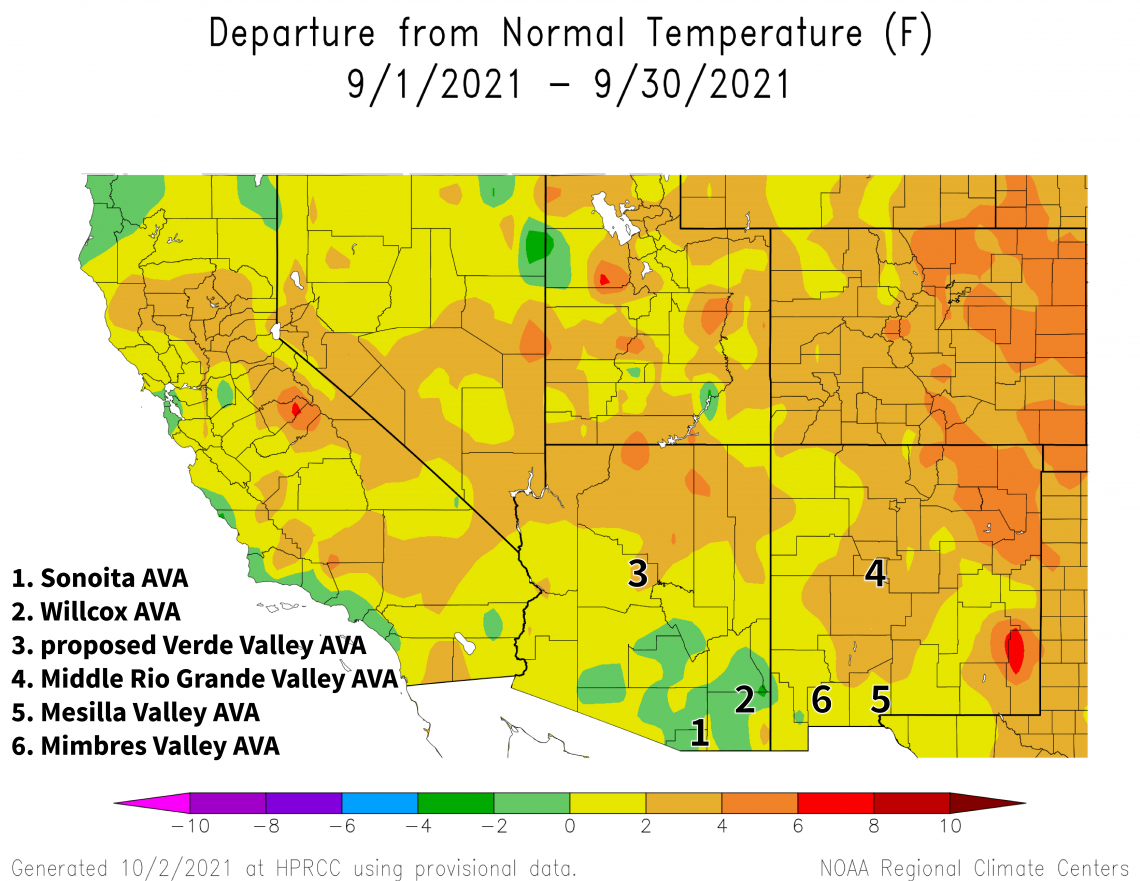
Southern Arizona and extreme southwestern New Mexico were the primary areas that measured monthly average temperatures within 2 °F of the 1991-2020 normal (light green and yellow areas on map). Apart from this part of the region, temperatures were 2 to 6 °F warmer than normal (orange and dark orange areas on map). For reference, monthly temperatures in September last year were 2 to 4 °F warmer than the 1981-2010 normal for the western two-thirds of Arizona and within 2 °F of normal for the rest of the region.
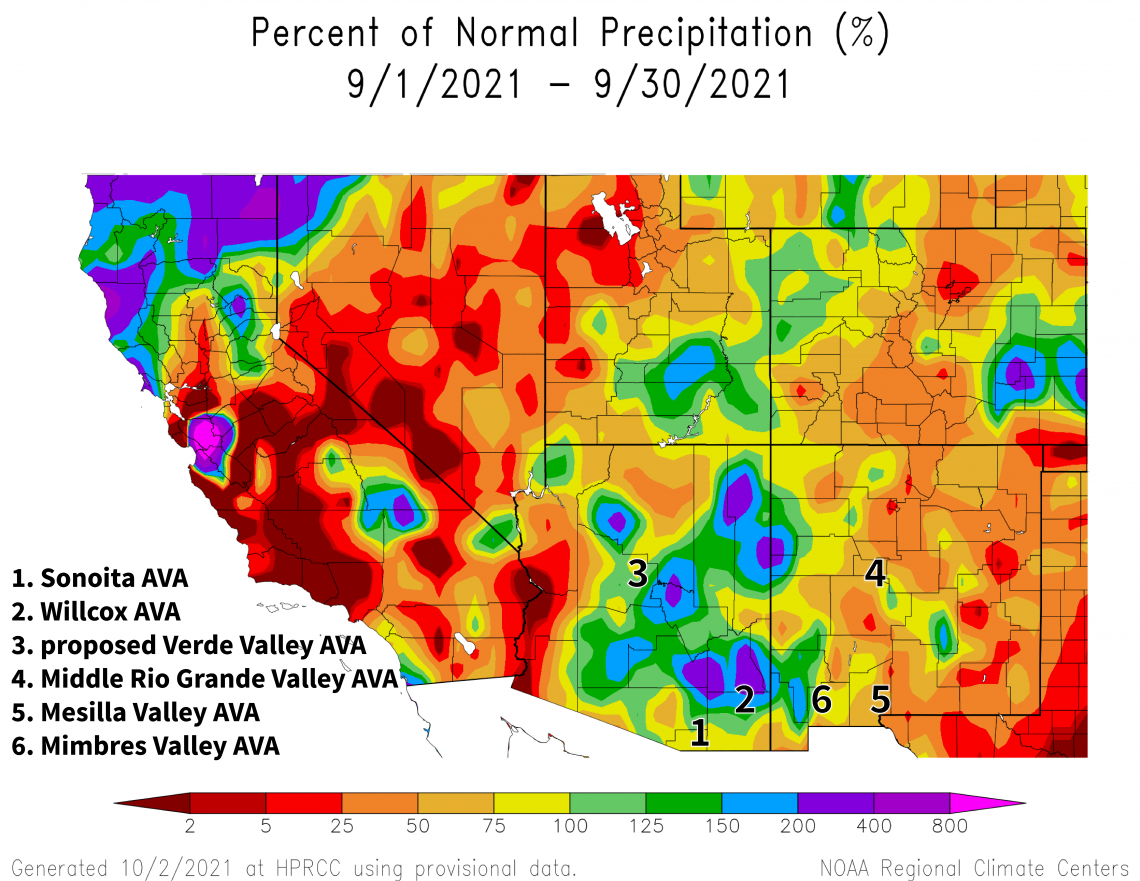
Generally speaking, precipitation totals for the past month were near (yellow and light green areas on map) to above (dark green, blue, and purple areas on map) the 1991-2020 normal for much of Arizona and extreme western New Mexico. Amounts were below 75 % of normal for the rest of the region (orange and red areas on map). Precipitation during September 2020 was below 50 % of the 1981-2010 normal for almost all of Arizona and much of New Mexico.
With the North American monsoon now in the rear-view mirror and harvest wrapped up for many, comparison of the ripening periods in 2021 and 2020 probably couldn’t offer more contrast. Record hot and dry conditions last year brought questions of water stress and heat damage to vines and fruit to mind. This year, relatively cooler and wetter conditions more likely led to concerns of increased pest and disease pressures along with additional pauses in vineyard access. Field notes from these two vintages will be valuable for future ones as a more variable and extreme summer climate is anticipated for the Southwest in the coming years.
View more NOAA ACIS climate maps
View more-detailed regional maps and station summaries of monsoon rainfall
The Outlook for October Temperature and Precipitation
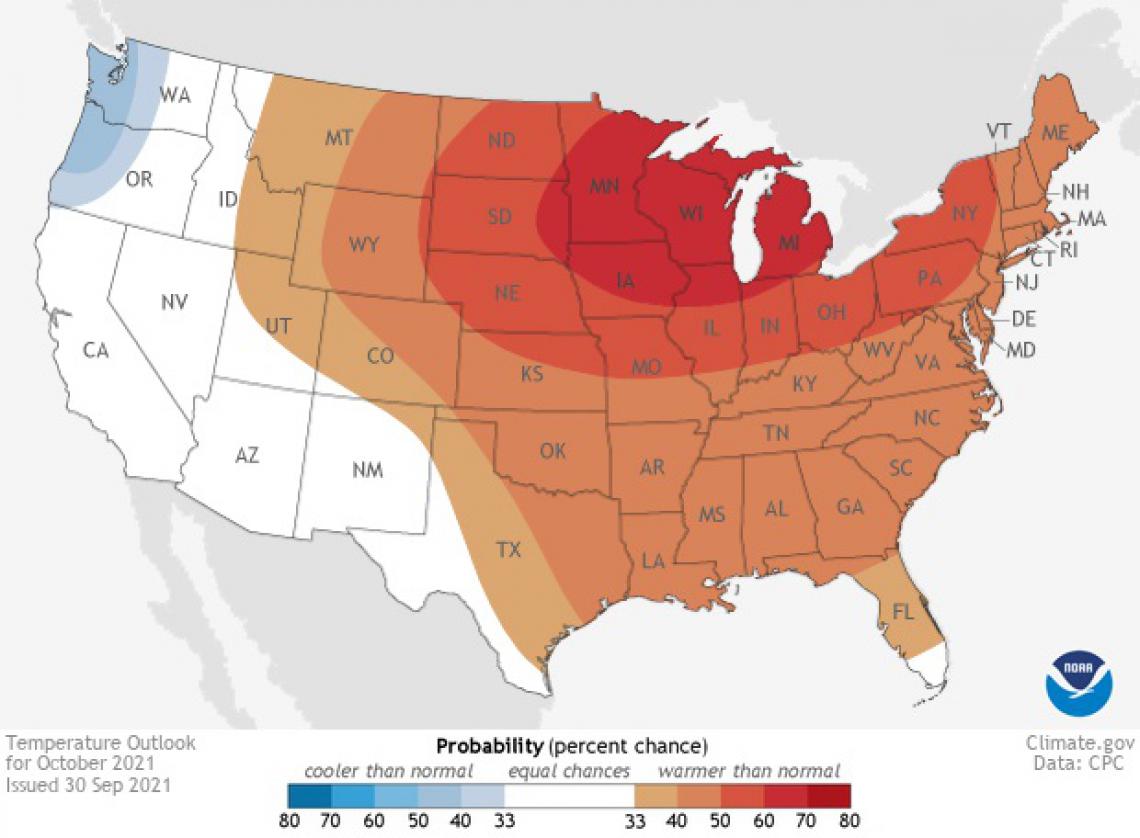
Temperatures for the coming month for almost all of the region have equal chances for being below, near, or above the 1991-2020 normal (white area on map). Only extreme northeastern New Mexico is showing that such conditions are leaning in any particular direction, with a slight increase in chances for above-normal temperatures (light orange area on map). As a comparison, monthly temperatures in October last year were 2 to 6 °F warmer than the 1981-2010 normal for much of Arizona and many areas in the western two-thirds of New Mexico.
2021-oct-temp-outlook-noaa-cpc.jpg
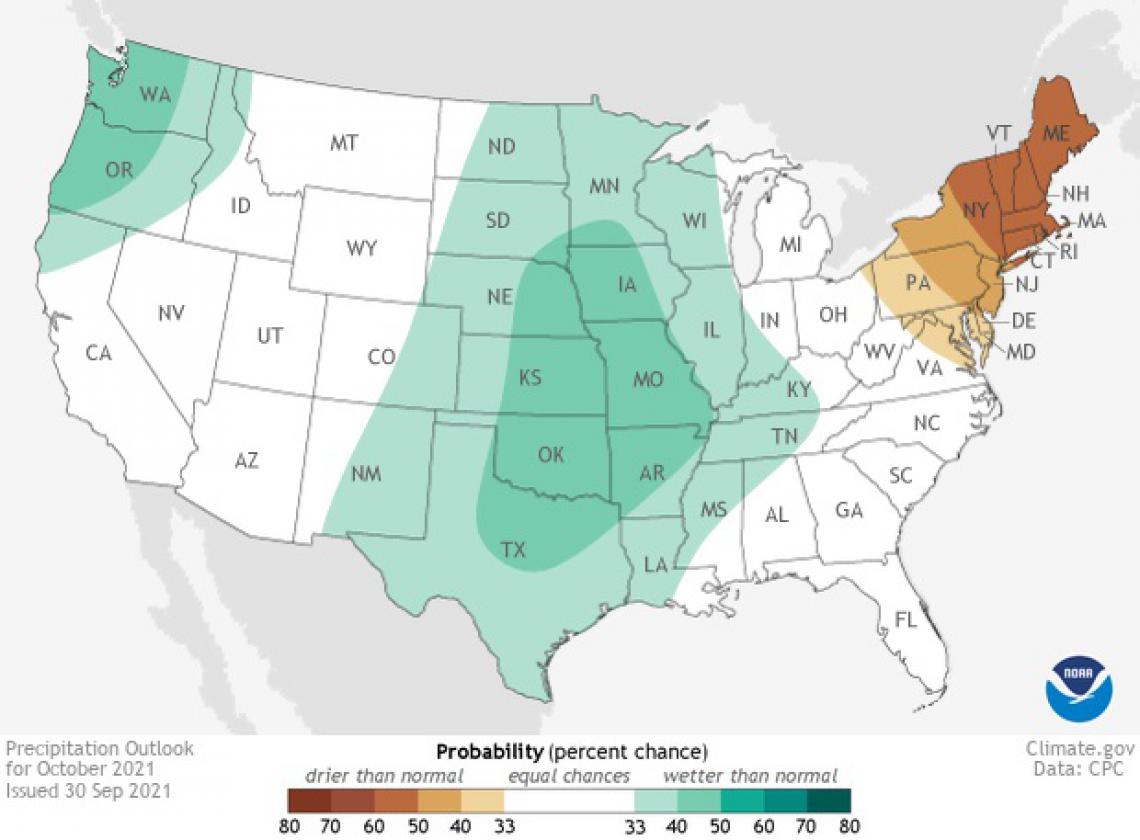
A lack of conditions leaning in any particular direction also is the case for precipitation across Arizona and the western third of New Mexico, with equal chances for below-, near-, or above-normal totals for this month (white area on map). There is a slight increase in chances for totals to be above the 1991-2020 normal for the eastern two-thirds of New Mexico (light aqua area on map). Precipitation during October 2020 was below 75 % of the 1981-2010 normal for almost all of the region.
For the previous two growing seasons, October brought about the first fall freeze. Depending on vine phenology and vineyard location, the timing could have been prior to plants reaching cold-hardiness levels – through, for example, tissue dehydration – needed to withstand such temperatures. Resulting damages to vascular tissue look to have been the likely reason why vines showed no or slow growth during the following springs. Some of the surprise from these events may stem from the fact that it had been about 10 years since such a relatively early first fall freeze had last occurred in some locations.
Read more about the October 2021 temperature and precipitation outlook
To stay informed of long-range temperature and precipitation possibilities beyond the coverage of a standard weather forecast, check in, too, with the six-to-ten-day outlook and eight-to-fourteen-day outlook issued daily by NOAA’s Climate Prediction Center.
2021-oct-prcp-outlook-noaa-cpc.jpg
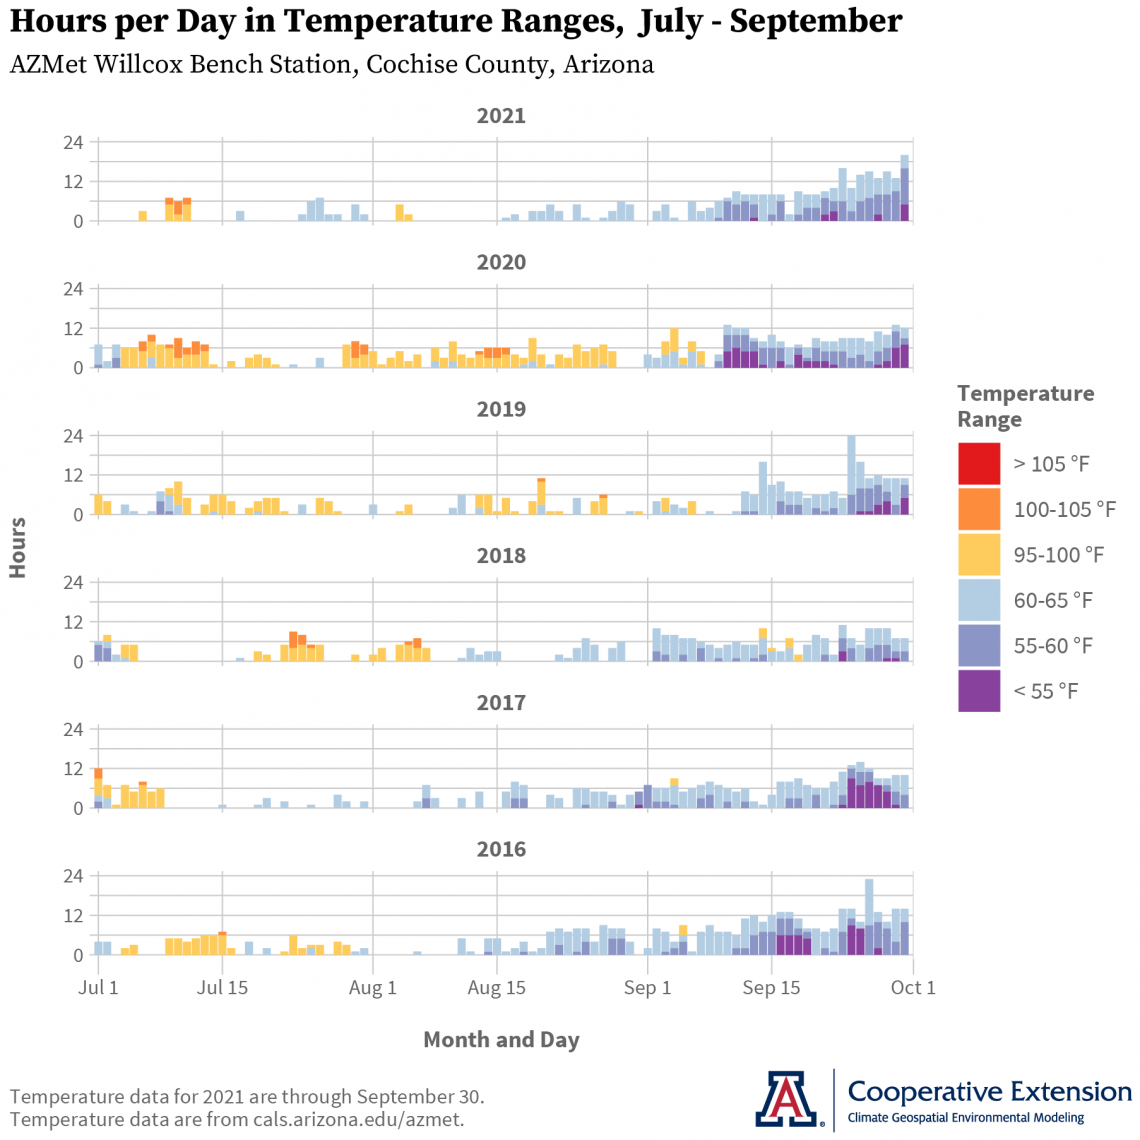
Temperature Ranges and the Ripening Period
October also brings about our last look at the amount of time spent below 65 °F and above 95 °F during the ripening period. September didn’t yield any surprises in this context this year, at least at the AZMet Willcox Bench station in the south-central Willcox AVA, as an increase in hours below 65 °F appears during the month (blue and purple bars in top graph). Although temperatures above 95 °F have occurred occasionally in September over the previous five growing seasons (yellow bars in bottom five graphs), they were absent in 2021. For the overall ripening period, temperature conditions in 2021 look most similar to those in 2017 and suggest that fruit quality and composition variables like Brix, titratable acidity, and pH from these two vintages may be similar, as well.
It may be worth mentioning again that comparison of the ripening periods in 2021 and 2020 probably couldn’t offer more contrast (top two graphs). The switch from record hot and dry conditions last year to relatively cooler and wetter ones this year suggests more notable changes in fruit quality and composition with less heat-tolerant varieties than with more tolerant ones. Notes from these two vintages also will be valuable for future ones when it comes to evaluating variety viability for a more variable and extreme summer climate.
Planning has just started for the 2021 ‘Growing Season in Review’ workshops for Arizona Winegrape Growers, with November 9 as the date in the Verde Valley and a date near then in the southeastern part of the state. As in the 2019 edition, grower-to-grower discussions will be front and center. More details will be coming soon.
Possibilities continue for a ‘double-dip’ La Niña event to take shape, which would lead to La Niña conditions during our cool-season months for a second consecutive year. The most recent official forecast for ENSO, or El Niño Southern Oscillation – parts of the atmosphere and ocean across the tropical Pacific Ocean that cause El Niño and La Niña events – now has a greater than 70 % chance that a La Niña event develops this fall and continues into the winter. As we know, La Niña events generally mean below-average precipitation for the Southwest during the cooler months of the year. Such an outcome won’t help the continuing regional drought conditions.
In case you missed the newsletter last month, there is a new study on the economic activity associated with state winegrape growing, winemaking, wine sales, and investments in vineyard and winery establishments. Produced by Ashley Bickel, Dari Duval, and George Frisvold from the Department of Agricultural and Resource Economics at the University of Arizona, the study also accounts for economic activity that is supported in other industries through linkages and presents information about the size, structure, and vertical integration of Arizona’s wine industry.
Undergraduate students in the College of Agriculture and Life Sciences at the University of Arizona are looking for internships with businesses and companies in the viticulture and winery industries during 2021. Please contact Danielle Buhrow, Senior Academic Advisor and Graduate Program Coordinator in the Department of Agricultural and Resource Economics, for more information.
For those of you in southeastern Arizona, Cooperative Extension manages an email listserv in coordination with the Tucson forecast office of the National Weather Service to provide information in the days leading up to agriculturally important events, like the first fall freeze and rain from tropical cyclone remnants. Please contact us if you'd like to sign up.
Please feel free to give us feedback on this issue of the Climate Viticulture Newsletter, suggestions on what to include more or less often, and ideas for new topics.
Did someone forward you this newsletter? Please contact us to subscribe.
Have a wonderful October!
With support from:

