
Climate Viticulture Newsletter - 2022 January
< Back to Climate Viticulture Newsletter
Hello, everyone!
This is the January 2022 issue of the Climate Viticulture Newsletter – a quick look at some timely climate topics relevant to wine grape growing in Arizona.
December Recap | January Outlook | AVA Seasonal Analogs | Extra Notes
A Recap of December Temperature and Precipitation
Despite a stormy close to the calendar year, monthly average temperatures were 2 to 4 °F above the 1991-2020 normal for much of the western two-thirds of the state (light orange area on map). Following the progressively warmer-than-normal pattern from west to east across the region, temperatures over the eastern third of Arizona mostly ranged from 2 to 6 °F above normal (light and dark orange areas on map). This is warmer than December 2020, when monthly temperatures were within 2 °F of the 1981-2010 normal for many areas in the state.
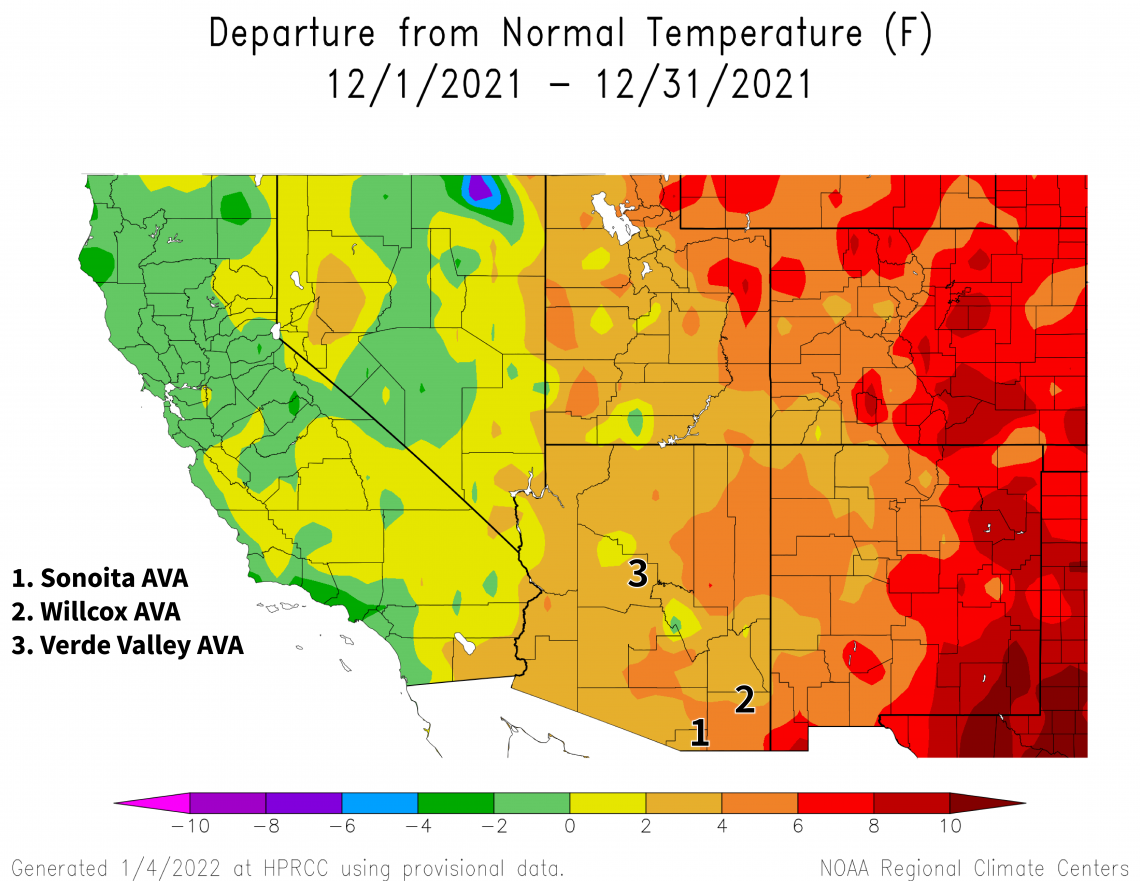
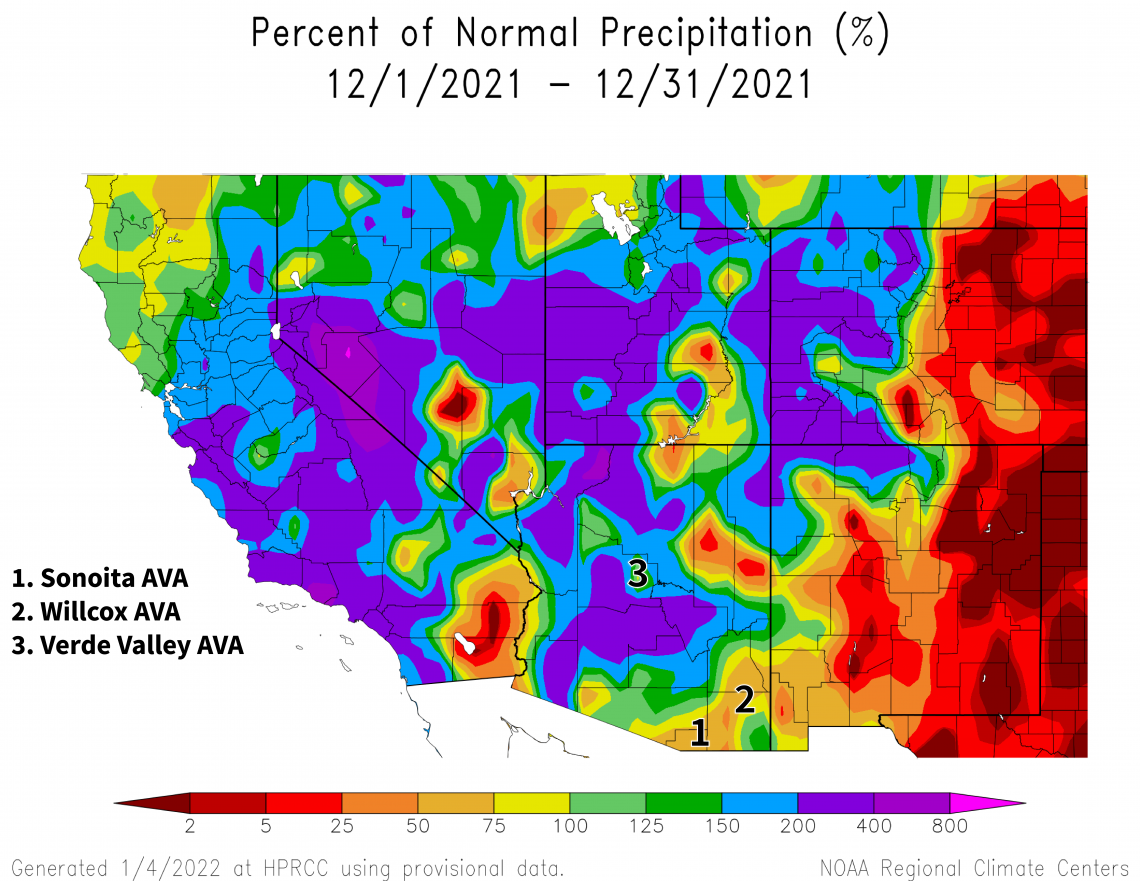
In general, where it was relatively cooler, it also was relatively wetter. Monthly precipitation totals ranged from near to 400 % of the 1991-2020 normal for much of the western two-thirds of the state (yellow, green, blue, and dark purple areas on map). This equates to about 1 to 3 inches for most locations at lower elevations and 3 to 5 inches for most locations at upper elevations. Where it was relatively warmer, it also was relatively drier. Several areas in northeastern and southeastern Arizona only received between 25 and 75 % of normal (dark and light orange areas on map), or from about 0.5 to 2 inches, with totals once again largely dependent on elevation. As a comparison, precipitation during December 2020 was less than 50 % of the 1981-2010 normal for almost all of the state.
Although it might be nice to give in to recency bias and think that winter won’t end up on the dry side, we still are locked in to a La Niña event, which lowers our chances for dormant-season rain and snow. More on this below. And, in case you missed it last month, we recently caught a an article connecting dry winter soil and delayed spring growth, topics that could come to the fore if relatively warm and dry conditions continue for the coming months.
View more NOAA ACIS climate maps
The Outlook for January Temperature and Precipitation
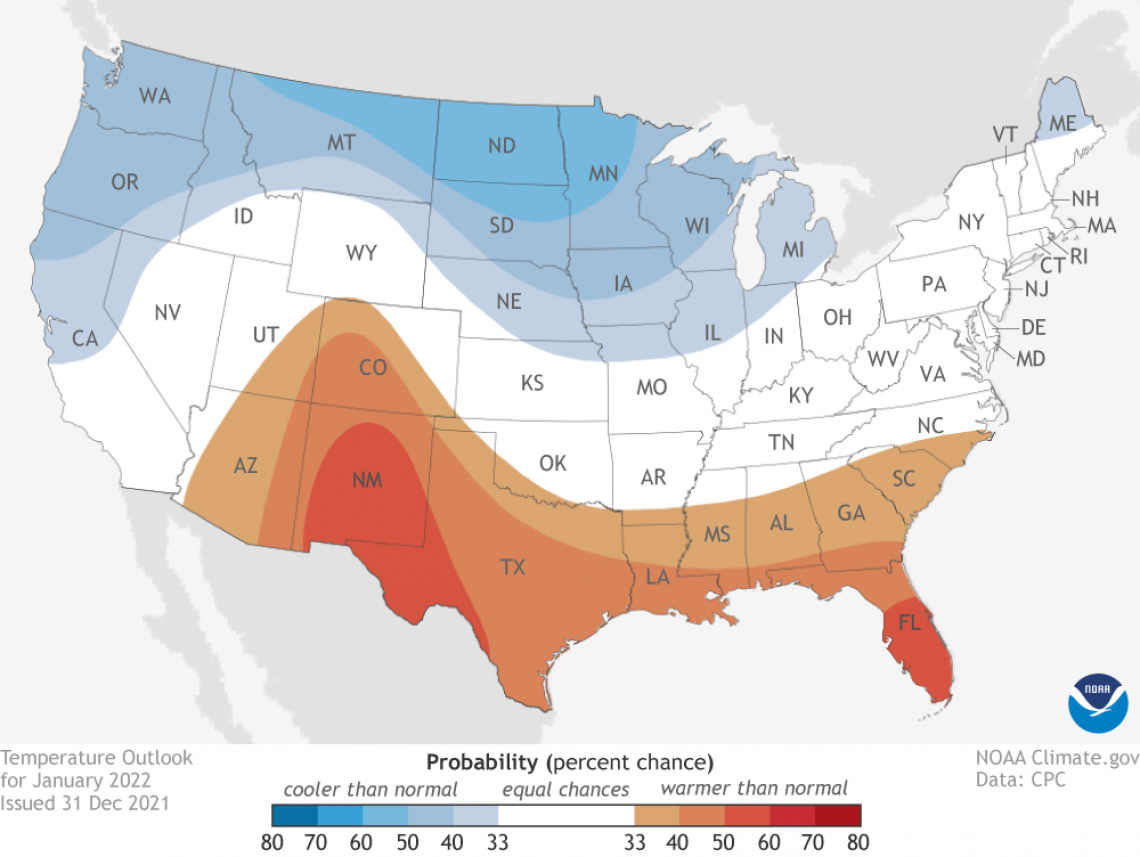
Temperatures over the course of this month have slight chances for being above the 1991-2020 normal across much of Arizona (light and dark orange areas on map). The only exception to this is the extreme western part of the state, where there are equal chances for below-, near-, or above-normal conditions (white area on map). For reference, monthly temperatures in January last year were within 2 °F of the 1981-2010 normal for almost all of the region.
2022-jan-temp-outlook-noaa-cpc.png
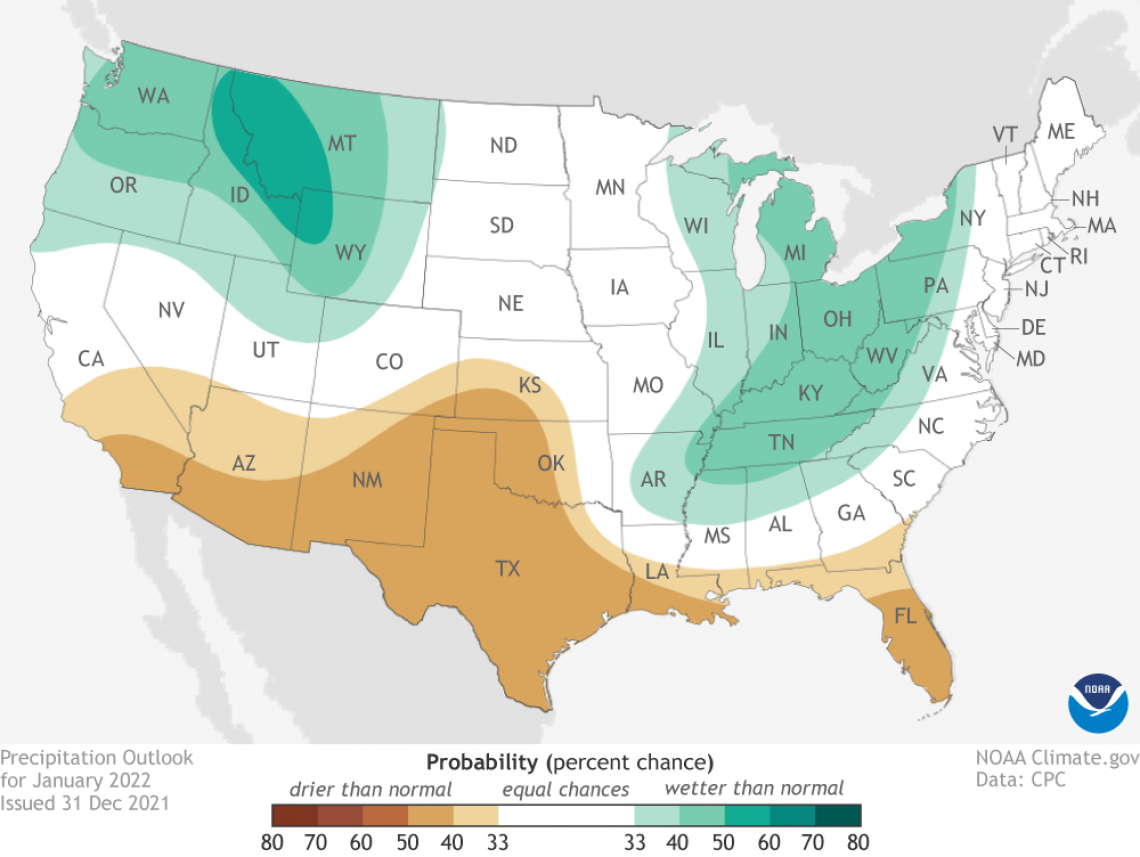
Precipitation totals for this month have slight chances for being below the 1991-2020 normal across almost all of the state (light and dark tan areas on map). Only extreme northern Arizona differs from this expectation, with equal chances for below-, near-, or above-normal amounts (white area on map). Precipitation during January 2021 was near or up to 200 % of the 1981-2010 normal for some areas in the southern and central parts of the state, including the Sonoita, Verde Valley, and Willcox AVAs. Otherwise in Arizona, totals generally were below normal.
At this point in the newsletter last month, given recent and anticipated warm and dry conditions at that point in the dormant season, we noted that temperature and precipitation during recent and coming months may be similar to that in 2017. With leanings again towards such conditions this month, and with an updated and more detailed look at them below, we’ll again note this month that field notes from that year, and a few others, may be worth another look.
Read more about the January 2022 temperature and precipitation outlook
To stay informed of long-range temperature and precipitation possibilities beyond the coverage of a standard weather forecast, check in, too, with the six-to-ten-day outlook and eight-to-fourteen-day outlook issued daily by NOAA’s Climate Prediction Center.
2022-jan-prcp-outlook-noaa-cpc.png
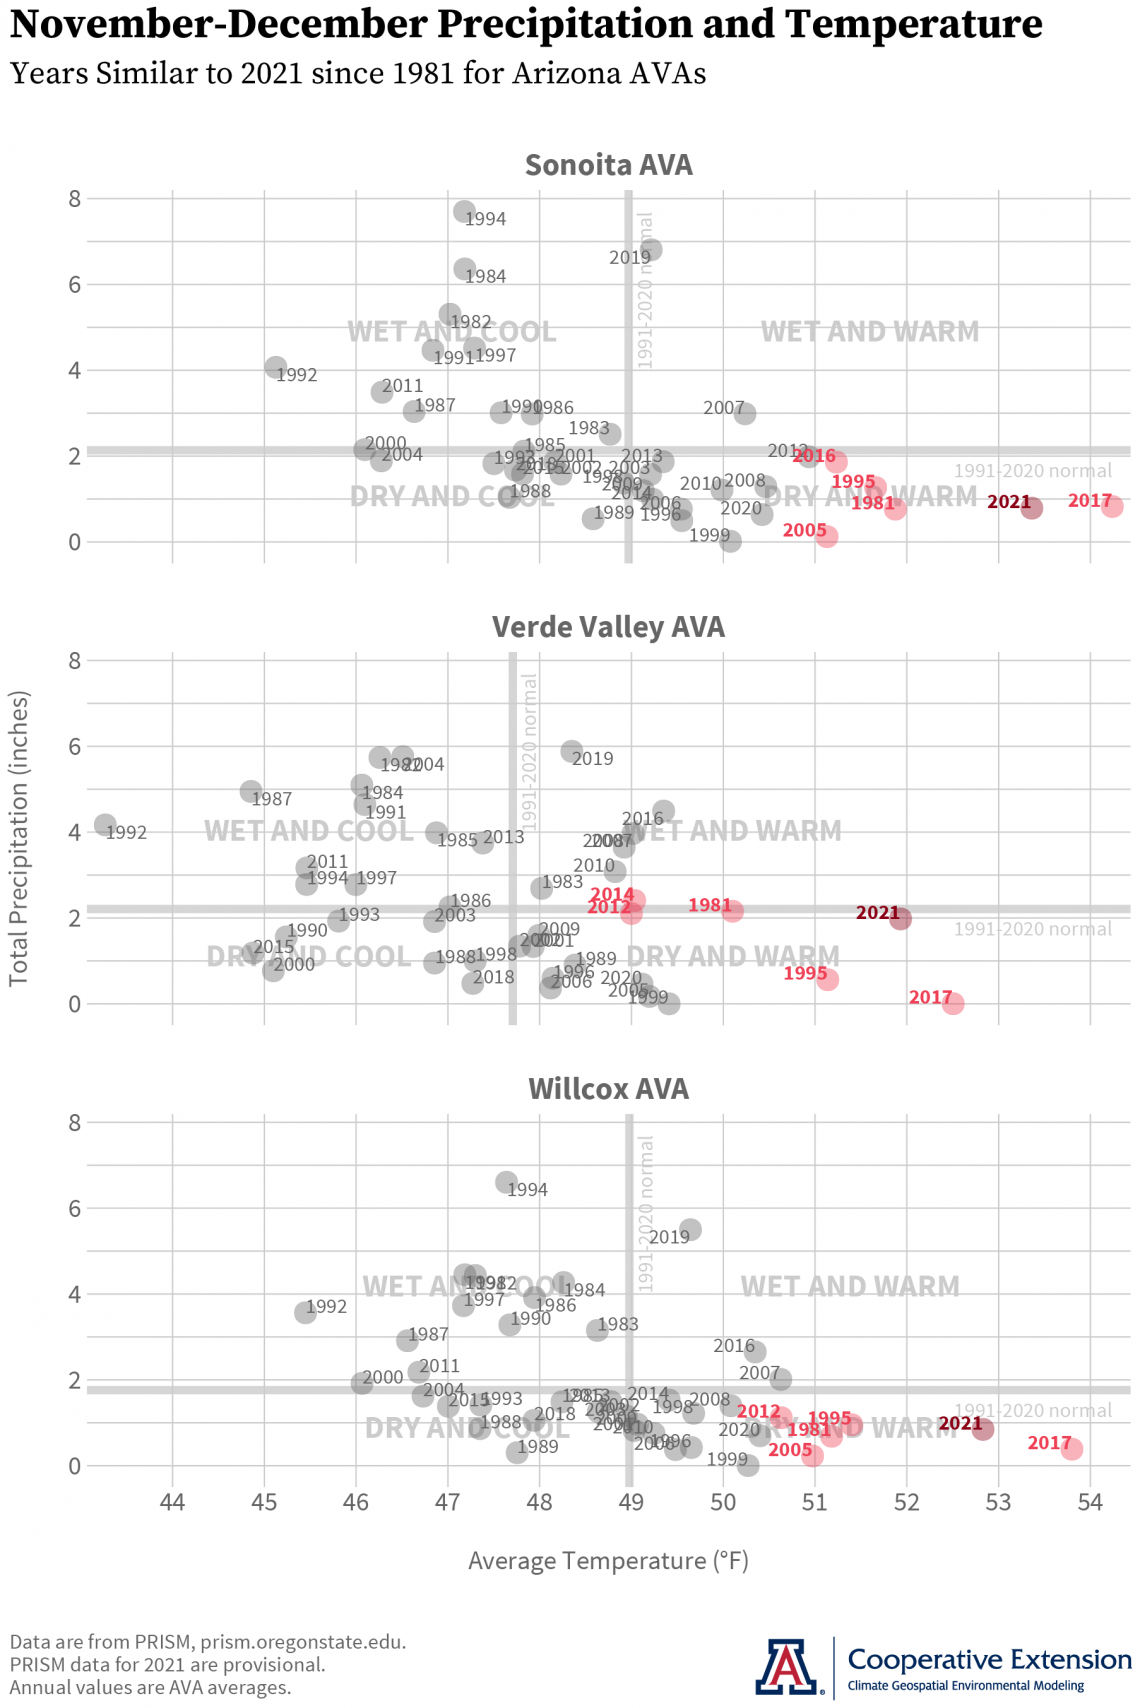
Seasonal Analogs for Arizona AVAs
Like our more general statewide comparison, a more detailed look at dormant-season temperature and precipitation for the three Arizona AVAs also suggests that conditions in 2021 (dark red dots on graphs) are, so far, similar to those in 2017 (light red dots on graph). Additional past years when average temperature and total precipitation show the most similarity to that of the past two months for all state AVAs are 1995 and 1981. Somewhat less similar to 2021 are 2016 and 2005 for the Sonoita AVA (top graph), 2014 and 2012 for the Verde Valley AVA (middle graph), and 2012 and 2005 for the Willcox AVA (bottom graph).
Tying November-December conditions from these ‘analog’ years and 2021 together are temperatures above the 1991-2020 normal (thick gray vertical line in all graphs), in fact some of the warmest since 1981, and precipitation totals near or below normal (thick gray horizontal line in all graphs).
With this kind of analysis, we once again are taking the ‘analogs’ page from the weather forecasting playbook. Such an approach there looks at impacts recorded during past weather events that are like the one being forecasted to give forecasters a better idea of potential upcoming impacts. Here, we’re trying to identify dormant-season conditions in past years that are like those in the current year to help growers zero in on which past experiences might be most helpful in handling potential upcoming impacts in the vineyard.
cvn-202201-ava-analogs-2022-01-04.png
If any of you had learning new modes of global climate variability on your new year resolution list, be sure to note the Pacific-North American pattern and Madden-Julian Oscillation, and check that box for an early win. Both of these may be nudging where the winter storm track goes over the coming weeks, along with the current La Niña event. Regarding the latter, the most recent official forecast for ENSO, or El Niño Southern Oscillation – parts of the atmosphere and ocean across the tropical Pacific Ocean that cause El Niño and La Niña events – now shows a 95 % chance that this event will persist through February. Changes look to be coming once the growing season starts, however, as there is a 60 % chance of ENSO conditions transitioning to neutral from April through June.
For those of you in southeastern Arizona, Cooperative Extension manages an email listserv in coordination with the Tucson forecast office of the National Weather Service to provide information in the days leading up to agriculturally important events, like winter storms and cold-air outbreaks. Please contact us if you'd like to sign up.
And for those of you in north-central and northeastern Arizona, Cooperative Extension is starting to coordinate with the Flagstaff forecast office of the National Weather Service to soon provide a similar email listserv for those in agriculture in this part of the state. Please contact us if you'd like to sign up.
Undergraduate students in the College of Agriculture and Life Sciences at the University of Arizona are looking for internships with businesses and companies in the viticulture and winery industries during 2022. Please contact Danielle Buhrow, Senior Academic Advisor and Graduate Program Coordinator in the Department of Agricultural and Resource Economics, for more information.
Please feel free to give us feedback on this issue of the Climate Viticulture Newsletter, suggestions on what to include more or less often, and ideas for new topics.
Did someone forward you this newsletter? Please contact us to subscribe.
Have a wonderful start to the new year!
With current and past support from:

