
Climate Viticulture Newsletter - 2022 June
< Back to Climate Viticulture Newsletter
Hello, everyone!
This is the June 2022 issue of the Climate Viticulture Newsletter – a quick look at some timely climate topics relevant to wine grape growing in Arizona.
May Recap | June Outlook | AVA Seasonal Analogs | Growing Season Heat Accumulation | Extra Notes
A Recap of May Temperature and Precipitation
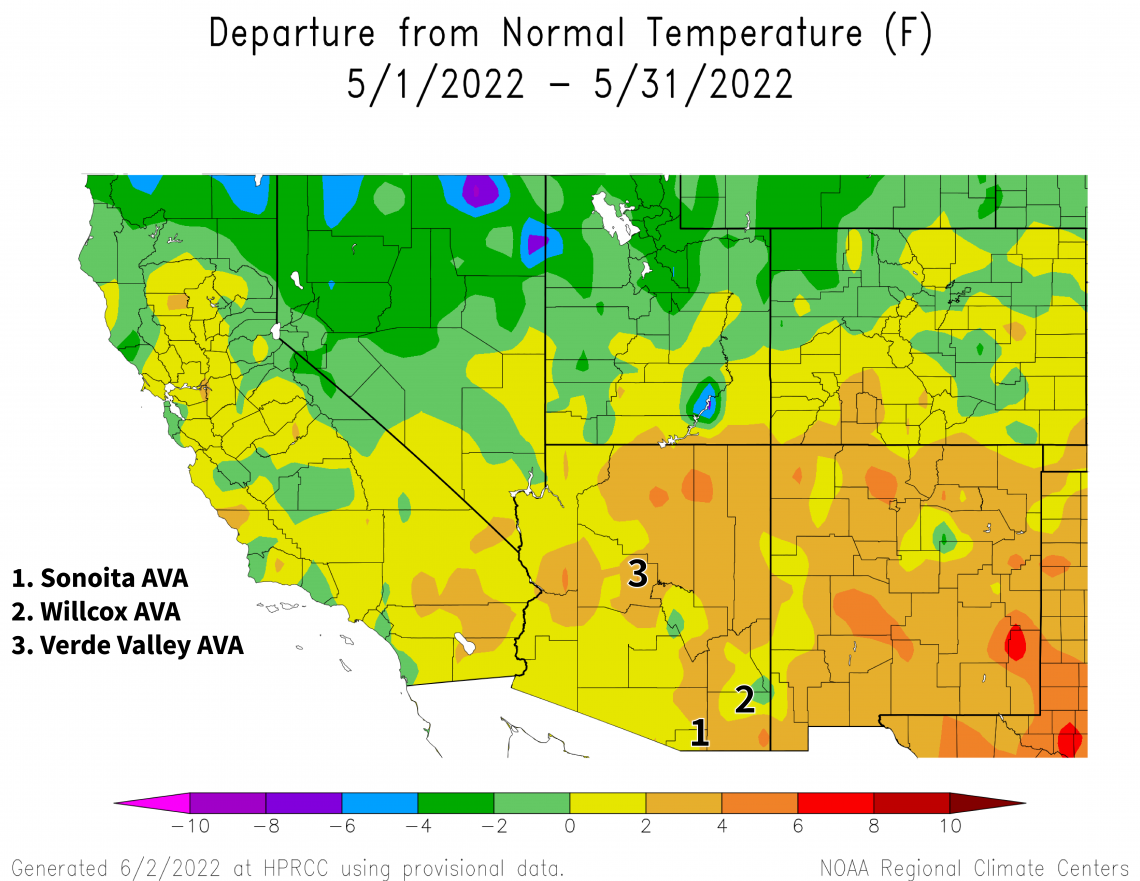
Monthly average temperatures were within 2 °F of the 1991-2020 normal for much of northwestern and southwestern Arizona (light green and yellow areas on map), and 2 to 4 °F above normal for most of the rest of the state (light orange area on map). As a comparison, monthly temperatures in May last year were within 2 °F of normal for much of the state.
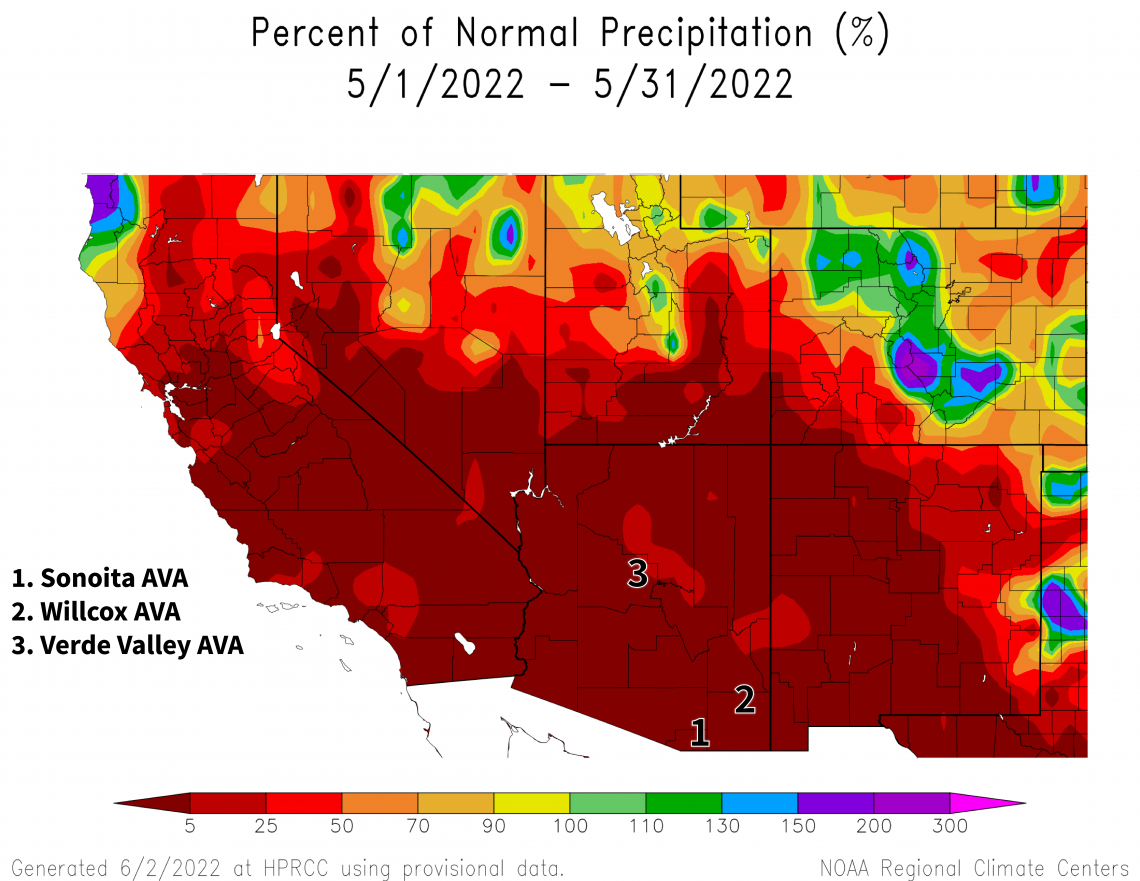
Except for some of the high-elevation areas along the Mogollon Rim, monthly precipitation totals were less than 5 % of the 1991-2020 normal for all of Arizona (dark red area on map). Yes, May is a relatively dry month with normal amounts being no more than 0.5 inches for almost all of the state. But, it isn’t often when the entire state essentially misses out. Precipitation totals for May 2021 were perhaps marginally higher, measuring less than 25 % of normal for much of Arizona, including the Sonoita and Verde Valley AVAs.
Despite what seem to be ever-present concerns over relatively low soil moisture and high irrigation needs over the past several months, the warmer- and drier-than-normal conditions since the start of the growing season may not be the worst that could happen for early-season growth stages. Recent windiness, on the other hand, may have been less welcome as it can make a mess of new shoots and interfere with flowering and fruit set. As far as statistics go, it was one of the windiest springs over the past couple of decades at some northern Arizona locations. We’ll be keeping an eye out for additional summaries on this in the coming weeks, to see how the numbers this year line up with historical ones across the state.
View more NOAA ACIS climate maps
The Outlook for June Temperature and Precipitation
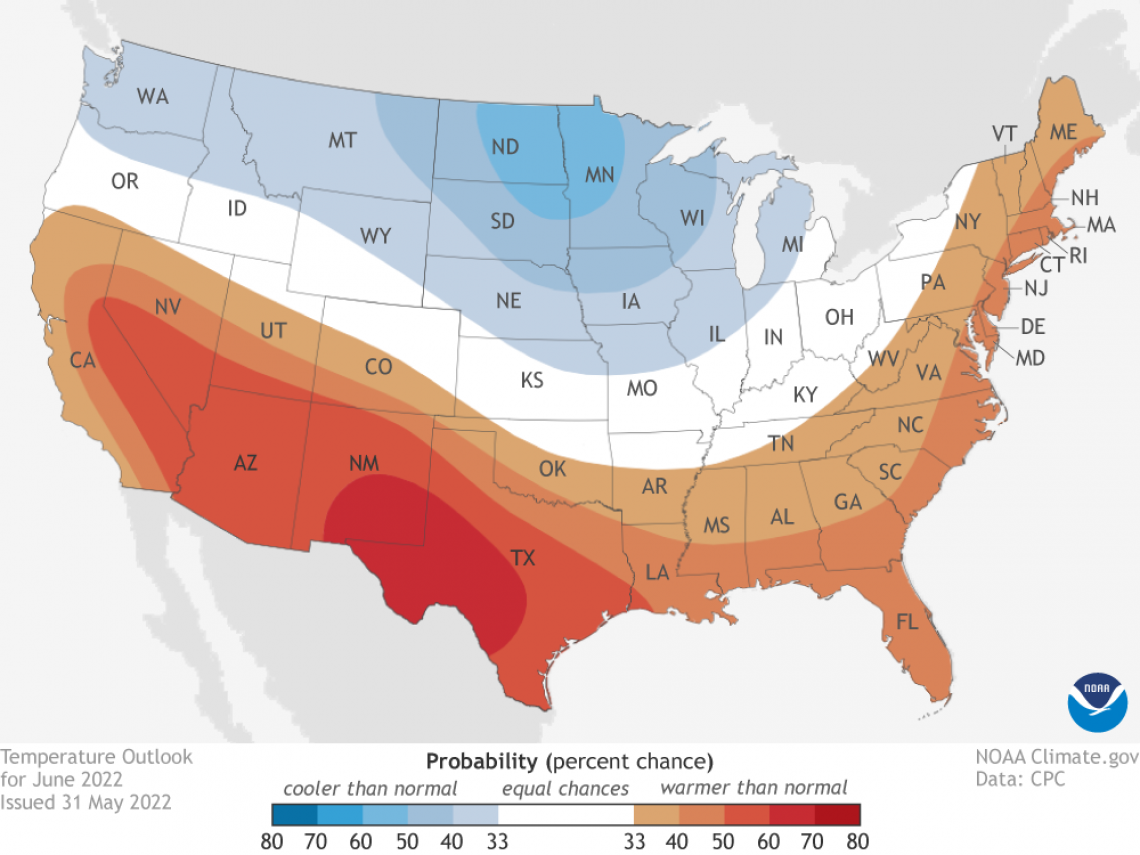
Temperatures over the course of this month have a moderate increase in chances for being above the 1991-2020 normal across all of Arizona (dark orange area on map). For reference, monthly temperatures in June last year were 2 to 6 °F above normal for almost all of the state, driven in part by a mid-month heat wave.
Although we don’t know for certain if a June heat wave will be part of the 2022 growing season, recent indications are that excessive heat may arrive the second week of the month. Of course, it’s not just vineyards in Arizona that recently have experienced near- to record-high temperatures. Information is available on this topic from the Australian Wine Research Institute. We’ve also seen a summary of how the heat dome was handled last year in Washington state. Discussion around how much to increase irrigation prior to such an event and effects like sunburned fruit are among the points addressed.
2022-jun-temp-outlook-noaa-cpc.png
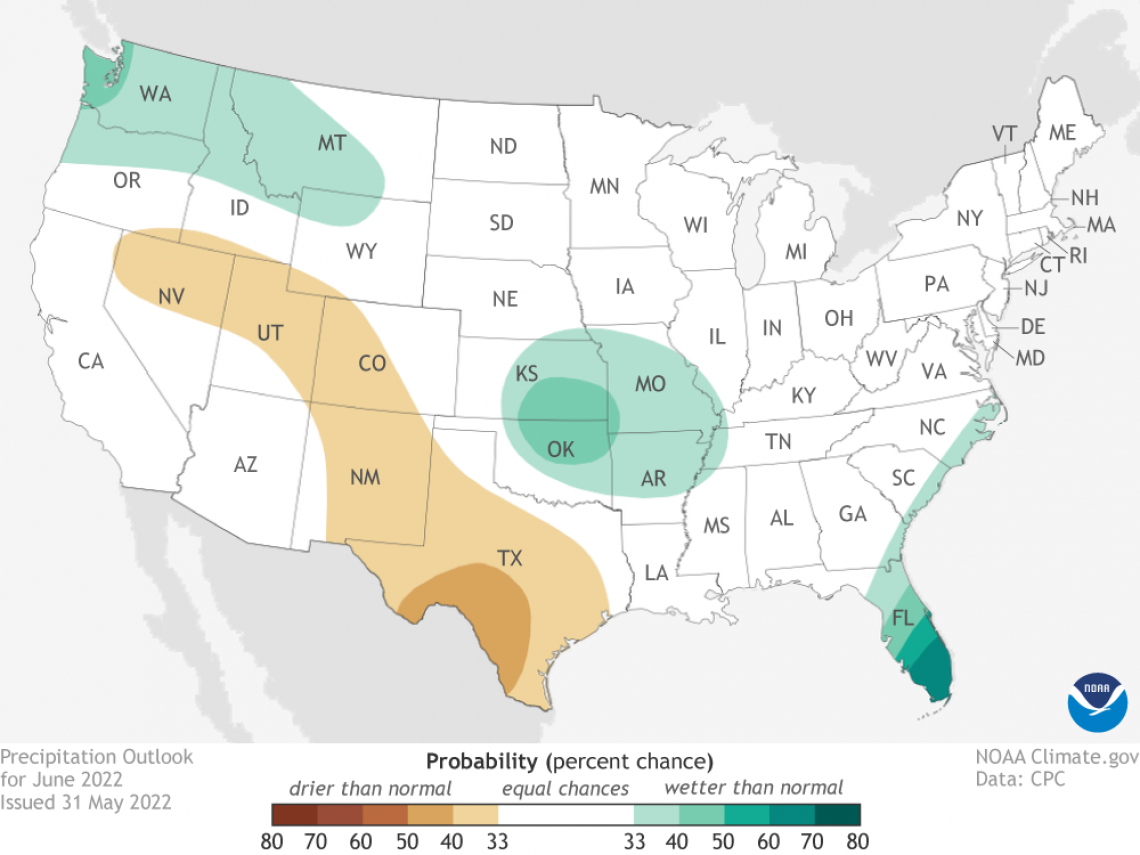
Precipitation totals for this month have equal chances for being below, near, or above the 1991-2020 normal across the state (white area on map). Granted, like April and May, June typically is a relatively dry month with normal amounts being less than 0.5 inches. The exception to this is high-elevation mountain areas in east-central and southeastern Arizona, where the normal amount is closer to or more than an inch. Precipitation during June 2021 ranged from less than 50 % to more than 200 % of normal, reflecting the hit-or-miss nature of rainfall at this time of year.
Of course, the topic of June precipitation wouldn’t be complete without a mention of the monsoon. Recent indications are leaning towards an early and wet onset towards the end of the month. This is consistent with the June-through-August seasonal outlook by NOAA’s Climate Prediction Center, which shows a slight increase in chances for above-normal totals in most of the southern and central parts of the state.
Read more about the June 2022 temperature and precipitation outlook
To stay informed of long-range temperature and precipitation possibilities beyond the coverage of a standard weather forecast, check in, too, with the six-to-ten-day outlook and eight-to-fourteen-day outlook issued daily by NOAA’s Climate Prediction Center.
2022-jun-prcp-outlook-noaa-cpc.png
Seasonal Analogs for Arizona AVAs
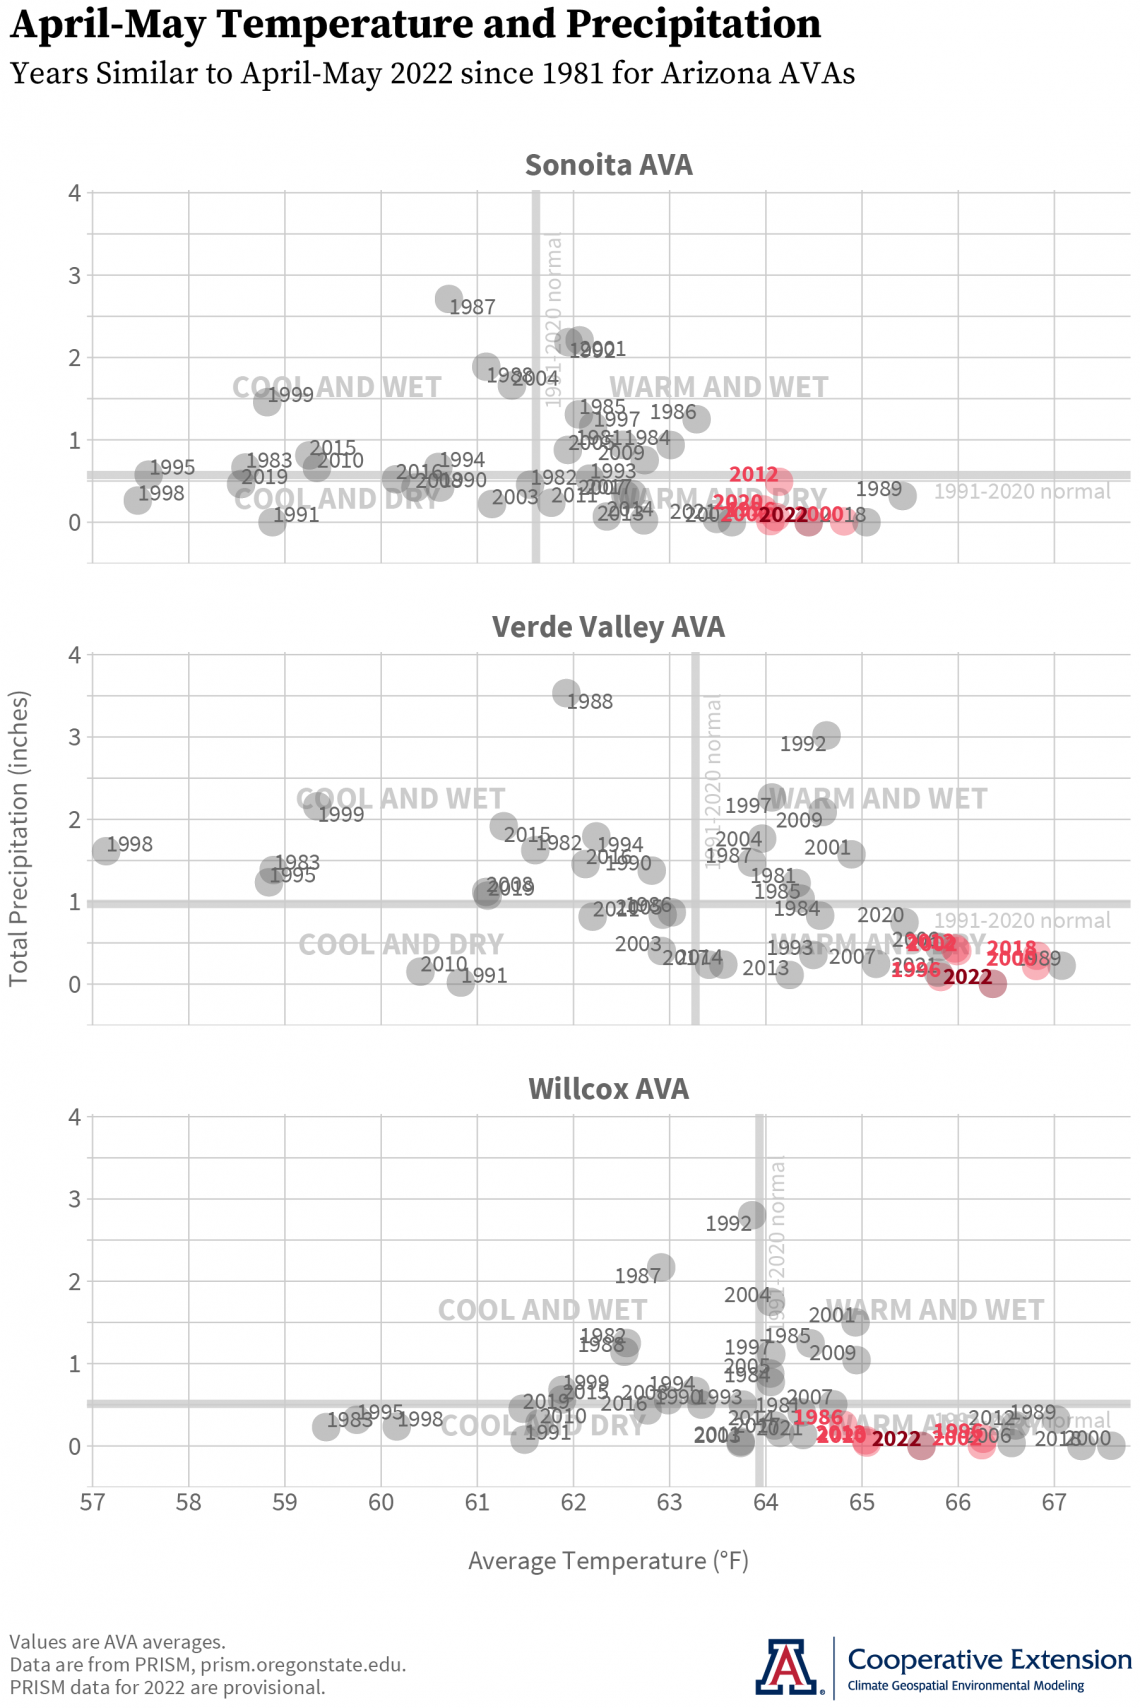
Conditions in May kept the growing season on the warm and dry sides of the 1991-2020 normals (thick gray vertical and horizontal lines on graphs, respectively). At this pre-veraison point in the 2022 growing season (dark red dots on graphs), similar past years (light red dots on graphs) are 1996, 2000, 2006, 2020, and 2012 for the Sonoita AVA, 2000, 2002, 1996, 2018, and 2012 for the Verde Valley AVA, and 2020, 2013, 2002, 1996, and 1986 for the Willcox AVA. To note, conditions last year are just outside the ‘top five’ lists here for all three AVAs.
With this take on the analog approach from weather forecasting, we’re comparing seasonal temperature and precipitation conditions in the three Arizona AVAs from this year with those from past ones. Based on the past years that are most similar, coupled with other information like that from the recap and outlook above, one can better interpret current vineyard observations and anticipate things like growth stage timing and irrigation demand in the coming weeks. One also can more quickly select the annual vineyard notes from previous years that might be more helpful in recalling what went well and what didn’t go so well.
As there are many new wine grape growers in the state, information from these graphs also can help point out what may not be known from experience in terms of how different seasonal temperature and precipitation can be at the same point in different years. Whether a new grower or not, what we see here and in the recap and outlook above suggests that the 2022 growing season so far is like the one in 2021, a time more likely in everyone’s experience. We take a finer look at this similarity in the context of heat accumulation, below.
cvn-202206-ava-analogs-2022-06-02.png
Heat Accumulation during the Growing Season
We pick up on this topic where we left off last year, looking at different heat-accumulation models that either do or do not account for high temperatures above 95 °F (35 °C) and the corresponding slowdown or stoppage of vine photosynthesis and growth. Such conditions at this time of year can delay the timing of subsequent growth stages like veraison and make for later harvest dates.
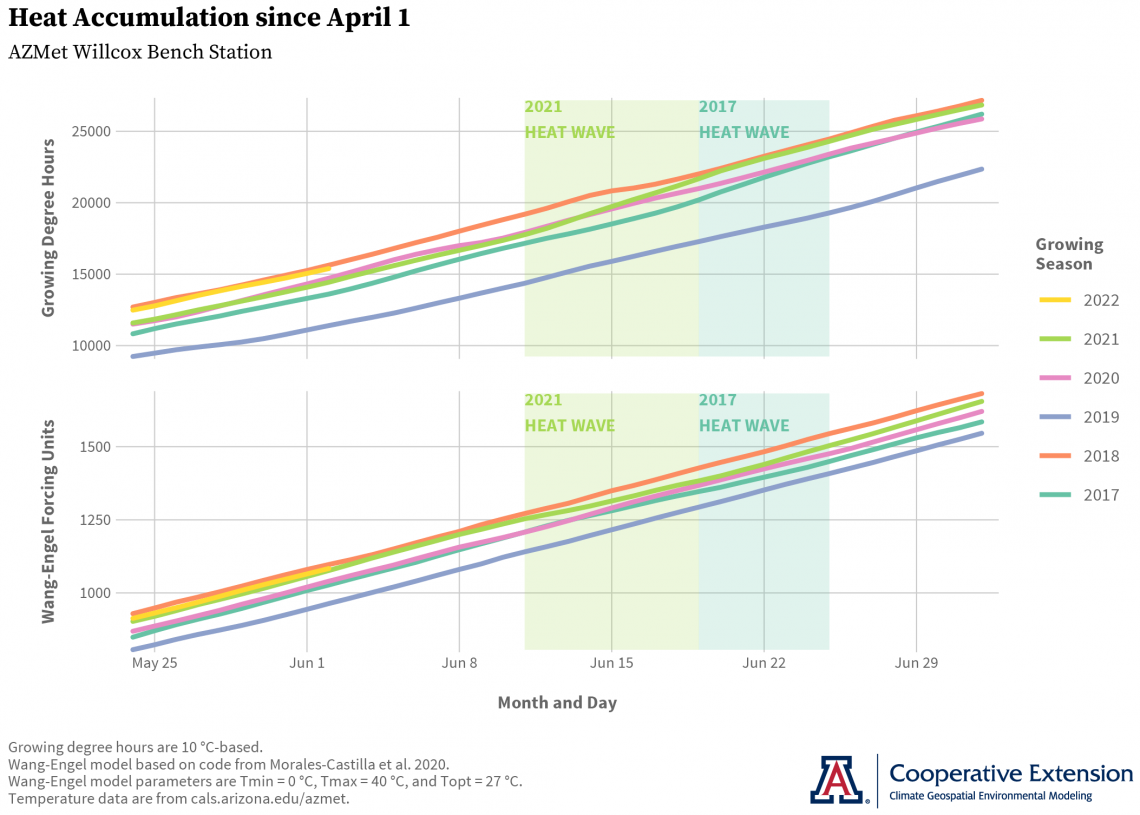
Here, growing degree hours (top graph) suggest that heat accumulation since April 1 this growing season (yellow line on graphs) is similar to that of 2021, 2020, and 2018 (green, pink, and orange lines on graphs, respectively). Similar to growing degree days but calculated with hourly temperature data instead of daily, growing degree hours are considered to be more accurate and precise than their daily counterpart when it comes to this relatively simple and widely used linear approach for modeling heat accumulation. Growing degree hours do not account for the above-mentioned high-temperature effects.
The Wang-Engel model (bottom graph), however, does account for these effects through a non-linear, process-based approach with three specified thresholds of minimum, optimum, and maximum temperature. Below the minimum temperature, no heat accumulation occurs. Between the minimum and optimum temperatures, the response to heat accumulation increases almost exponentially before leveling off. Between the optimum and maximum temperatures, the response to heat accumulation decreases rapidly. Above the maximum temperature, no heat accumulation occurs. As temperatures likely have not been high enough so far this year to slow down or stop vine photosynthesis, this model unsurprisingly also suggests that heat accumulation since April 1 is similar to that of 2021, 2020, and 2018.
Given a relatively later bud break this growing season than in 2021, and similar if not slightly higher heat accumulation, we wouldn’t be surprised if timing of recent and proximate growth-stages is slightly later than or similar to last year, at least near the AZMet Willcox Bench station.
What also might be similar to last year is the occurrence of a mid-June heat wave. As the Wang-Engel model indicates, near- to record-high temperatures at this time of year during 2021, as well as in 2017, in the Willcox AVA are hot enough to slow down or stop vine photosynthesis and growth. This is reflected by the decreased rate of accumulation of Wang-Engel forcing units during those periods (green and aqua shaded areas and lines on bottom graph, respectively).
In case you missed it above, information on handling heat waves in the vineyard is available from the Australian Wine Research Institute, as well as in this discussion of the heat dome last year in Washington state.
cvn-202206-heat-accumulation-2022-06-03.png
There now is a 58 % chance that still-current La Niña conditions will persist into the August-to-October period, and a 61 % chance that they continue through fall and into early winter 2022 for a rare three-peat. This is the most recent official forecast for ENSO, or El Niño Southern Oscillation, parts of the atmosphere and ocean across the tropical Pacific Ocean that cause El Niño and La Niña events.
Regional drought conditions continue to influence the wildland fire season in the Southwest. There is an above-normal potential this month for significant wildland fires for all of Arizona except for the southwestern part of the state where the potential is normal.
Regional drought conditions also continue to affect state water supply. There has been a lot of recent attention on the Colorado River, including a perspective on Arizona water policy options given the current situation.
For those of you in southeastern Arizona, Cooperative Extension manages an email listserv in coordination with the Tucson forecast office of the National Weather Service to provide information in the days leading up to agriculturally important events, like days with high winds and heat waves. Please contact us if you'd like to sign up.
And for those of you in north-central and northeastern Arizona, Cooperative Extension is starting to coordinate with the Flagstaff forecast office of the National Weather Service to soon provide a similar email listserv for those in agriculture in this part of the state. Please contact us if you'd like to sign up.
Undergraduate students in the College of Agriculture and Life Sciences at the University of Arizona are looking for internships with businesses and companies in the viticulture and winery industries during 2022. Please contact Danielle Buhrow, Senior Academic Advisor and Graduate Program Coordinator in the Department of Agricultural and Resource Economics, for more information.
Please feel free to give us feedback on this issue of the Climate Viticulture Newsletter, suggestions on what to include more or less often, and ideas for new topics.
Did someone forward you this newsletter? Please contact us to subscribe.
Have a wonderful June!
With current and past support from:

