
Climate Viticulture Newsletter - 2022 March
< Back to Climate Viticulture Newsletter
Hello, everyone!
This is the March 2022 issue of the Climate Viticulture Newsletter – a quick look at some timely climate topics relevant to wine grape growing in Arizona.
February Recap | March Outlook | AVA Seasonal Analogs | Start of the Growing Season | Extra Notes
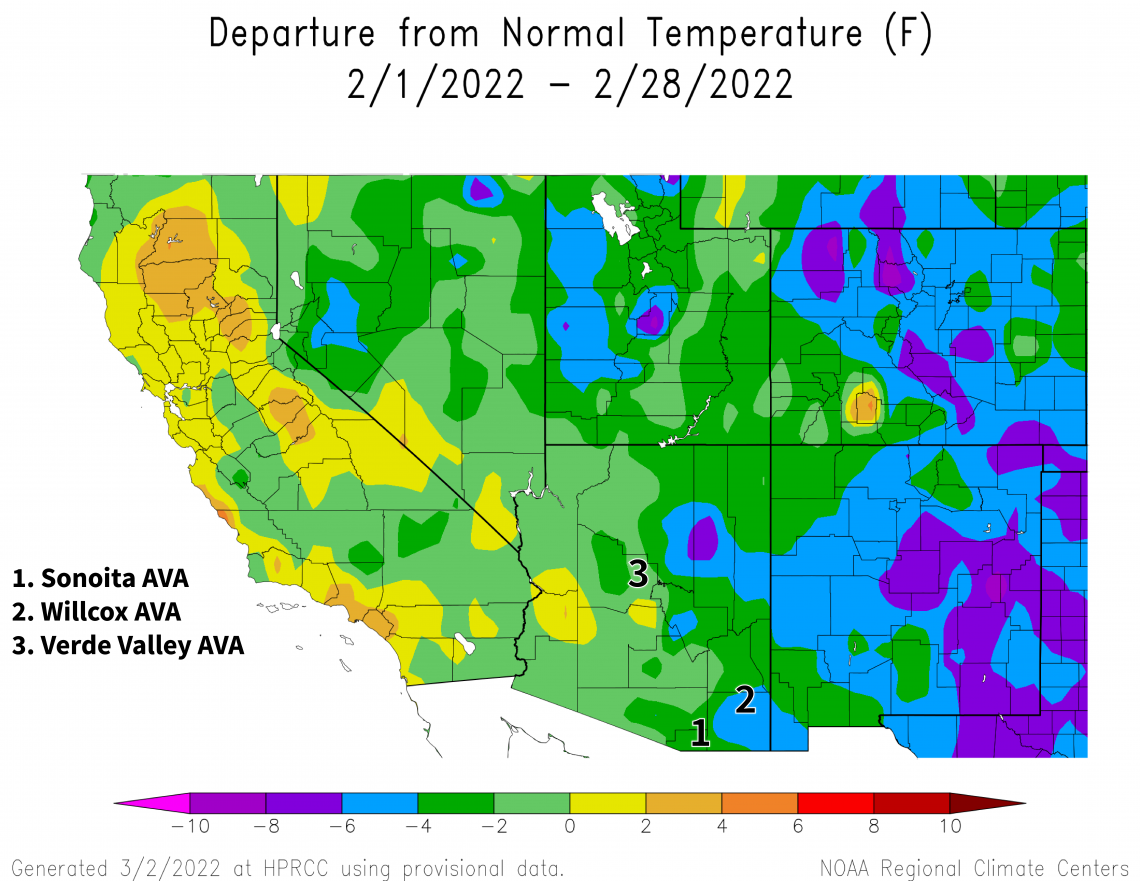
A Recap of February Temperature and Precipitation
Monthly average temperatures were within 2 °F of the 1991-2020 normal for the western half of the state (light green and yellow areas on map), whereas they were 2 to 6 °F below normal for the eastern half (dark green and blue areas on map). In comparison, monthly temperatures in February last year were within 3 °F of the 1981-2010 normal for almost all of the state.
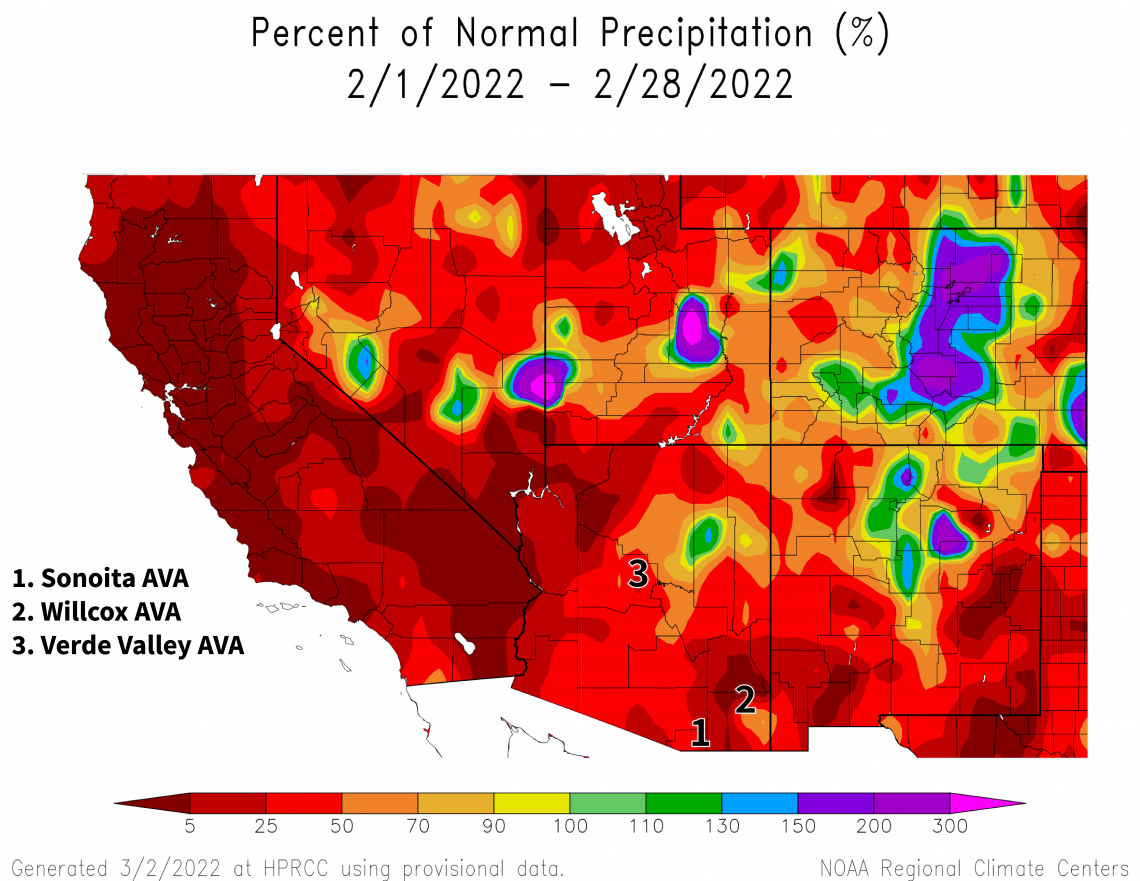
It was yet another relatively dry month for Arizona this dormant season. Monthly precipitation totals were less than 50 % of the 1991-2020 normal for much of the state (red and dark red areas on map). For many growers in these areas, this meant about 0.5 inches measured. Some locations close to the Mogollon Rim and on the Colorado Plateau in the northeastern part of the state fared somewhat better, with totals between 50 and 100 % (dark orange, light orange, and yellow areas on map). Overall, conditions were similar to those in February 2021, when rain and snow amounts were less than 50 % of the 1981-2010 normal for almost all of Arizona.
Combining these February figures with average temperatures and precipitation totals from November, December, and January nudged conditions further back from the warm-and-dry extreme set in winter 2017-2018. However, we still continue on the warm and dry sides of normal this dormant season, and still are affected by a La Niña event. More on both of these in following sections.
View more NOAA ACIS climate maps
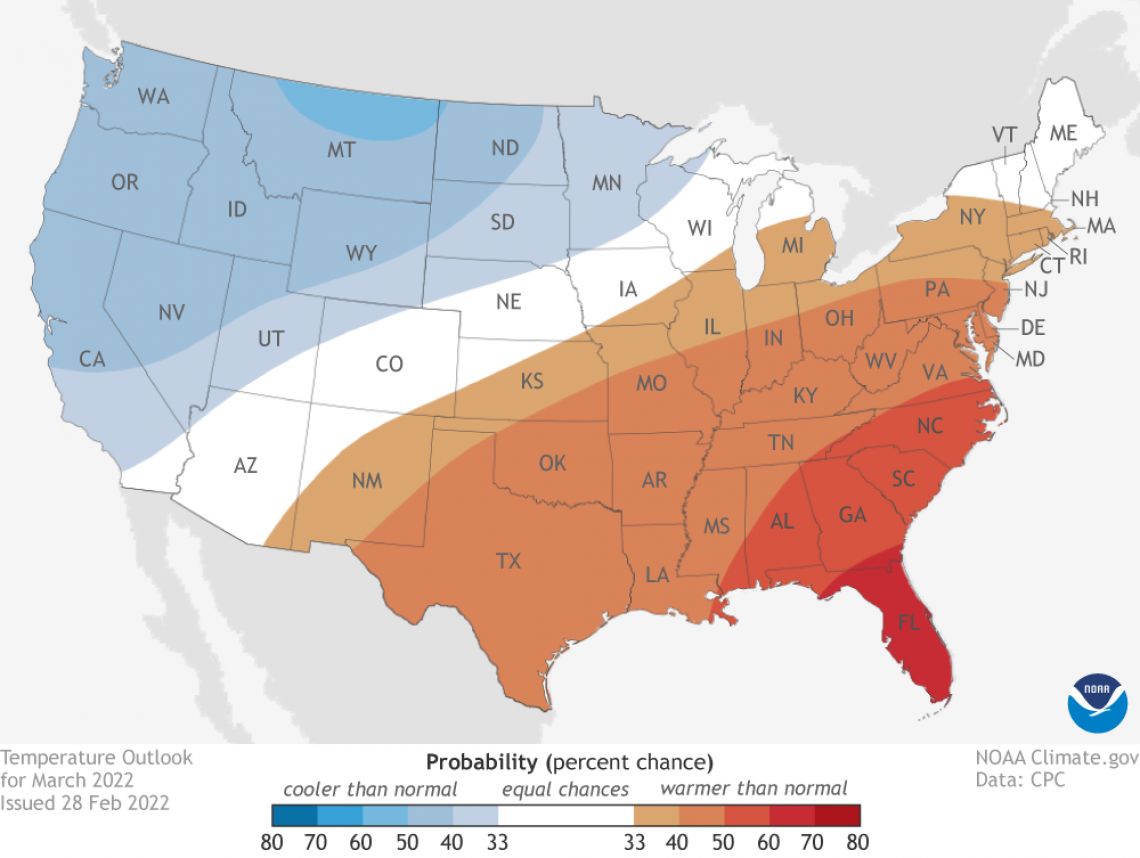
The Outlook for March Temperature and Precipitation
Temperatures over the course of this month have equal chances for being below, near, or above the 1991-2020 normal across almost all of Arizona (white area on map). Bookending this is a slight increase in chances for below-normal temperatures in the extreme northeastern corner of the state (light blue area on map) and a slight increase in chances for above-normal temperatures in the extreme southeastern corner (light orange area on map). For reference, monthly temperatures in March last year were 1 to 3 °F below the 1981-2010 normal for almost all of the state.
2022-mar-temp-outlook-noaa-cpc.png
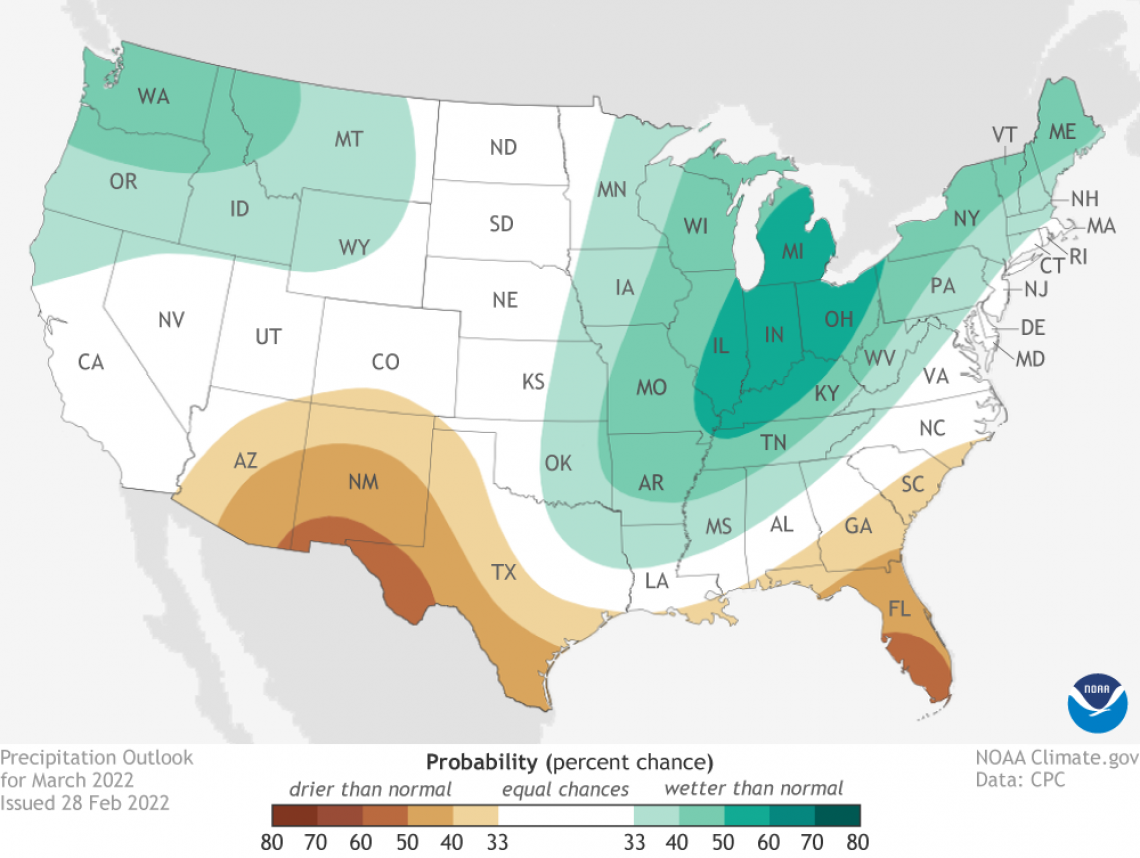
Precipitation totals for this month have a slight increase in chances for being below the 1991-2020 normal across the southwestern half of the state (light and dark tan areas on map). In northwestern Arizona, there are equal chances for below-, near-, or above-normal totals (white area on map). Precipitation during March 2021 was less than 70 % of the 1981-2010 normal for much of the state, with only some areas in the northern part receiving near-normal amounts.
With La Niña conditions continuing to hang on and affect regional weather this dormant season, the anticipated dry conditions for March continue the storyline of winter irrigation being needed this year to prevent dry soil and delayed spring growth and to leach salts from the root zone. As for temperatures, the lack of them leaning towards cooler or warmer than normal for March keeps bud break and the start of the growing season somewhat in mystery. But, there may be a few clues on this from conditions so far this dormant season. More on this below.
Read more about the March 2022 temperature and precipitation outlook
To stay informed of long-range temperature and precipitation possibilities beyond the coverage of a standard weather forecast, check in, too, with the six-to-ten-day outlook and eight-to-fourteen-day outlook issued daily by NOAA’s Climate Prediction Center.
2022-mar-prcp-outlook-noaa-cpc.png
Seasonal Analogs for Arizona AVAs
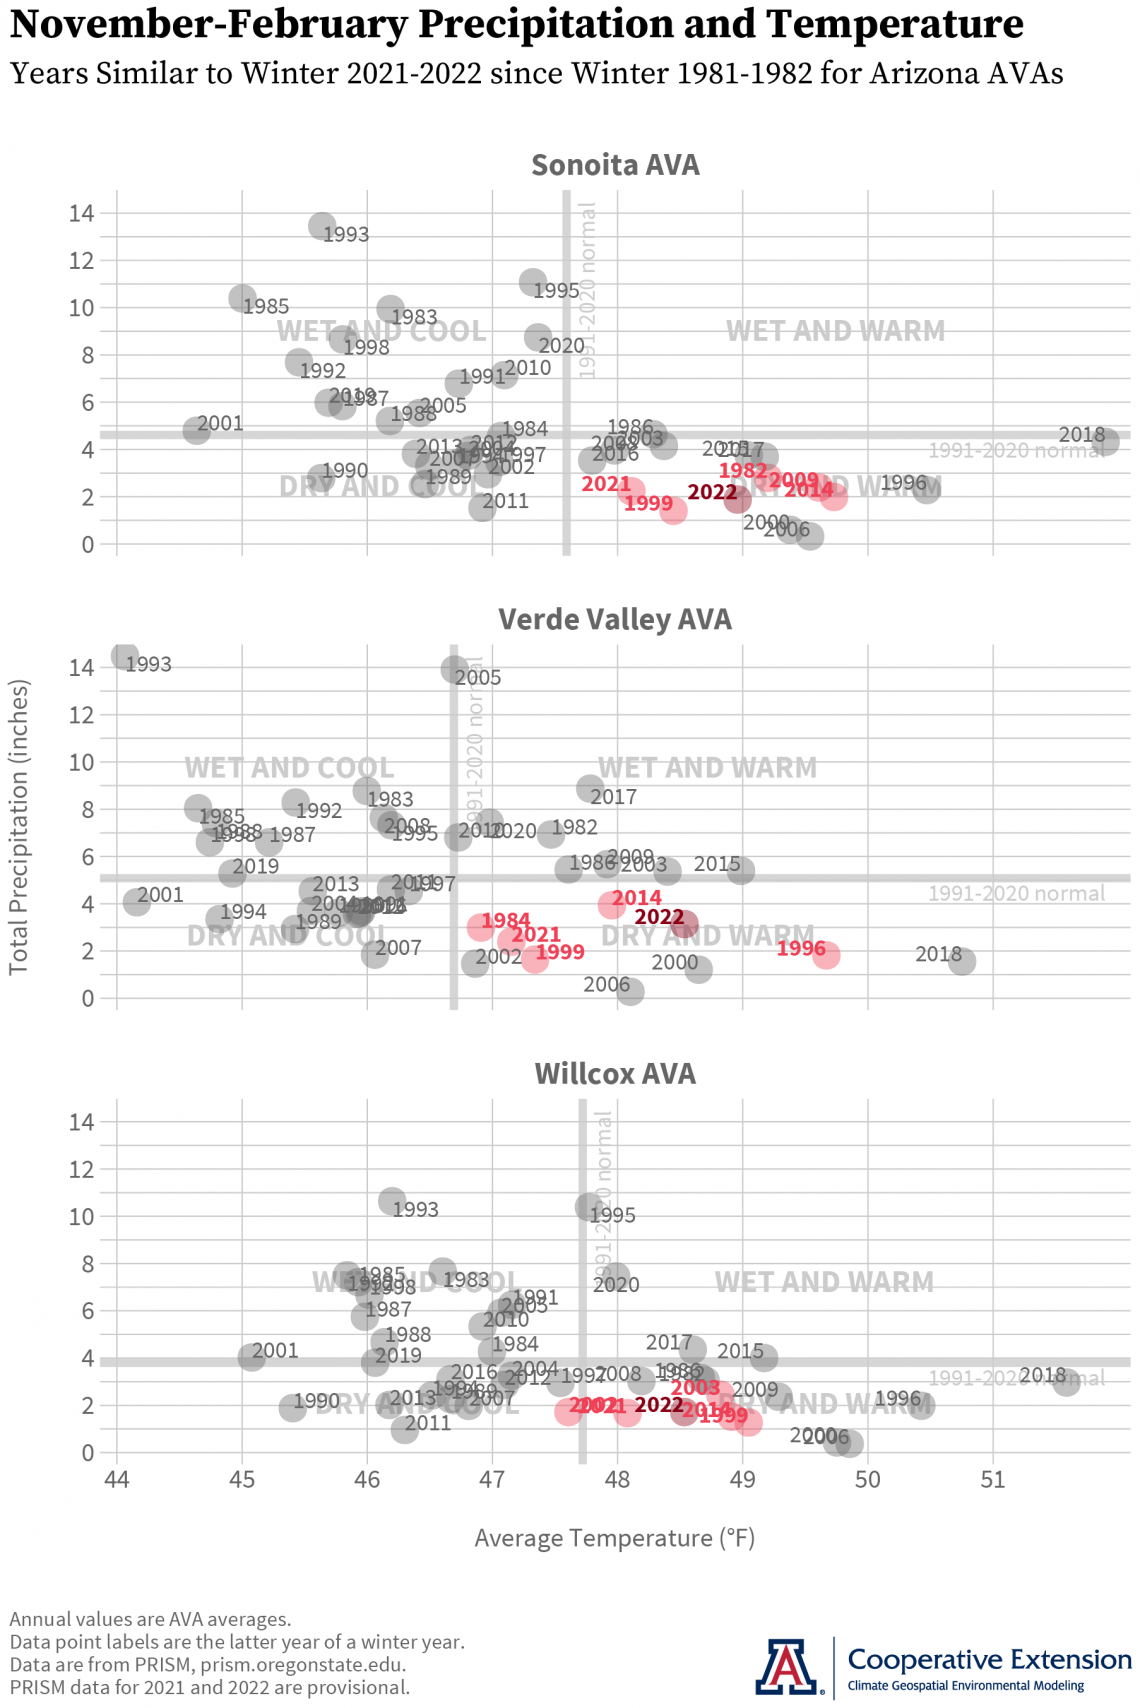
Use of the same ‘analog’ approach from the past two newsletter issues indicates that temperature and precipitation conditions since November (dark red dots on graphs) are like those in winters 2020-2021, 2013-2014, and 1998-1999 (light red dots on graphs) for all three Arizona AVAs. Other similar past winters are 2008-2009 and 1981-1982 for the Sonoita AVA (top graph), 1995-1996 and 1983-1984 for the Verde Valley AVA (middle graph), and 2002-2003 and 2001-2002 for the Willcox AVA (bottom graph).
Although the lineups for analog years haven’t stayed exactly the same during the course of this winter, what has remained consistent is conditions being on the warm and dry sides of the 1991-2020 normals this dormant season (thick gray lines in all graphs). At this seasonal scale, such values for average temperature and total precipitation point most readily at the need for dormant-season irrigation to help prevent delayed spring growth and to leach salts past the root zone.
Of course, temperatures during this time of year have additional implications for the start of the growing season and foreseeing them requires consideration of data instead at hourly and daily scales, combined with a few physiological processes. We look at this in the next section.
cvn-202203-ava-analogs-2022-03-03.png
Vine Dormancy and the Start of the Growing Season
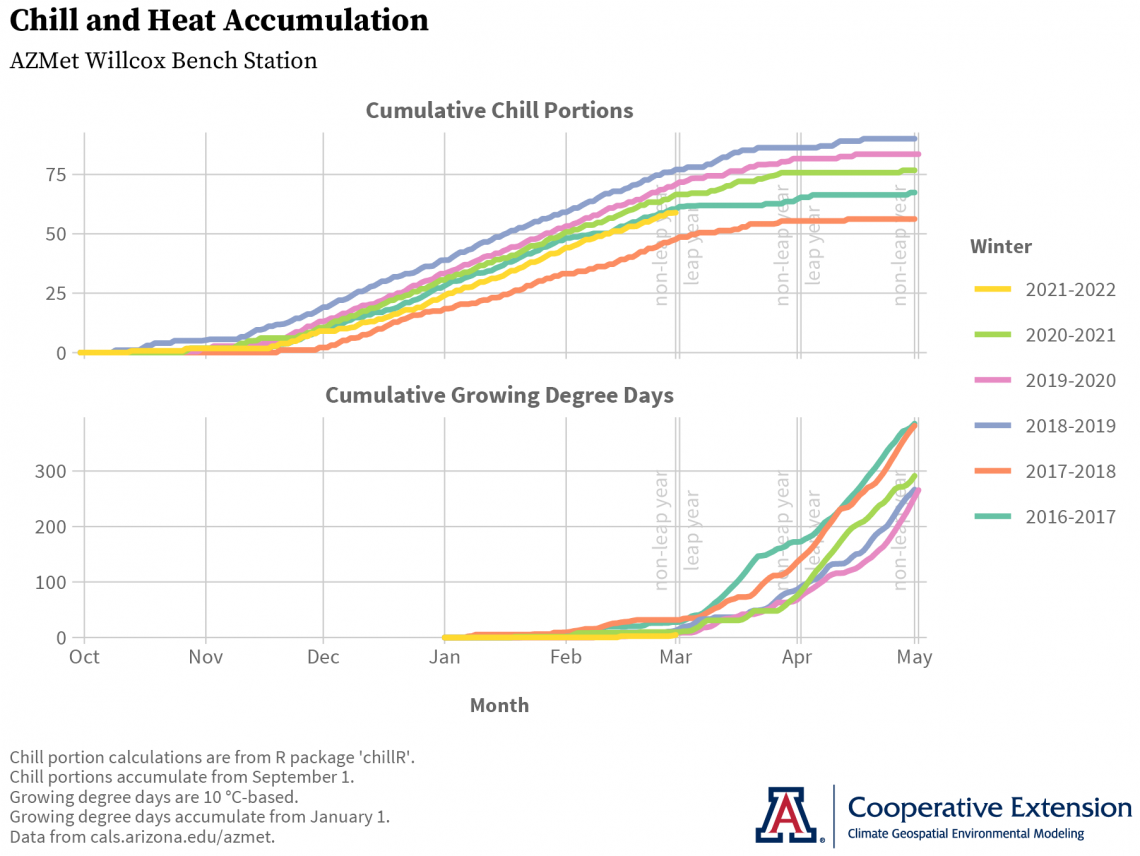
Temperature conditions at the AZMet Willcox Bench station in the south-central part of the Willcox AVA so far this dormant season have resulted in cumulative chill portion values that are most similar to those from winter 2016-2017 (yellow and aqua lines in top graph, respectively). However, cumulative growing degree day values are most like those from winters 2020-2021, 2019-2020, and 2018-2019 (yellow, green, pink, and blue lines in bottom graph, respectively). Different winters listed for these two measures related to vine dormancy makes it more difficult to use past ‘analog’ years to predict bud break.
We nonetheless can still use these data in combination with some of what we know about deacclimation kinetics to help possibly get over this hurdle. You’ll recall that deacclimation kinetics is related to how chill accumulation, dormancy state, and temperature affect the loss of cold hardiness and timing of bud break in grape vines. It also is an explanation for why relatively lower (higher) heat accumulation is needed for vines to start the growing season during winters with relatively higher (lower) chill accumulation.
In this context, and with current chill accumulation at relatively lower values than the past three years and unlikely to match them at this late stage of the dormant season, our educated guess is that a relatively higher amount of heat accumulation than the past three years is needed for budbreak in 2022. If heat accumulation this year continues to track that of the past three (yellow line and green, pink, and blue lines in bottom graph, respectively), a relatively late start to the growing season may be in the works, at least at this location.
To continue tracking chill and heat accumulation during the month, visit our related early-stage, interactive web application that updates daily.
There now is a 77 % chance that the current La Niña event will persist into the March-to-May period. Once into the growing season, however, the ‘double-dip’ event of this winter is expected to fade away, as there is a 56 % chance of ENSO conditions transitioning to neutral between May and July. This is the most recent official forecast for ENSO, or El Niño Southern Oscillation, parts of the atmosphere and ocean across the tropical Pacific Ocean that cause El Niño and La Niña events.
Being on the warm and dry sides of the 1991-2020 normals this dormant season has allowed drought conditions in the state to worsen in recent weeks, and will influence the wildland fire season over the coming months. There is an above-normal potential this month for significant wildland fires in southeastern Arizona. Elsewhere across the state, the potential is normal.
In case you missed it last month, we wrote about which topics were on most minds at the 2021 ‘Growing Season in Review’ workshops for Arizona wine grape growers. The short answer to this question was ‘harvest’, ‘2020’, ‘august’, ‘rot’, and ‘frost’. The long answer to the above question is our recently-finished summary, where we take a closer look at these terms and some examples of them, along with a more general assessment of timeline posts.
For those of you in southeastern Arizona, Cooperative Extension manages an email listserv in coordination with the Tucson forecast office of the National Weather Service to provide information in the days leading up to agriculturally important events, like late-season winter storms and late spring freezes. Please contact us if you'd like to sign up.
And for those of you in north-central and northeastern Arizona, Cooperative Extension is starting to coordinate with the Flagstaff forecast office of the National Weather Service to soon provide a similar email listserv for those in agriculture in this part of the state. Please contact us if you'd like to sign up.
Undergraduate students in the College of Agriculture and Life Sciences at the University of Arizona are looking for internships with businesses and companies in the viticulture and winery industries during 2022. Please contact Danielle Buhrow, Senior Academic Advisor and Graduate Program Coordinator in the Department of Agricultural and Resource Economics, for more information.
Please feel free to give us feedback on this issue of the Climate Viticulture Newsletter, suggestions on what to include more or less often, and ideas for new topics.
Did someone forward you this newsletter? Please contact us to subscribe.
Have a wonderful March!
With current and past support from:

