
Climate Viticulture Newsletter - 2022 November
< Back to Climate Viticulture Newsletter
Hello, everyone!
This is the November 2022 issue of the Climate Viticulture Newsletter – a quick look at some timely climate topics relevant to wine grape growing in Arizona.
October Recap | November Outlook | AVA Seasonal Analogs | Climate and Fruit Composition | Extra Notes
A Recap of October Temperature and Precipitation
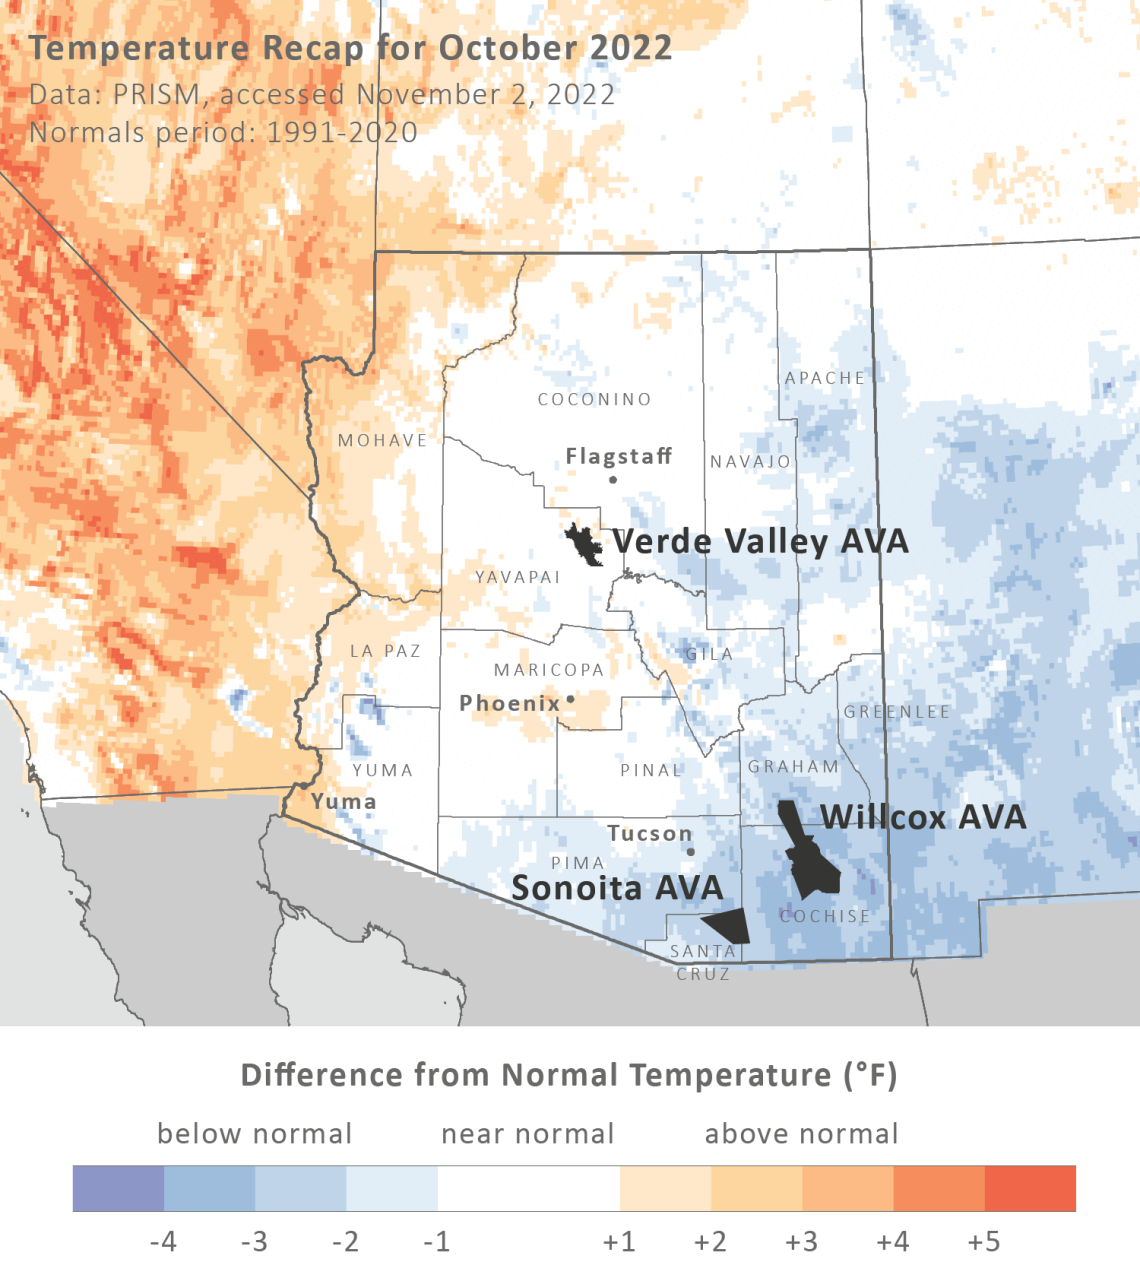
Monthly average temperatures were 1 to 4 °F below the 1991-2020 normal for much of the southeastern and east-central parts of Arizona (light blue and blue areas on map), including the Sonoita and Willcox AVAs. Much of the rest of the state, including the Verde Valley AVA, saw near-normal temperatures (white areas on map). Above-normal temperatures mostly were confined to the extreme western part of the state (light orange and orange areas on map). For reference, monthly temperatures in October last year generally were within 2 °F of normal for the eastern third of the state and 2 to 4 °F below normal for the western two-thirds.
Area-wide, average October temperature for the Arizona AVAs was 59.4 °F for the Sonoita AVA, 63.4 °F for the Verde Valley AVA, and 60.5 °F for the Willcox AVA.
Many if not all growing regions recorded the first fall freeze in the latter part of the month. In the Willcox AVA, for example, temperatures first dropped below 32 °F at the AZMet Bonita and Willcox Bench stations on October 25. Although freezing temperatures occurred then and a few times after, it only was for a few hours and daily minimums did not drop below 28 °F. Historically speaking, a late-October date for the first fall freeze isn’t surprising, particularly for cold spots in the Sonoita, Willcox, and Verde Valley AVAs.
cvn-202211-recap-temp.png
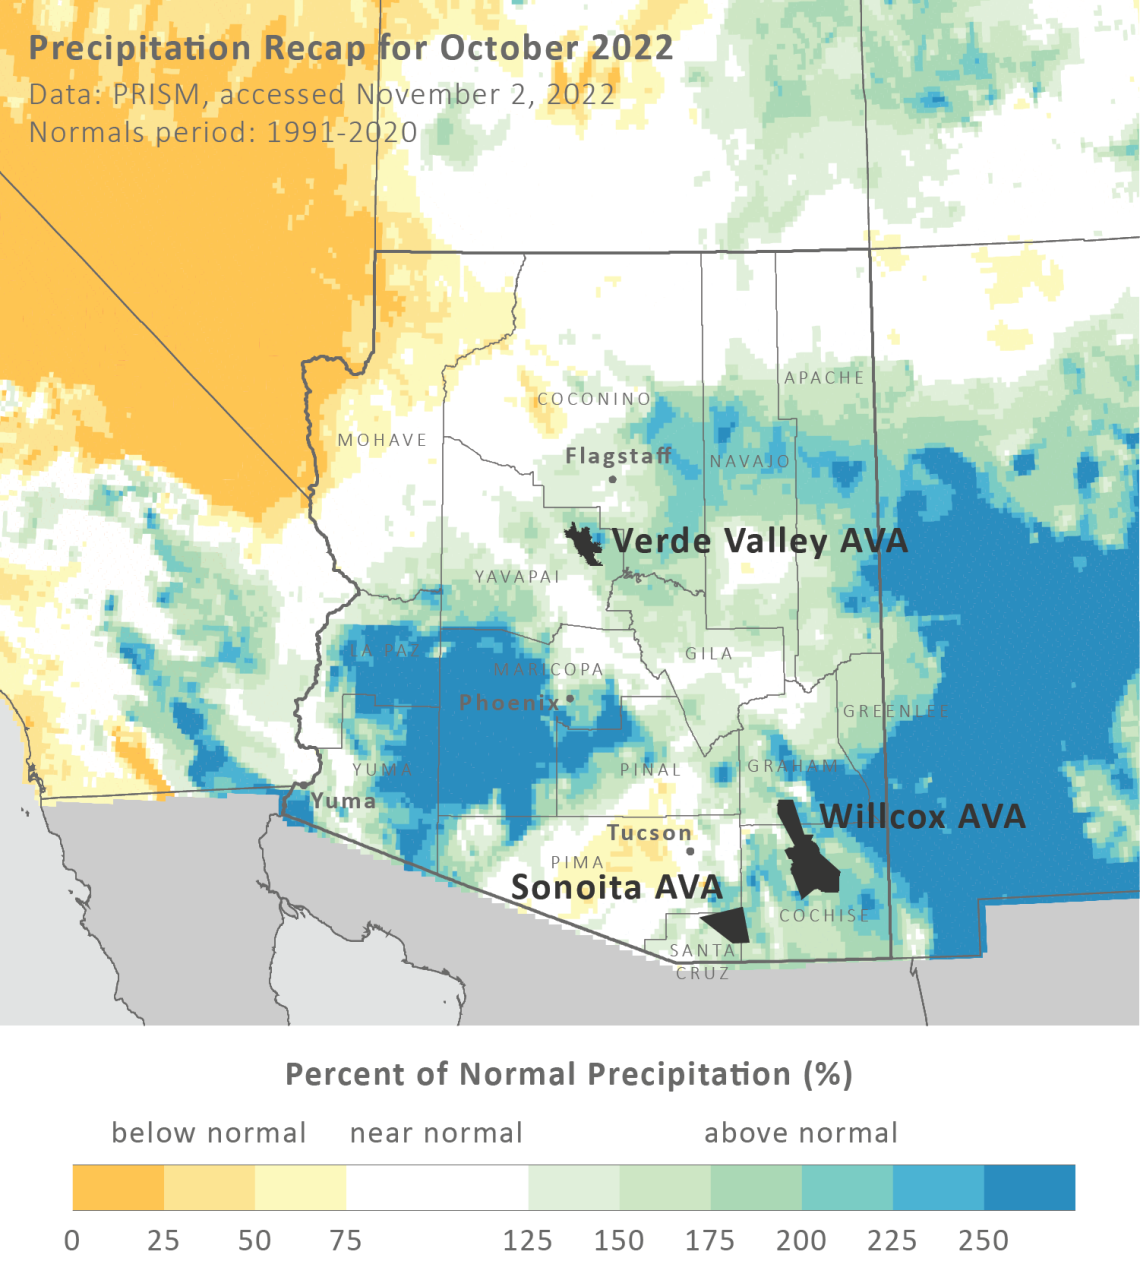
Monthly precipitation totals were more than 125 % of normal for many parts of the state (light aqua, aqua, and blue areas on map), including all three Arizona AVAs. Only locations in south-central and extreme northwestern Arizona recorded below-normal totals (light yellow and yellow areas on map). Precipitation during October 2021 generally was less than 75 % of normal for much of the southern half of the state and near to more than 150 % of normal for much of the northern half.
Area-wide, total October precipitation for the Arizona AVAs was 2.0 inches for the Sonoita AVA, 1.9 inches for the Verde Valley AVA, and 1.4 inches for the Willcox AVA.
Learn more about PRISM climate data
cvn-202211-recap-prcp.png
The Outlook for November Temperature and Precipitation
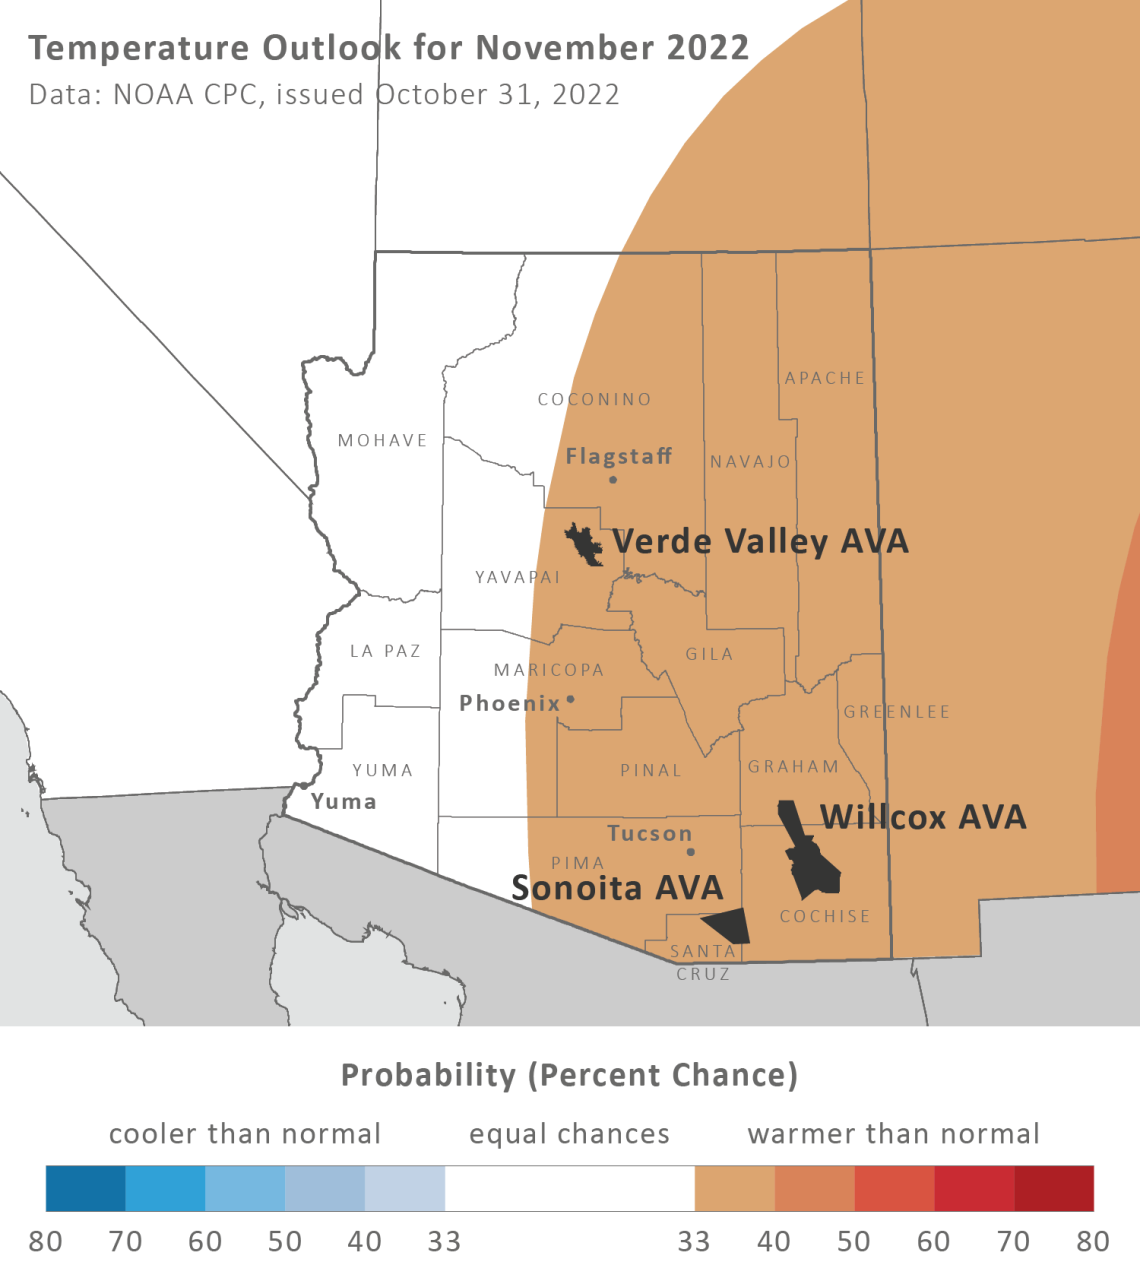
Temperatures over the course of this month have a slight increase in chances for being above the 1991-2020 normal across the eastern half of Arizona (light orange area on map). For the western half, there are equal chances for below-, near-, or above-normal temperatures (white area on map). Monthly temperatures in November last year were 2 to 6 °F above normal for almost all of the state.
Area-wide, average November temperature in 2021 for the Arizona AVAs was 57.2 °F for the Sonoita AVA, 56.6 °F for the Verde Valley AVA, and 56.2 °F for the Willcox AVA.
cvn-2022-outlook-temp.png
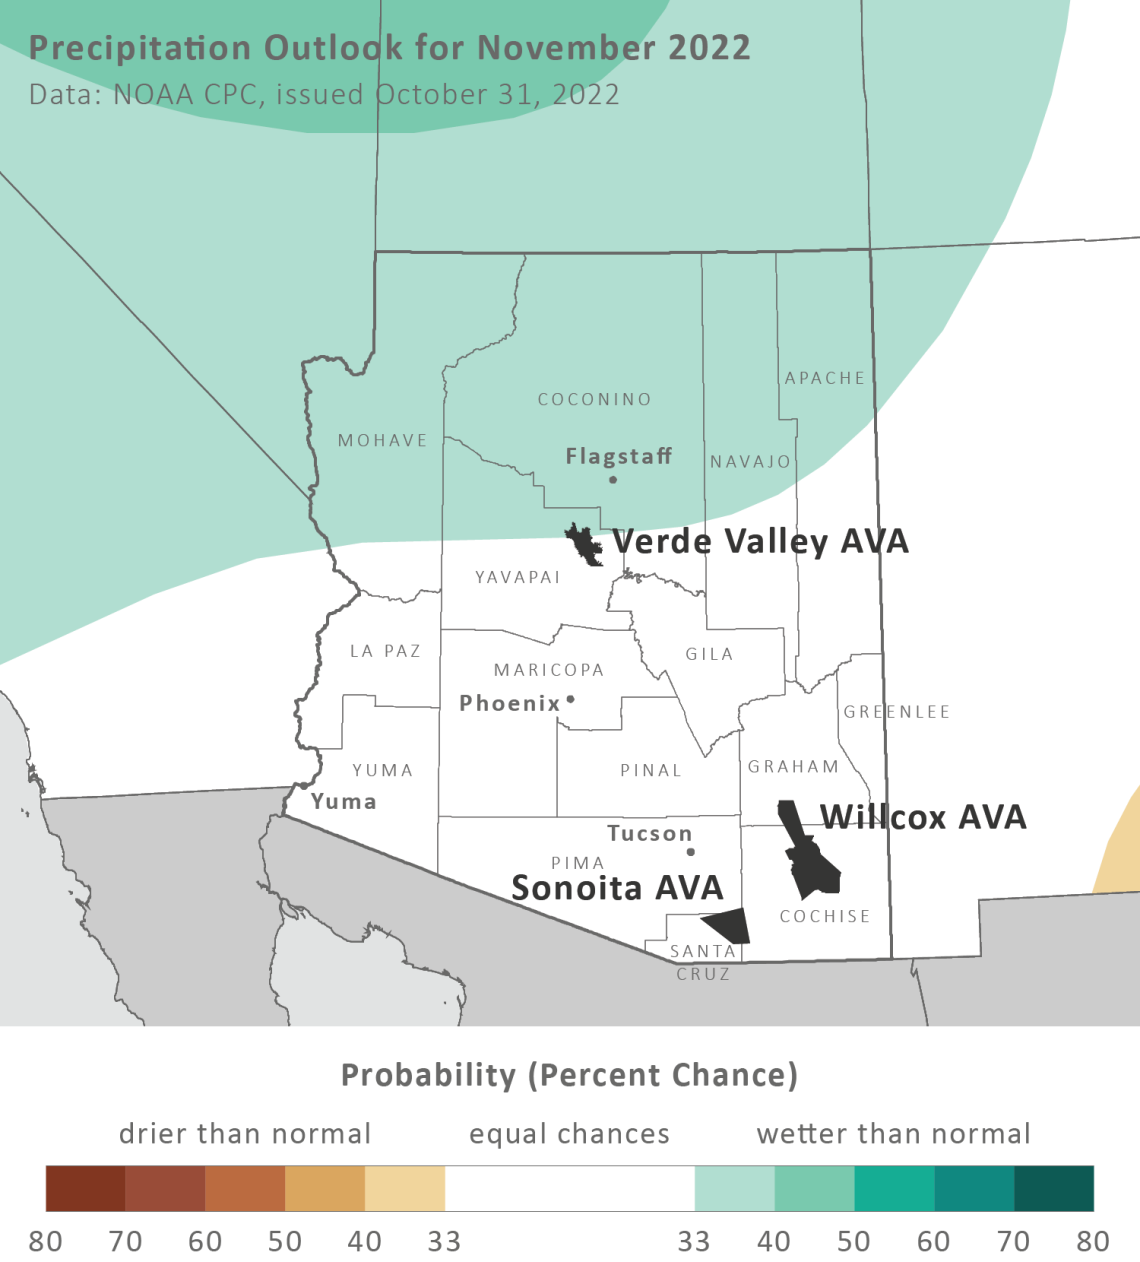
Precipitation totals for this month have a slight increase in chances for being above normal across the northern one-third of the state (light aqua area on map). For the southern two-thirds, there are equal chances for below-, near-, or above-normal totals (white area on map). Precipitation during November 2021 was less than 25 % of normal for almost all of Arizona.
Area-wide, total November precipitation in 2021 for the Arizona AVAs was 0.1 inches for the Sonoita AVA, and less than 0.1 inches for both the Verde Valley and Willcox AVAs.
Despite an unsettled start to November, expectations are for La Niña conditions to influence weather over the coming months. This generally means fewer cool-season storms and drier-than-normal conditions throughout Arizona, especially across the southern tier. Like the last two winters, extra attention to irrigation might be needed to prevent dry soil and delayed spring growth and to leach salts from the root zone. More details on a rare La Niña three-peat in the Extra Notes section below.
Read more about the November 2022 temperature and precipitation outlook
To stay informed of long-range temperature and precipitation possibilities beyond the coverage of a standard weather forecast, check in, too, with the six-to-ten-day outlook and eight-to-fourteen-day outlook issued daily by NOAA’s Climate Prediction Center.
cvn-2022-outlook-prcp.png
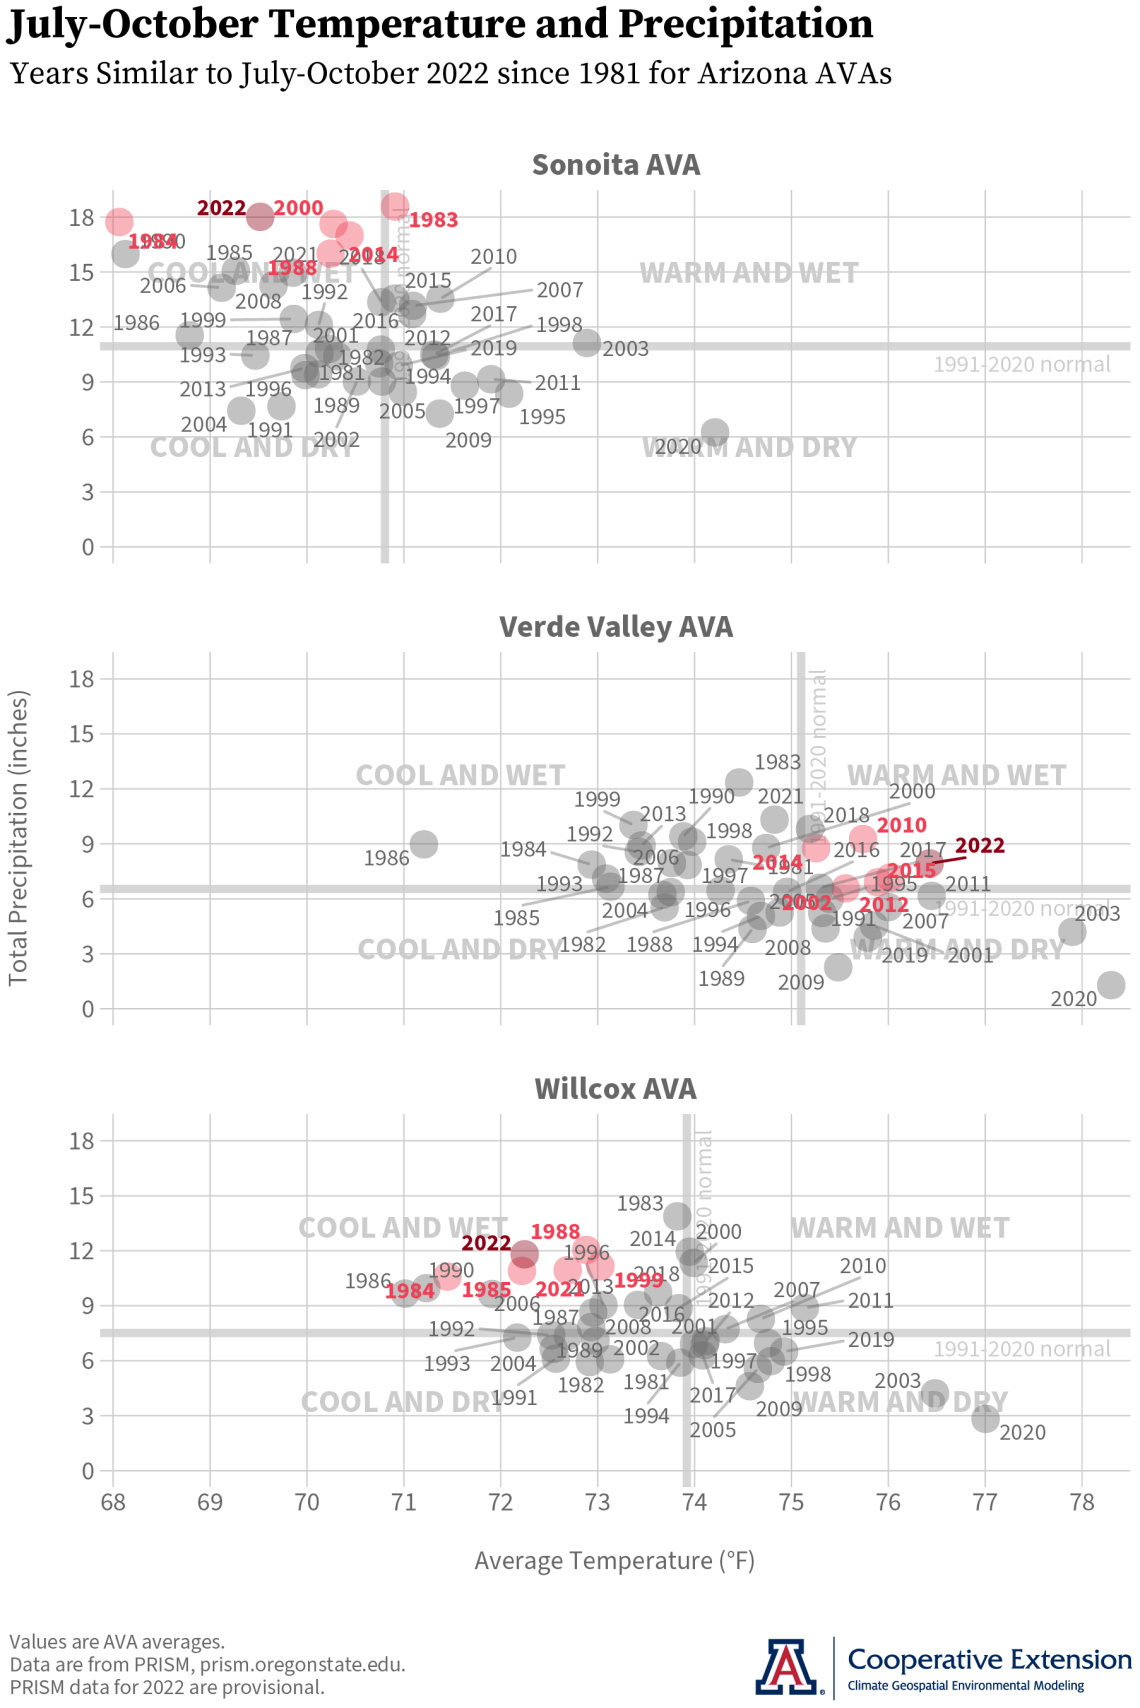
Seasonal Analogs for Arizona AVAs
The focus of this topic at this time of the year is the July-through-October time frame, the part of the growing season when the climatic differences between the three Arizona AVAs really show. What’s interesting to us is that this time frame also coincides with when wine grapes ripen, which means that these climatic differences could also extend to fruit composition differences, something we look at in the next section.
Average temperature and total precipitation during these four months this year place both the Sonoita and Willcox AVAs in the cooler- and wetter-than-normal part of their respective graphs (dark red dots in upper-left quadrants). Corresponding AVA-wide values for the Sonoita AVA are 69.5 °F and 18.0 inches, and 72.2 °F and 11.8 inches for the Willcox AVA. In contrast, average temperature and total precipitation for the Verde Valley AVA are warmer than and near normal, respectively, with corresponding values of 76.4 °F and 7.9 inches. As all three AVAs, particularly the Sonoita AVA, encompass areas of relatively higher elevation where temperature typically is lower and precipitation typically is higher, we wouldn’t be surprised if such values for vineyards at relatively lower elevations are warmer and drier than the numbers here.
Given these conditions, the closest analog years (light red dots) for the July-October period in 2022 are:
2000, 2014, 1984, 1983, and 1988 for the Sonoita AVA
2015, 2012, 2014, 2010, and 2002 for the Verde Valley AVA
1988, 1985, 2021, 1999, and 1984 for the Willcox AVA
We’ll return to this newsletter topic in a couple of months to see how conditions during dormancy compare to previous years.
cvn-202211-ava-analogs-2022-11-02.png
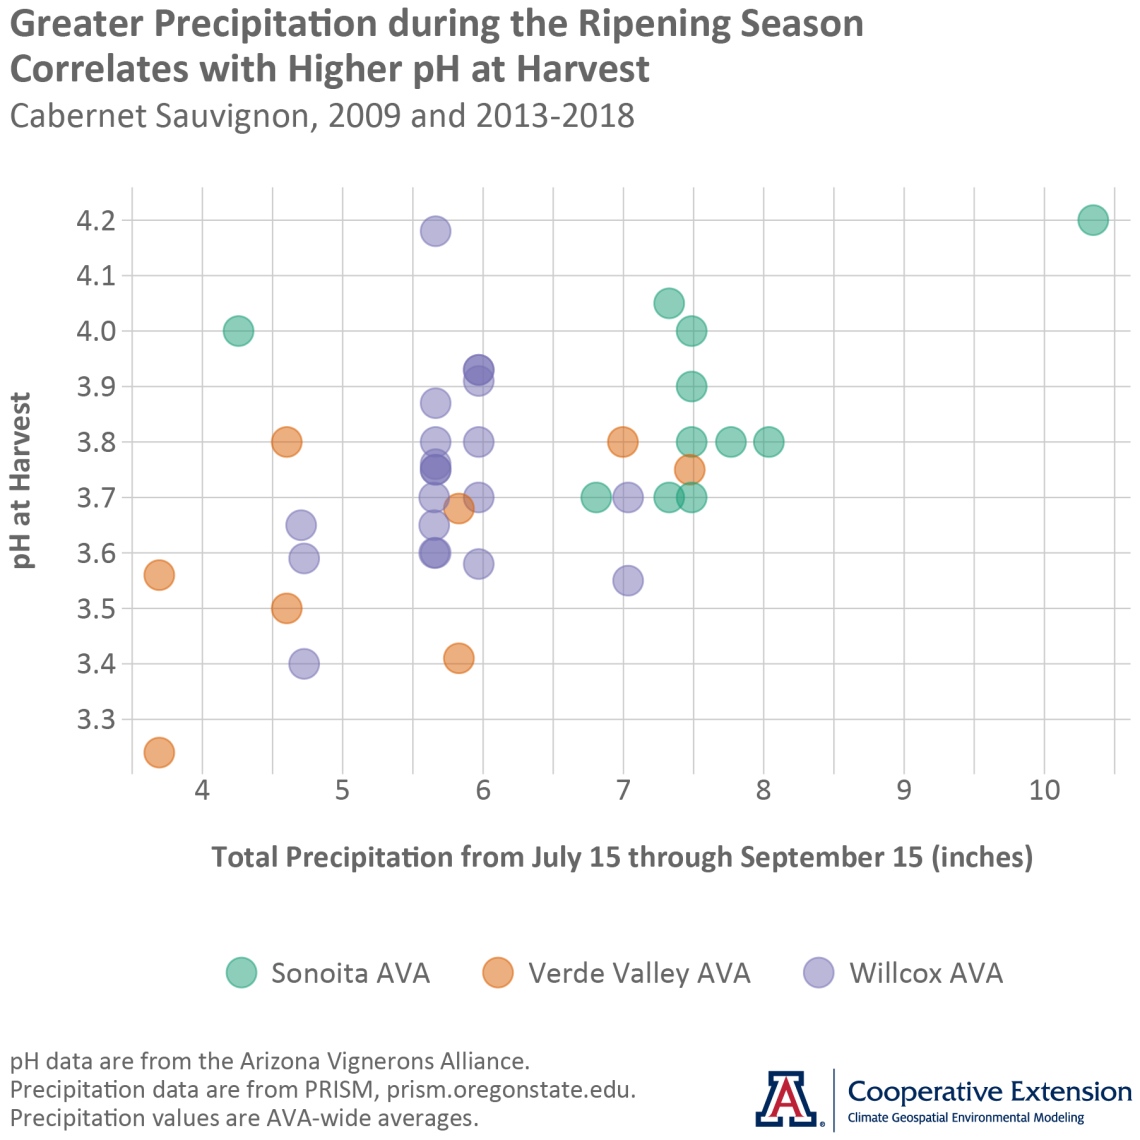
Arizona Climate and Fruit Composition
When we started to look at how temperature and precipitation during the ripening season might relate to fruit composition at harvest, we expected to see patterns with higher minimum temperatures and higher pH or higher maximum temperatures and higher °Brix. We weren’t expecting to see an apparent imprint of how wet or dry the monsoon had been. To our surprise, however, rain during ripening might be the main effect of Arizona climate on composition, particularly on pH. Perhaps this shouldn’t be surprising, as the pH of rain at this time of year often is between 5.0 and 5.5, and there are effects on fruit from absorption of rain.
We see an example of this here with pH values at harvest for Cabernet Sauvignon from the 2009 and 2013 through 2018 vintages. Color-coded by Arizona AVA, lower pH occurs with lower rain totals and higher pH occurs with higher rain totals. And although we don’t show it here, we see the same general pattern when comparing rain totals to pH2 * °Brix, a measure of composition balance mentioned in the 1970 textbook by Amerine and Joslyn, Table Wines, the Technology of Their Production, and one that might better reflect picking decisions and ripening conditions.
In this example, precipitation values are the total amount from July 15 through September 15 to account for differences in ripening periods between the three AVAs. The Arizona Vignerons Alliance provided the fruit composition data.
We’ll have more to come on this topic. One thing on our to-do list, for instance, is to see if the patterns we expected between temperature and fruit composition appear when we only consider relatively dry monsoon vintages. In the meantime, please feel free to share your thoughts with us on this topic.
cabernet-sauvignon-ppt-x-ph-2022-11-03.png
There is a 75 % chance that a rare La Niña three-peat will persist through the December-through-February period, and a 54 % chance that ENSO-neutral conditions finally appear during the February-April period. This is the most recent official forecast for ENSO, or El Niño Southern Oscillation, parts of the atmosphere and ocean across the tropical Pacific Ocean that cause El Niño and La Niña events.
Attention all growers, viticulturists, and vineyard owners! Cooperative Extension will soon be conducting a Statewide Viticulture Needs Assessment and needs your help. Topics will include production, irrigation management, soil fertility, and management of pests, pathogens, and disease, among others. Please stay tuned for its upcoming release as your feedback will shape how Cooperative Extension can best serve the wine grape growing industry.
In case you missed it, the Arizona Illustrated show at Arizona Public Media, a non-profit service of the University of Arizona, recently ran a short story on southern Arizona wine grape growing and wine making.
For those of you in southeastern Arizona, including the Sonoita and Willcox AVAs, Cooperative Extension manages an email listserv in coordination with the Tucson forecast office of the National Weather Service to provide information in the days leading up to agriculturally important events, like fall freezes and the occasional winter storm. Please contact us if you'd like to sign up.
And for those of you in north-central and northeastern Arizona, including the Verde Valley AVA, Cooperative Extension also now manages an email listserv in coordination with the Flagstaff forecast office of the National Weather Service to provide similar information for this part of the state. Please contact us if you'd like to sign up.
Undergraduate students in the College of Agriculture and Life Sciences at the University of Arizona are looking for internships with businesses and companies in the viticulture and winery industries. Please contact Danielle Buhrow, Senior Academic Advisor and Graduate Program Coordinator in the Department of Agricultural and Resource Economics, for more information.
Please feel free to give us feedback on this issue of the Climate Viticulture Newsletter, suggestions on what to include more or less often, and ideas for new topics.
Did someone forward you this newsletter? Please contact us to subscribe.
Have a wonderful November!
With current and past support from:

