
Climate Viticulture Newsletter - 2022 September
< Back to Climate Viticulture Newsletter
Hello, everyone!
This is the September 2022 issue of the Climate Viticulture Newsletter – a quick look at some timely climate topics relevant to wine grape growing in Arizona.
August Recap | September Outlook | AVA Seasonal Analogs | Temperature Ranges and Ripening | Extra Notes
A Recap of August Temperature and Precipitation
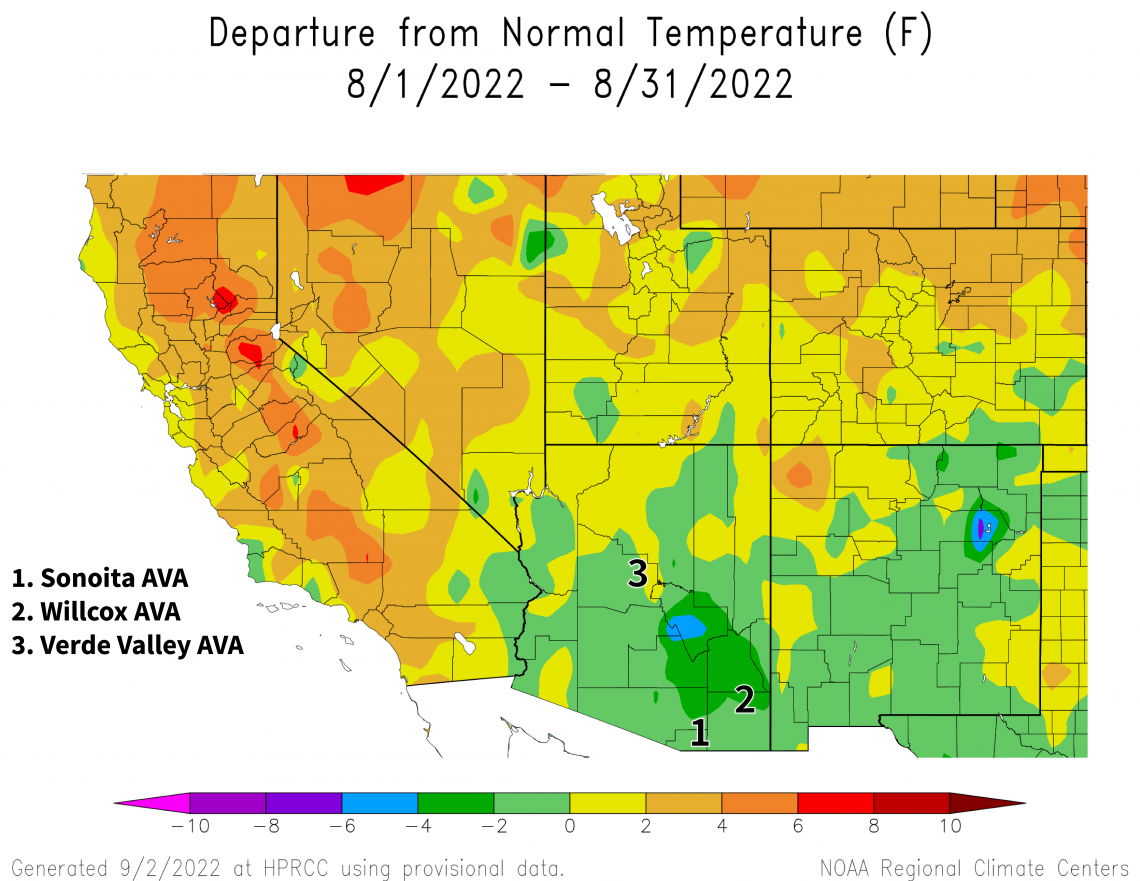
Monthly average temperatures were within 2 °F of the 1991-2020 normal for the state (yellow and light green areas on map), except for a part of southeastern Arizona that included the northern part of the Willcox AVA where temperatures were 2 to 4 °F below normal (dark green area on map). For comparison, monthly temperatures in August last year were near normal for almost all of the state.
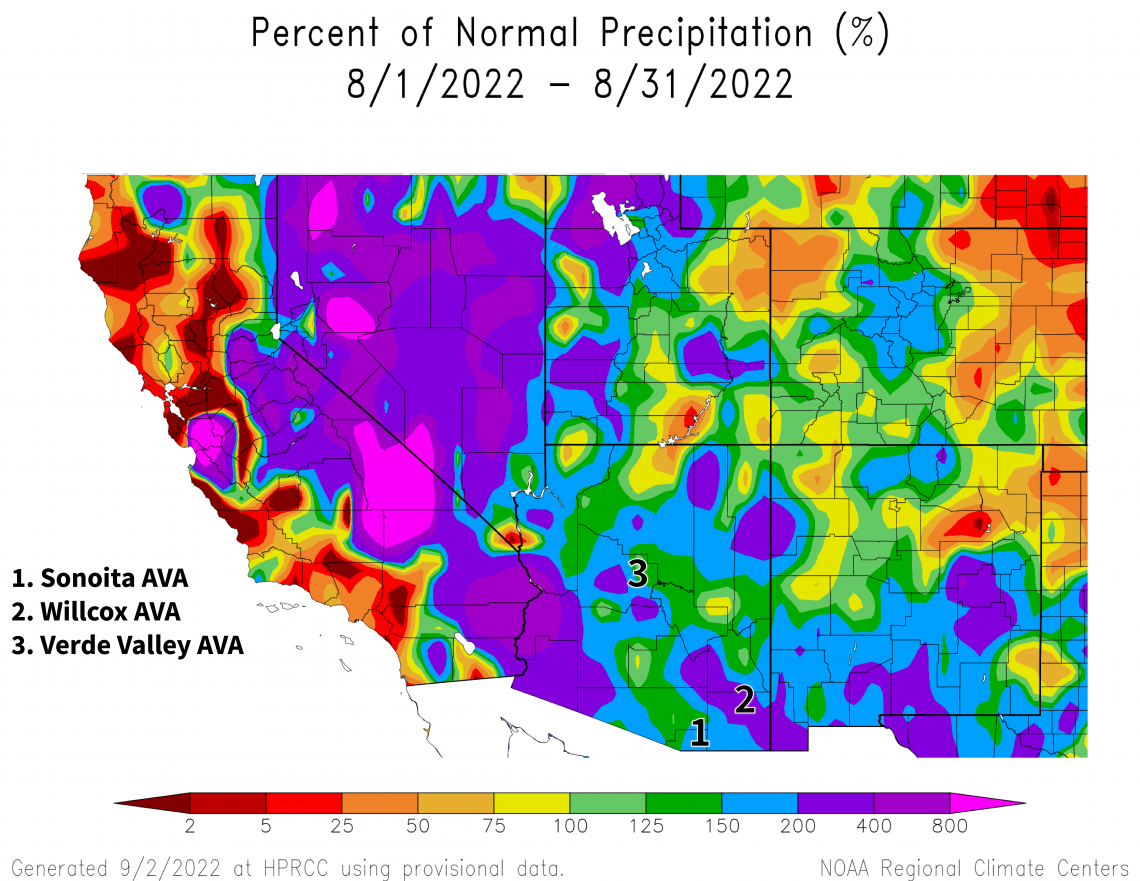
The active monsoon this year continued in August, and monthly precipitation totals were above the 1991-2020 normal for almost all of the state. For the Sonoita and Verde Valley AVAs, totals generally were 125 to 200 % of normal (dark green and blue areas on map). This translates to amounts of 5 to 7 and 3 to 4 inches for these AVAs, respectively. For the Willcox AVA, totals were 150 to more than 200 % of normal (blue and purple areas on map), with amounts between 4 and 7 inches. Rainfall during August 2021 was more than 125 % of normal for much of the southern two-thirds of Arizona, including the Sonoita AVA. Amounts were near- or below-normal for the rest of the state, with the Verde Valley and Willcox AVAs falling in the former of these two groups.
As in July, the relative lack of heat in August had a lot to do with the humidity, cloudiness, and rainfall brought about in large part by the North American monsoon. Combining such conditions with a relatively late start to the 2022 growing season may have made for slower ripening and later harvest dates than in recent years, particularly for the Willcox AVA. In case you missed it in the issue last month, we’ll repost what the Australian Wine Research Institute has for resources on flooding and wet vintages.
View more NOAA ACIS climate maps
View more-detailed regional maps and station summaries of monsoon rainfall
The Outlook for September Temperature and Precipitation
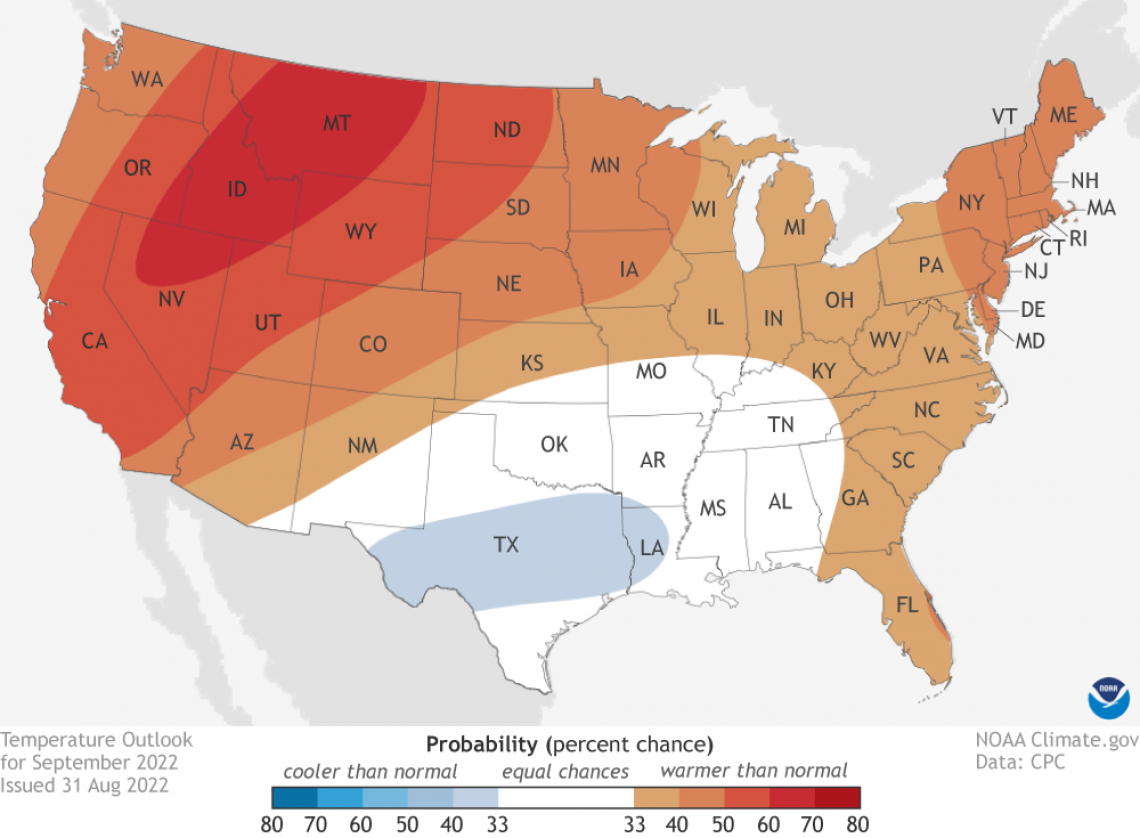
Temperatures over the course of this month have a slight increase in chances for being above the 1991-2020 normal across most of Arizona (light orange and orange areas on map). For extreme southeastern Arizona, expectations instead are equal chances for below-, near-, or above-normal temperatures (white area on map). Monthly temperatures in September last year were within 2 °F of normal for the southern two-thirds of the state, and 2 to 4 °F above normal for the northern third.
2022-sep-temp-outlook-noaa-cpc.png
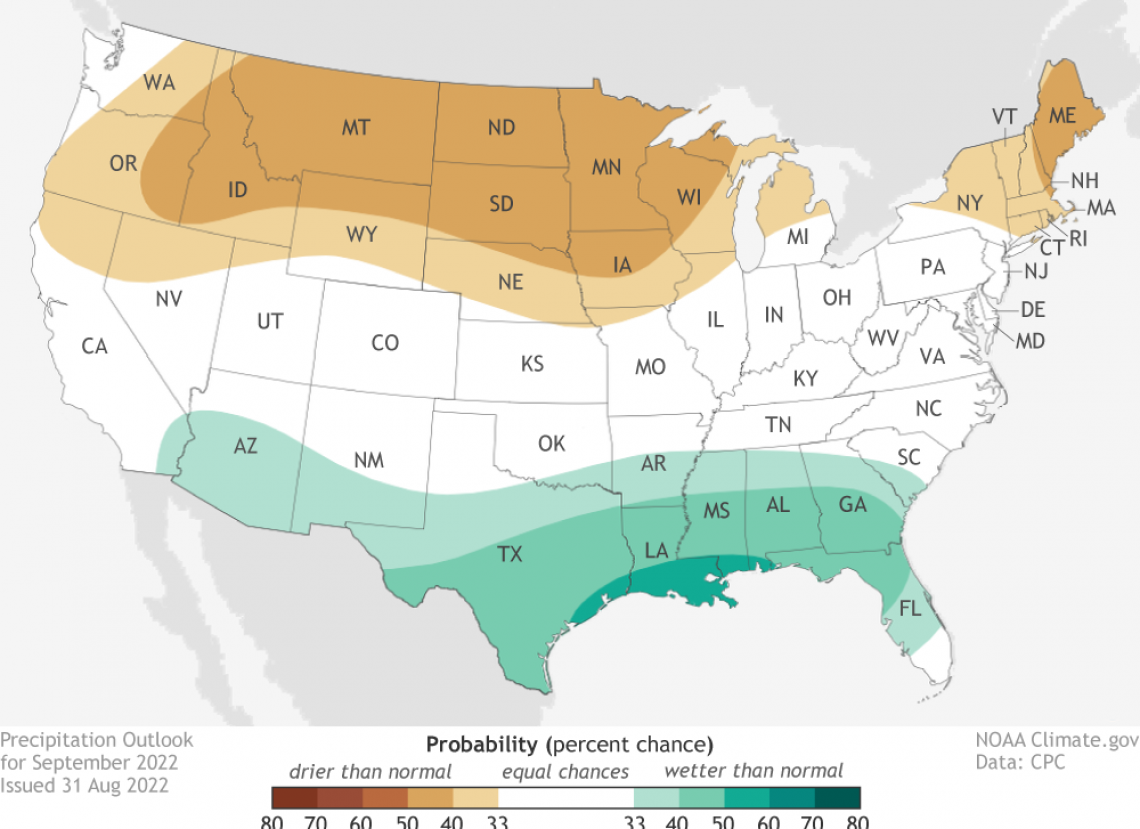
Precipitation totals for this month have a slight increase in chances for being above the 1991-2020 normal across the southern two-thirds of the state (light aqua area on map). For the northern third, there are equal chances for below-, near-, or above-normal amounts (white area on map). Precipitation during September 2021 generally was near normal for much of Arizona. There were, however, a few locations like the northern half of the Willcox AVA where totals were above 150 % of normal with amounts close to 2 inches.
There are many moving parts during late summer and early autumn when it comes to climate and viticulture in Arizona. The latter half of the ripening and harvest season coincides with the winding down of the monsoon and the potential ramping up of chances - next week, for example - for rainfall originating from tropical cyclones along the western coast of Mexico. Add to this possible post-harvest activities of irrigation, addition of fertilizer, and establishment of cover crops. Please get in touch if you’d like to discuss the climate outlook information below as this growing season heads towards its latter stages.
Read more about the September 2022 temperature and precipitation outlook
To stay informed of long-range temperature and precipitation possibilities beyond the coverage of a standard weather forecast, check in, too, with the six-to-ten-day outlook and eight-to-fourteen-day outlook issued daily by NOAA’s Climate Prediction Center.
2022-sep-prcp-outlook-noaa-cpc.png
Seasonal Analogs for Arizona AVAs
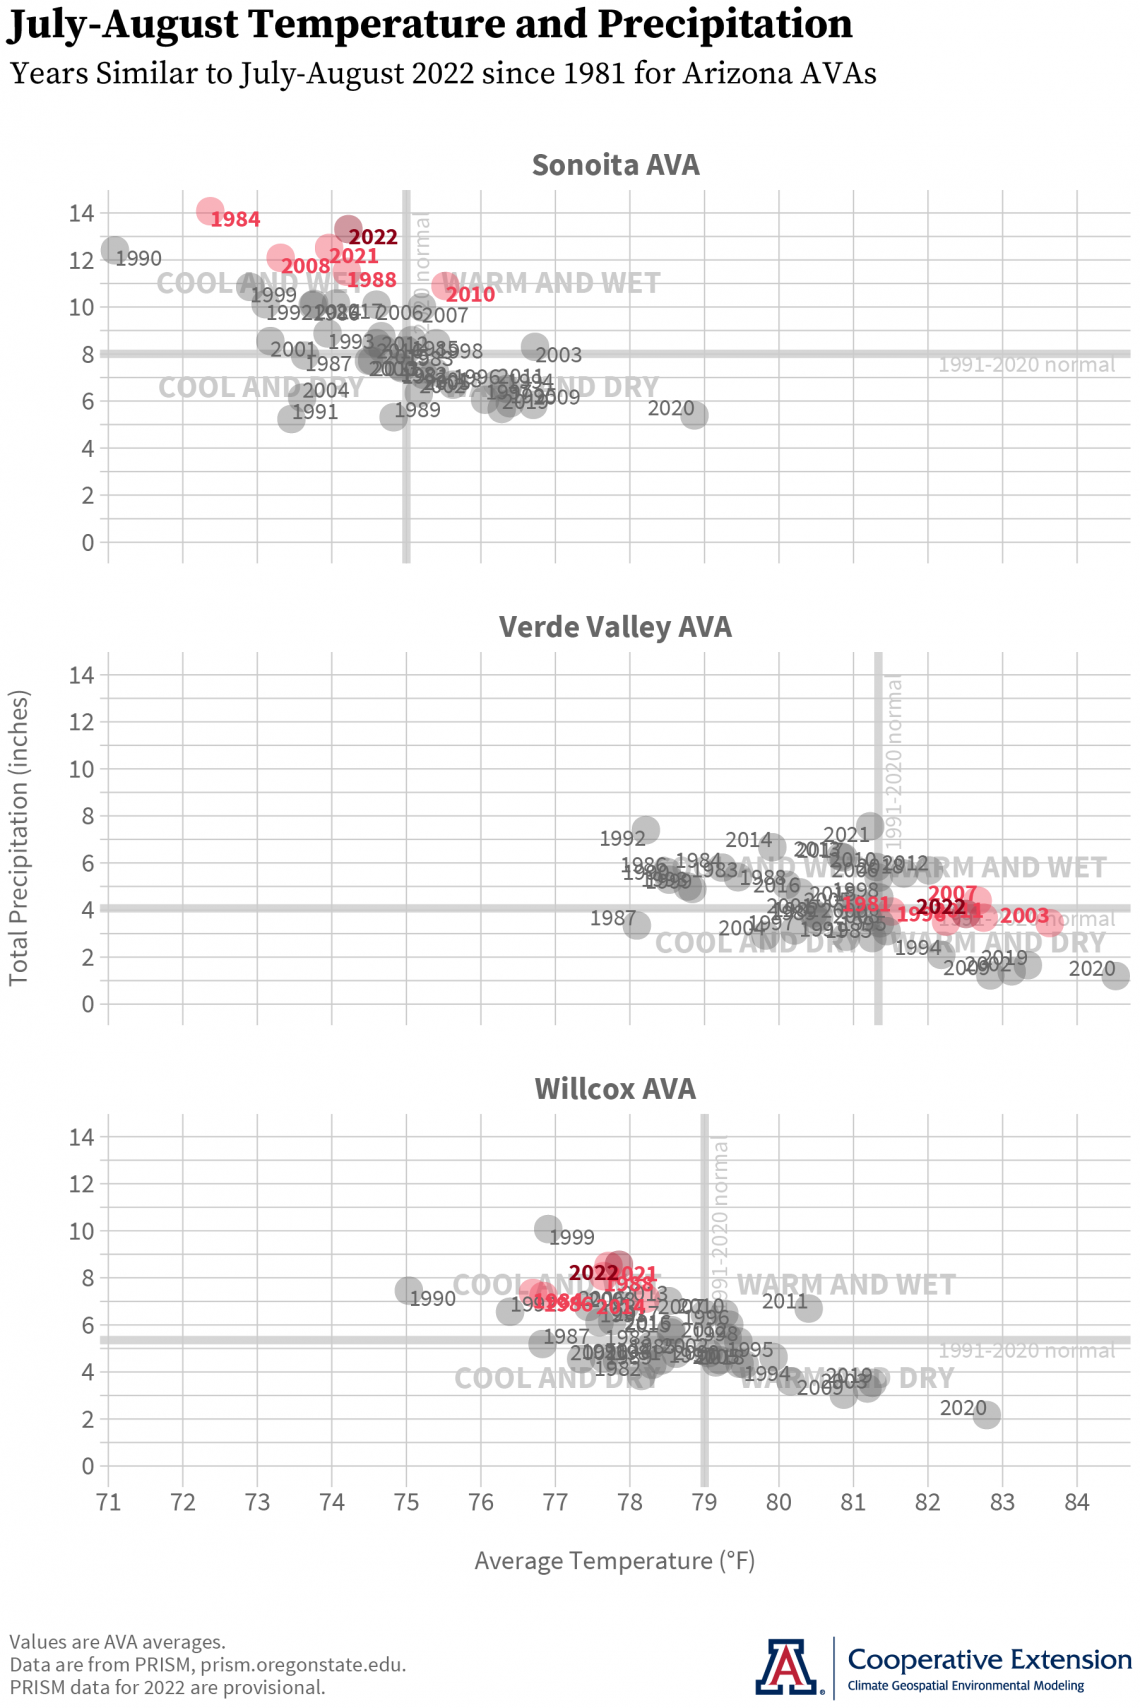
We continue the focus of this topic this month on the July-through-October time frame, the time of the year when the climatic differences between the three Arizona AVAs really start to show.
Combining data from July and August, both the Sonoita and Willcox AVAs are about 1 °F below and 150 % above their respective temperature and precipitation normals during this time frame (dark red dots and thick gray vertical and horizontal lines, respectively). This corresponds to a two-month average temperature of 74.2 °F and precipitation total of 13.3 inches for the Sonoita AVA, and 77.9 °F and 8.6 inches for the Willcox AVA. In some contrast, the Verde Valley AVA is about 1 °F above normal with near-normal precipitation, at 82.5 °F and 3.8 inches.
Given these conditions, the closest analog years for the July-August period in 2022 (light red dots) are:
2021, 2008, 1988, 1984, 2010 for the Sonoita AVA
2011, 1996, 2007, 1981, 2003 for the Verde Valley AVA
2021, 1988, 2014, 1984, 1986 for the Willcox AVA
Apart from 2021 for the Sonoita and Willcox AVAs, there is a lack of recent growing seasons again this month in the above lists. If you’re a relatively new wine grape grower in the state, we’ll also point out 2016 and 2017 for the Sonoita and Willcox AVAs and both 2015 and 2018 for the Verde Valley AVA as far as July-August conditions from the past few years that were generally similar to those in 2022.
cvn-202209-ava-analogs-2022-09-02.png
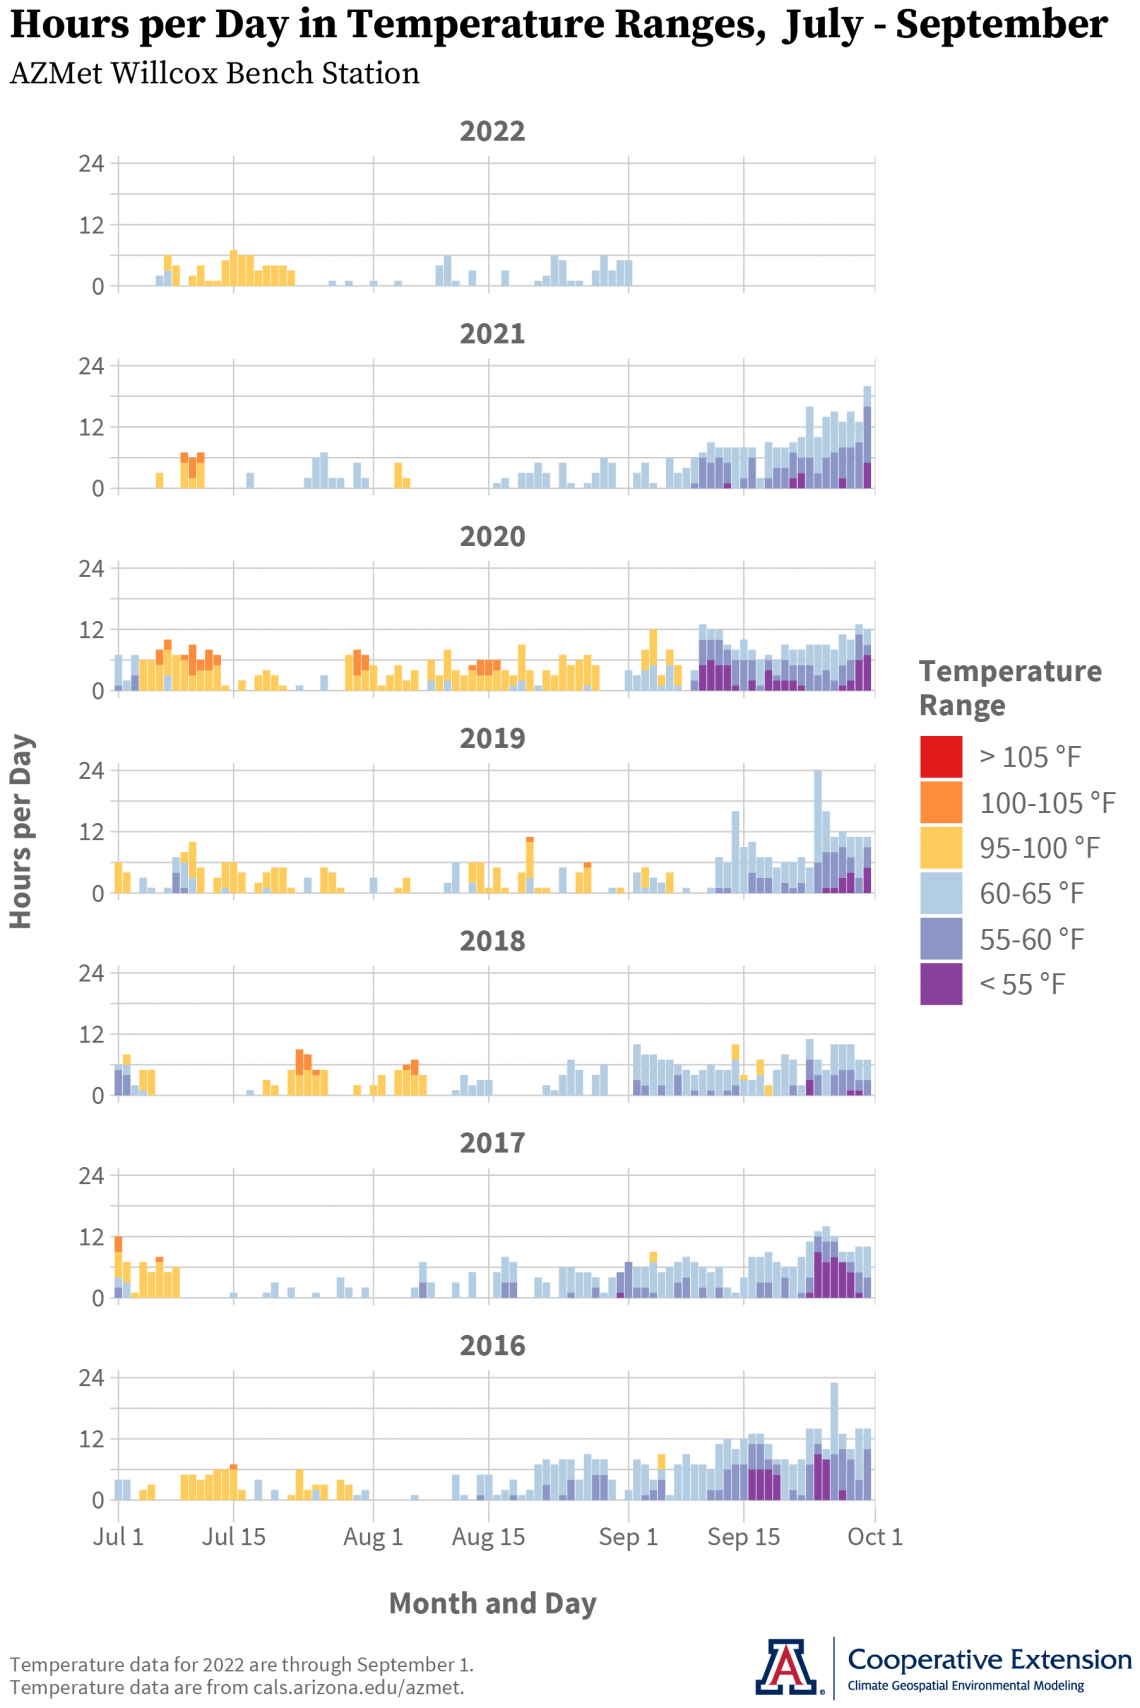
Temperature Ranges and the Ripening Period
Based on data from the AZMet Willcox Bench station in the Willcox AVA, the amount of time that fruit has been exposed to temperatures below 65 °F and above 95 °F since July 1 this year continues to be similar to that from 2016. August conditions additionally suggest 2017 and 2021 as similar years. The general pattern these years share is time with temperatures between 95 and 100 °F (yellow bars on graph) during July and between 60 and 65 °F (light blue bars on graph) during August. These years also may share similar degrees to which these temperature ranges influence fruit quality, through both early morning minimums and afternoon maximums.
Another aspect these years share is a lack of hours with temperatures above 100 °F (orange bars on graph) during July and August. This contrasts especially with the record-hot conditions during 2020, when temperatures over this threshold occurred for several hours. Also notable during 2020 was the relative absence of hours below 65 °F.
While the relatively cooler minimum temperatures this year may help fruit retain acidity and have a lower pH as less malic acid is metabolized during respiration, the above-average rainfall may not. As noted last month, our initial analyses of Arizona Vignerons Alliance data between 2009 and 2018 for the three Arizona AVAs suggest that greater precipitation appears to correlate with higher pH values. One thing we’ll look for as we continue to work on this project funded by the Arizona Department of Agriculture is which varieties maintain pH regardless of total rainfall during the ripening season.
University of Arizona Cooperative Extension and the Tucson forecast office of the National Weather Service are leading a workshop on weather and climate information for agriculture and natural resources management. Topics and discussion will include a monsoon recap, overview of current drought conditions, climate outlooks for fall and winter, current forecast tools for frosts and freezes, and an update on the Arizona Meteorological Network (AZMet). This in-person and remote-format workshop will be on October 5 in the Willcox area. Please save the date. Registration information and further details are coming soon.
The active monsoon this year continues to improve drought conditions for some areas in Arizona and to curb wildland fire conditions in the state. There is a normal potential this month for significant wildland fires for all of Arizona.
A rare La Niña three-peat this coming fall and winter continues to be possible. There is a 60 % chance that still-current La Niña conditions will persist through September, and a 62 to 66 % chance that they continue through fall and into early winter 2022. This is the most recent official forecast for ENSO, or El Niño Southern Oscillation, parts of the atmosphere and ocean across the tropical Pacific Ocean that cause El Niño and La Niña events.
For those of you in southeastern Arizona, including the Sonoita and Willcox AVAs, Cooperative Extension manages an email listserv in coordination with the Tucson forecast office of the National Weather Service to provide information in the days leading up to agriculturally important events, like severe monsoon storms and rainfall from tropical cyclones. Please contact us if you'd like to sign up.
And for those of you in north-central and northeastern Arizona, including the Verde Valley AVA, Cooperative Extension also now manages an email listserv in coordination with the Flagstaff forecast office of the National Weather Service to provide similar information for this part of the state. Please contact us if you'd like to sign up.
Undergraduate students in the College of Agriculture and Life Sciences at the University of Arizona are looking for internships with businesses and companies in the viticulture and winery industries during 2022. Please contact Danielle Buhrow, Senior Academic Advisor and Graduate Program Coordinator in the Department of Agricultural and Resource Economics, for more information.
Please feel free to give us feedback on this issue of the Climate Viticulture Newsletter, suggestions on what to include more or less often, and ideas for new topics.
Did someone forward you this newsletter? Please contact us to subscribe.
Have a wonderful September!
With current and past support from:

