
Climate Viticulture Newsletter - 2023 February
< Back to Climate Viticulture Newsletter
Hello, everyone!
This is the February 2023 issue of the Climate Viticulture Newsletter – a quick look at some timely climate topics relevant to wine grape growing in Arizona.
January Recap | February Outlook | Ripening and Harvest Conditions | Extra Notes
A Recap of January Temperature and Precipitation
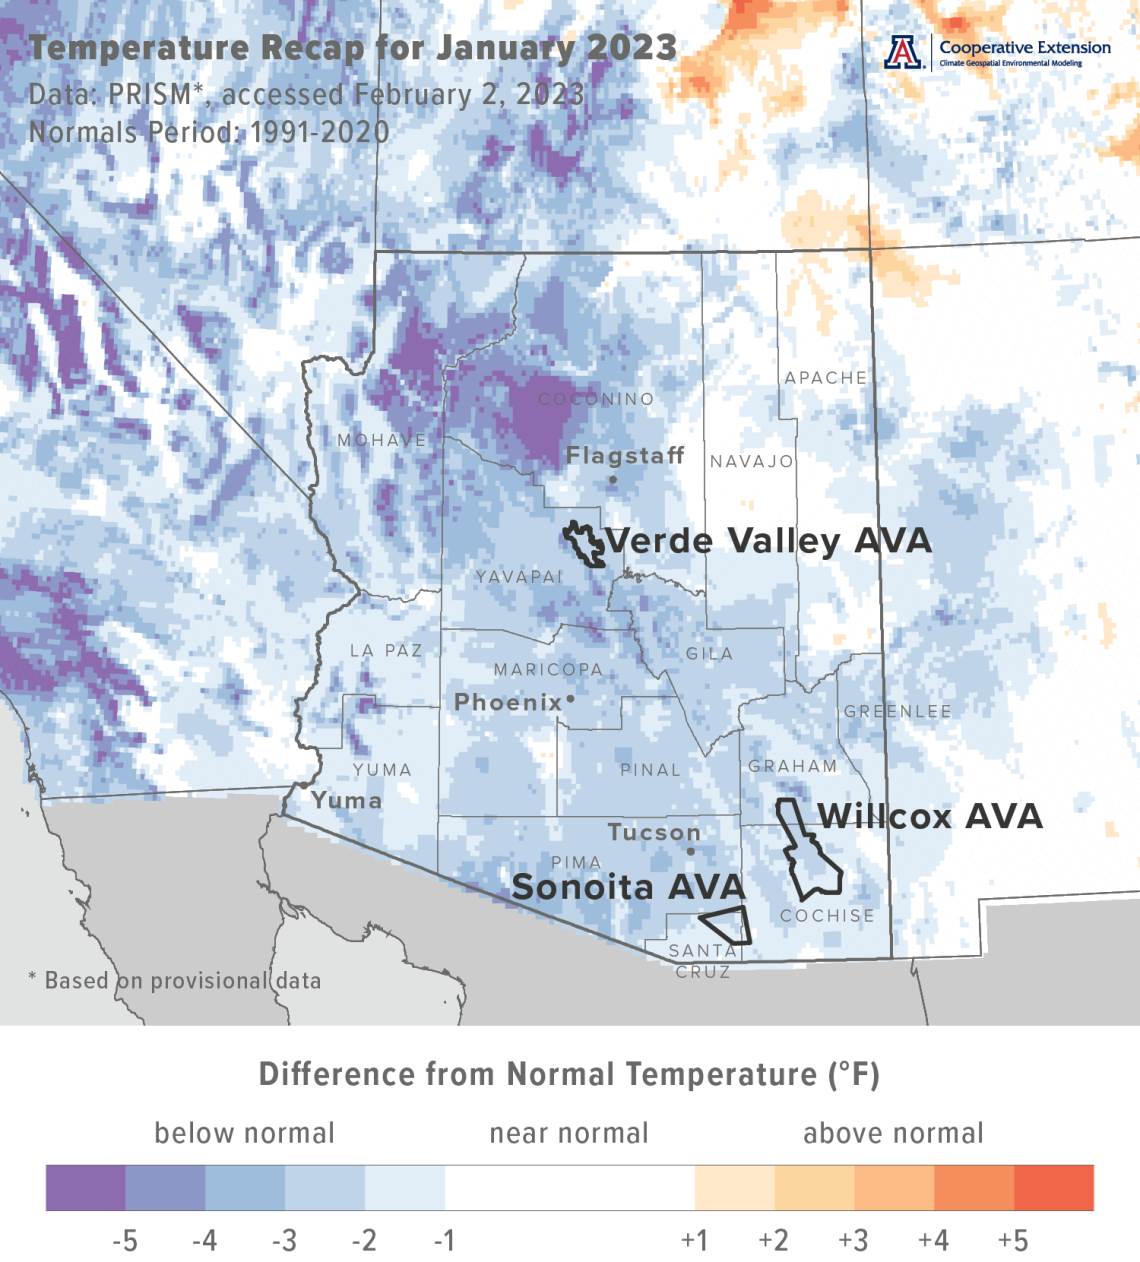
Monthly average temperatures were 1 to 4 °F below the 1991-2020 normal for much of the state (light blue and blue areas on map), including all three of the Arizona AVAs. Parts of northwestern Arizona were more than 4 °F below normal (dark blue and purple areas on map), whereas others in northeastern Arizona were near normal (white areas on map). For reference, monthly temperatures in January last year were within 2 °F of normal for much of the state.
Area-average maximum and minimum temperatures during January 2023 were 56.1 and 30.2 °F for the Sonoita AVA, 52.4 and 30.9 °F for the Verde Valley AVA, and 57.0 and 28.8 °F for the Willcox AVA. Respective January normals are 58.7 and 31.2 °F, 58.1 and 30.6 °F, and 59.6 and 30.2 °F.
cvn-recap-figure-tmeanDepartureNormal.png
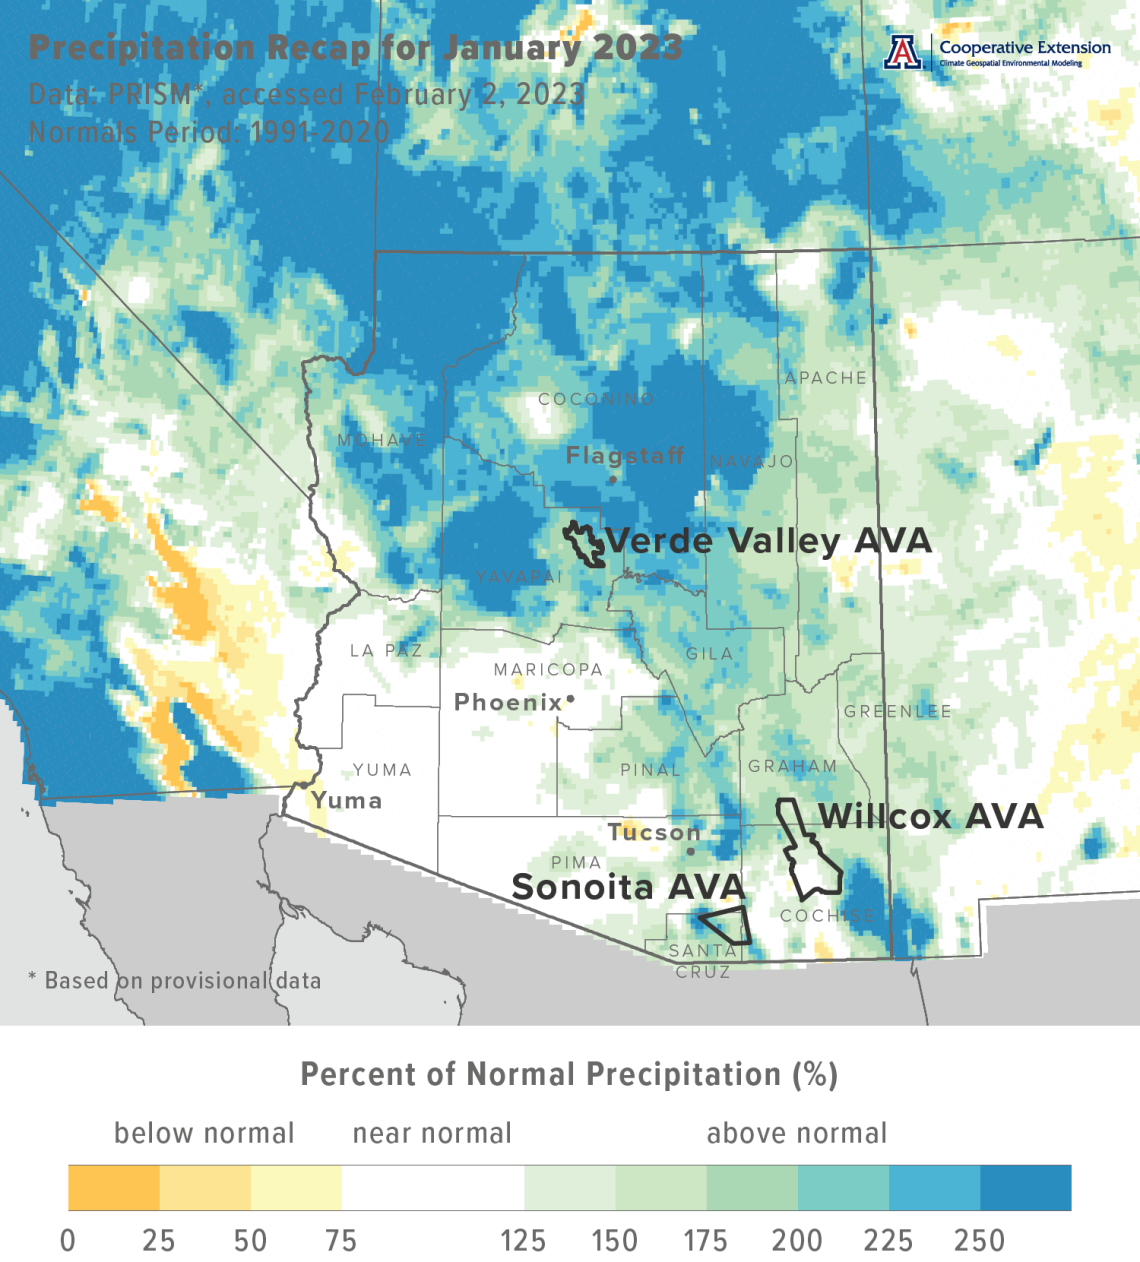
Monthly precipitation totals were more than 150 % of normal for much of the northern and eastern halves of the state (aqua and blue areas on map), including the Sonoita and Verde Valley AVAs and part of the Willcox AVA. Some areas, particularly in northern Arizona, received more than 250 % of normal precipitation (dark blue areas on map). Otherwise in the state, monthly totals were near normal (white areas on map). Precipitation during January 2022 was less than 50 % of normal for much of Arizona.
Area-average total precipitation in January 2023 was 2.35 inches for the Sonoita AVA, 2.90 inches for the Verde Valley AVA, and 1.53 inches for the Willcox AVA. Respective January normals are 1.24, 1.45, and 1.07 inches.
Based on the daily weather summaries since November for the AZMet Bonita and Willcox Bench stations in the Willcox AVA, precipitation last month brings dormant-season totals at these locations to 2.9 and 2.18 inches, respectively. Total reference evapotranspiration during the November-January period nonetheless remains higher, with respective values of 6.9 and 7.2 inches, still illustrating a need for attention to winter irrigation.
Dig into daily weather summaries from 2023 for the AZMet Bonita and Willcox Bench stations in the Willcox AVA
Learn more about PRISM climate data
cvn-recap-figure-pptPercentNormal.png
The Outlook for February Temperature and Precipitation
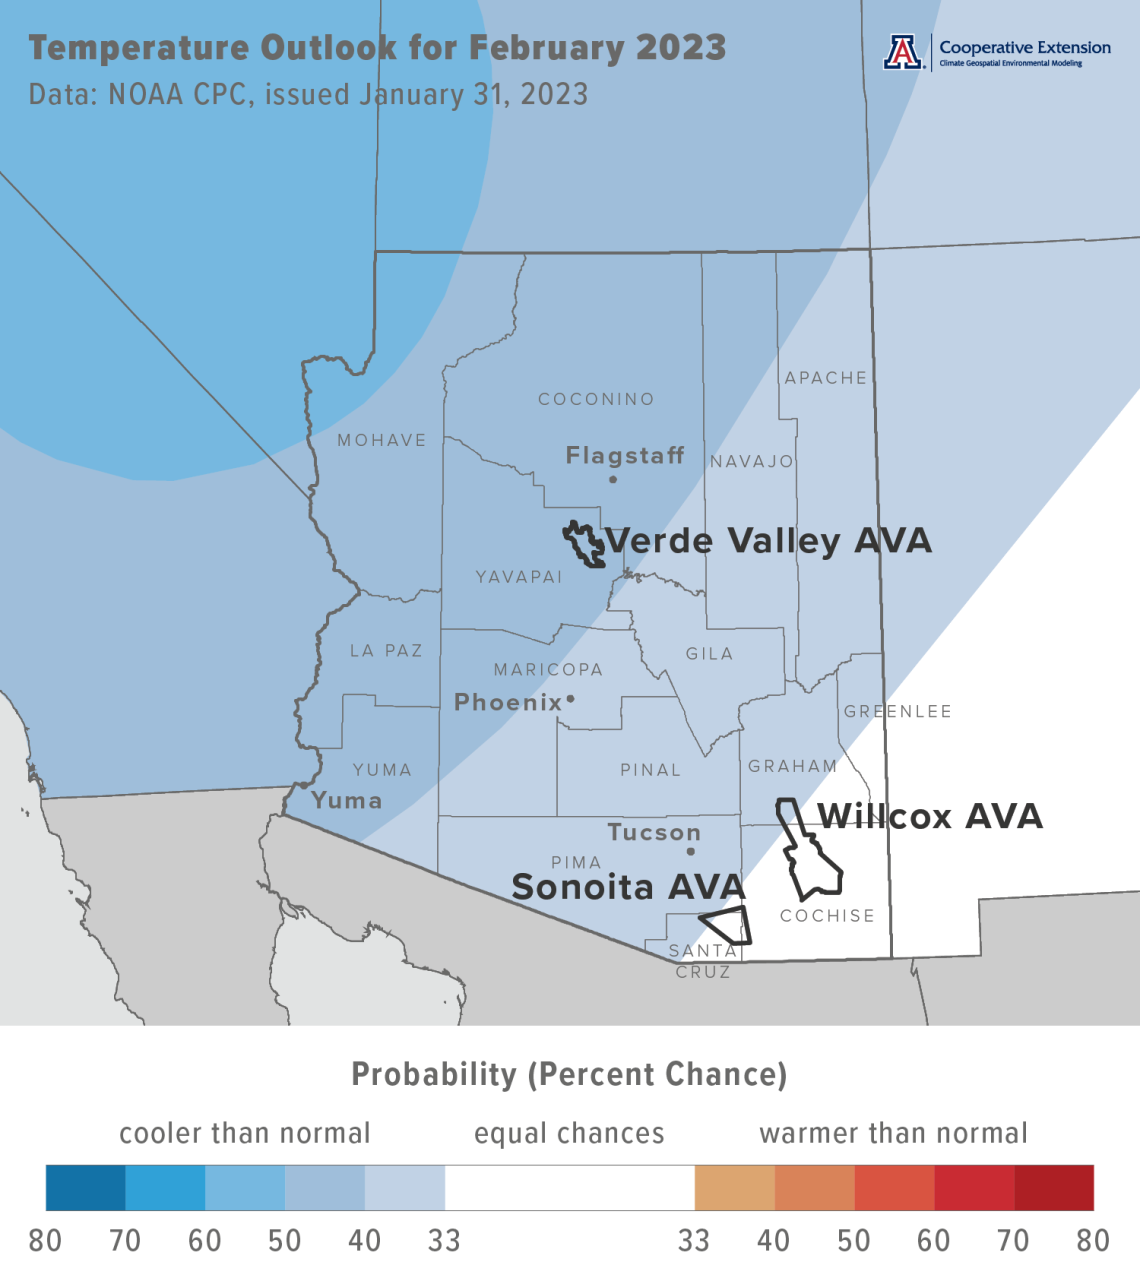
Temperatures over the course of this month have a slight increase in chances for being below the 1991-2020 normal across all but the northwestern and southeastern corners of the state (light blue and blue areas on map). In northwestern Arizona, there is a moderate increase in chances for below-normal temperatures (dark blue area on map). In southeastern Arizona, there are equal chances for below-, near-, or above-normal temperatures (white area on map). Monthly temperatures in February last year were within 2 °F of normal for the western half of the state and 2 to 6 °F below normal for the eastern half.
Area-average maximum and minimum temperatures during February 2022 were 60.1 and 27.6 °F for the Sonoita AVA, 63.2 and 29.3 °F for the Verde Valley AVA, and 61.9 and 26.5 °F for the Willcox AVA. Respective February normals are 61.2 and 33.2 °F, 61.6 and 32.9 °F, and 63.1 and 32.7 °F.
cvn-outlook-202302-temp.png
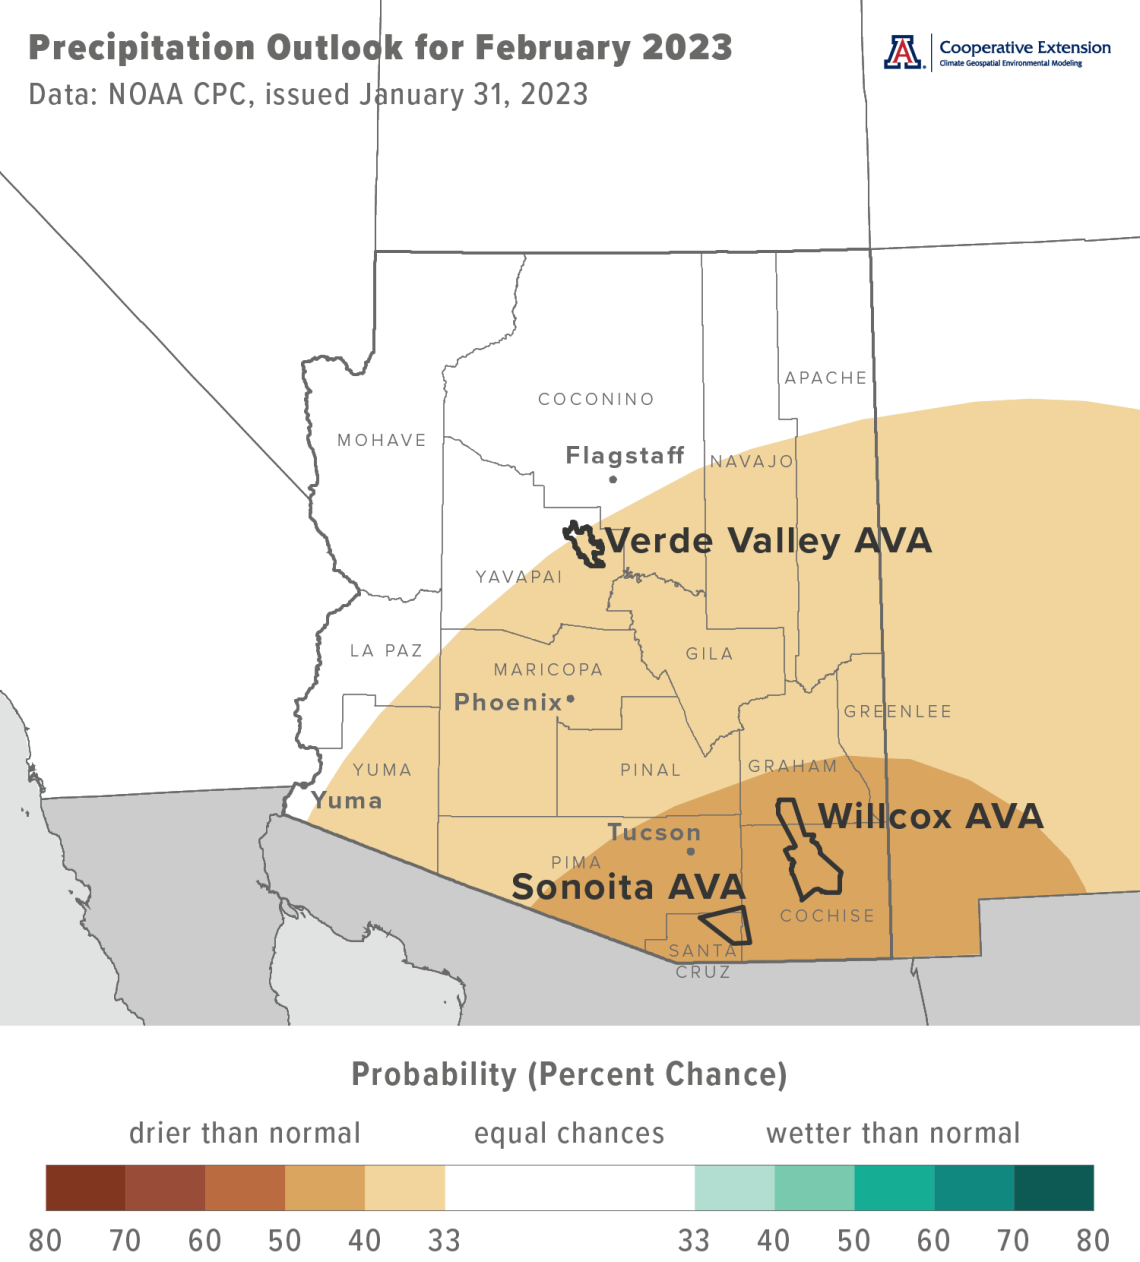
Precipitation totals for this month have a slight increase in chances for being below normal across much of southern, central, and eastern Arizona (light tan and tan areas on map). For the rest of the state, there are equal chances for below-, near-, or above-normal totals (white area on map). Precipitation during February 2022 was less than 50 % of normal for much of Arizona.
Area-average precipitation totals in February 2022 were 0.36 inches for the Sonoita AVA, 0.38 inches for the Verde Valley AVA, and 0.09 inches for the Willcox AVA. Respective February normals are 1.12, 1.43, and 0.93 inches.
Although the rare La Niña three-peat this winter still partly influences what we see in the monthly outlooks, it looks like the event continues to fade away. There is an 82 % chance that ENSO-neutral conditions finally reappear during the March-May period. This is the most recent official forecast for ENSO, or El Niño Southern Oscillation, parts of the atmosphere and ocean across the tropical Pacific Ocean that cause El Niño and La Niña events.
To stay informed of long-range temperature and precipitation possibilities beyond the coverage of a standard weather forecast, check in, too, with the six-to-ten-day outlook and eight-to-fourteen-day outlook issued daily by NOAA’s Climate Prediction Center.
cvn-outlook-202302-prcp.png
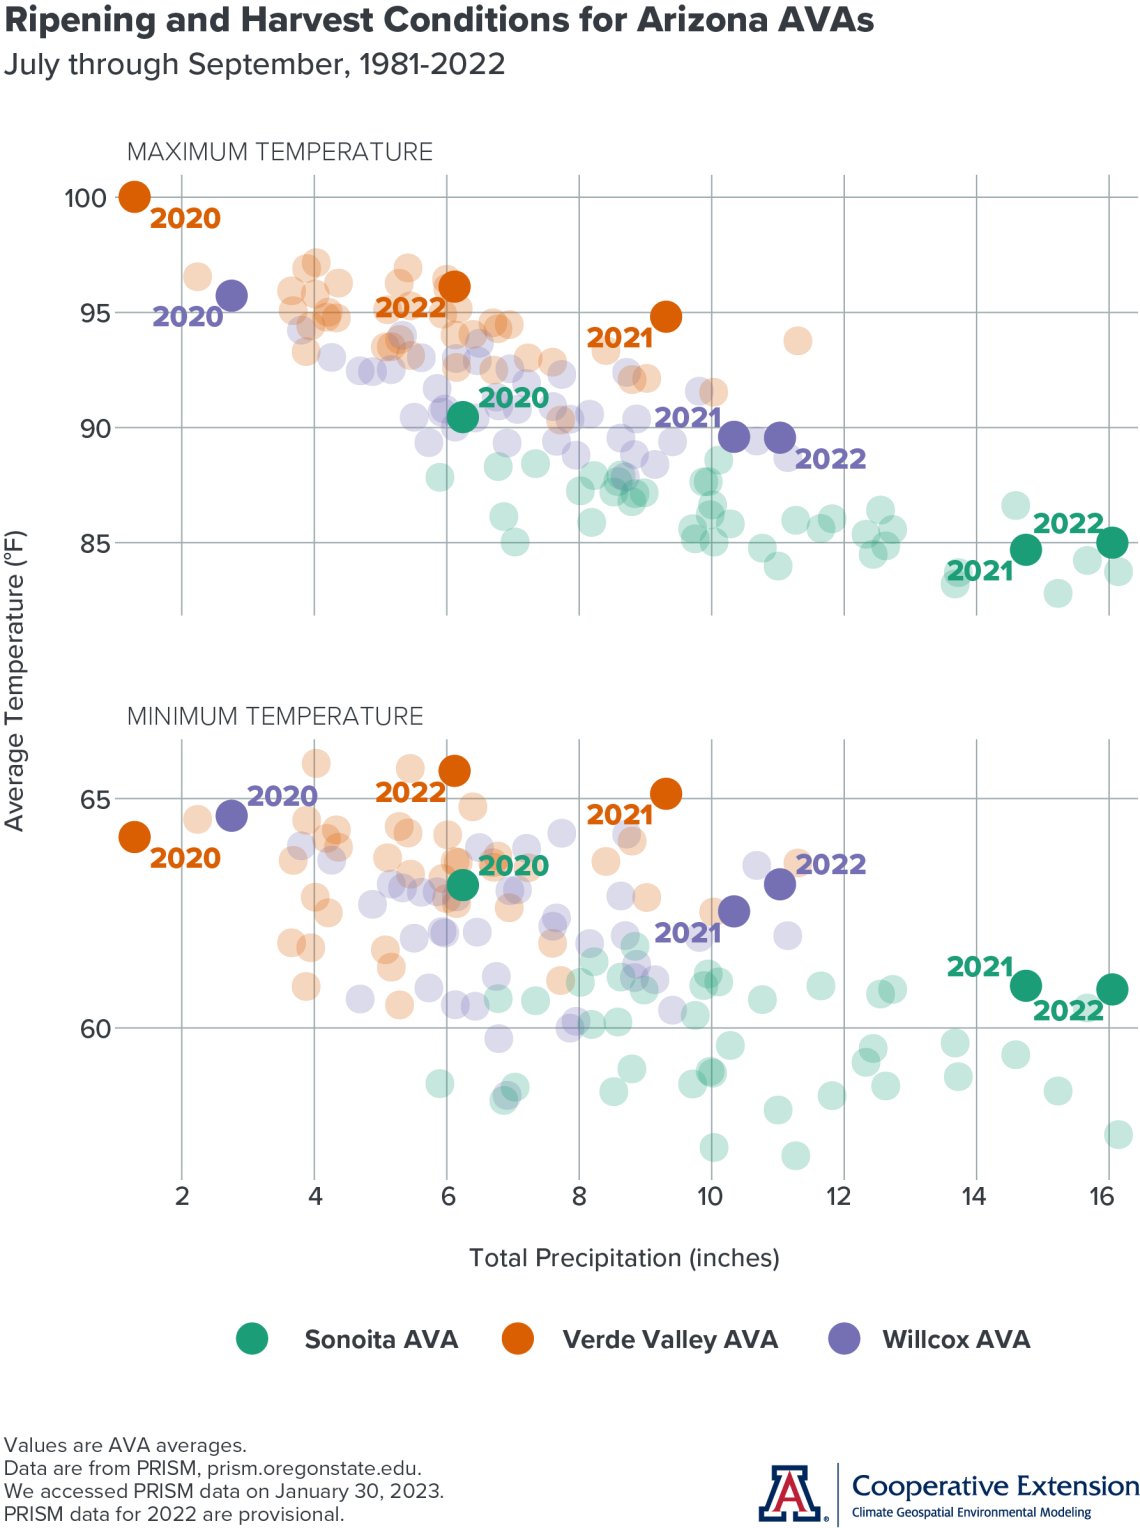
A Review of Ripening and Harvest Conditions for Arizona AVAs
We decided this month to dig more into past conditions during what we’ve been referring to as the ripening and harvest season, that is, the months of July, August, and September. Our goal is to better characterize temperature and precipitation during this three-month period over past years and see if their values, and how they vary from year to year, correspond to values and variations in aspects of fruit composition like sugar levels and pH at harvest. If you’ve been following along in past newsletter issues, you’ll easily recognize this as part of our project funded by the Arizona Department of Agriculture to look at the effects of Arizona climate on wine grape composition.
Before we get into the data, here’s how we built the figure that we’ll discuss here. Temperature is along the vertical axis, with cooler values towards the bottom and warmer values towards the top. We split temperature into maximum and minimum values (upper and lower graphs, respectively). Precipitation is along the horizontal axis, with lower totals towards the left and higher totals towards the right. Although we show data from 1981 through 2022, we put extra attention on the past three vintages, 2020, 2021, and 2022 (non-transparent points on graphs). Data for the years from 1981 through 2019 (semi-transparent points on graphs) provide additional context, as does the color coding of data from all years. Colors represent the Sonoita AVA (green points on graphs), the Verde Valley AVA (orange points on graphs), and the Willcox AVA (purple points on graphs). Values are seasonal averages for maximum and minimum temperature, and seasonal totals for precipitation.
Getting into the data, one might think that we misplaced the points for 2020 on both the maximum and minimum temperature graphs. It’s as though conditions that year made the Sonoita AVA like the Willcox AVA (green non-transparent point in purple semi-transparent points), the Willcox AVA like the Verde Valley AVA (purple non-transparent point in orange semi-transparent points), and the Verde Valley AVA like nothing the Arizona AVAs had experienced up until then, at least since 1981 (orange non-transparent point outside of the range of all other points). That’s apparently what record-hot and record-dry conditions do to state viticulture.
In contrast, data points for 2021 and 2022 are at the opposite end of the ranges for total precipitation (non-transparent points towards the far right of their respective AVA ranges). This is due to the near-record to record rainfall that many locations experienced in each of those two years. The only exception to this was near-normal total precipitation last year for the Verde Valley AVA, as noted last month in the second part of our growing season review. These two years also posted maximum and minimum temperatures near or above the 1991-2020 normal for the Verde Valley AVA, as noted in the first part of our growing season review. Temperature values were near or below normal for the Sonoita and Willcox AVAs.
One could argue that the sequence of conditions during 2020, 2021, and 2022 qualifies as ‘weather whiplash’, a phrase used to describe a quick change from one set of extremes to an opposite set. For Arizona viticulture, we see this as an opportunity for vineyards and wineries to evaluate how well varieties performed under these different extremes, something perhaps valuable when it comes to variety viability and the expectation for a more variable and extreme summer climate in the coming years.
Data for the years from 1981 through 2019 provide other insights into how ripening and harvest conditions compare between the three Arizona AVAs. We’ve touched upon these in previous newsletter issues, general take-aways like the Verde Valley AVA being warmer and drier than the Willcox AVA, which is warmer and drier than the Sonoita AVA, and like the correlation between wetter conditions and cooler maximum temperatures (upper graph). Any correlation between wetter conditions and minimum temperatures is much less pronounced (lower graph), and due in part to the cloud cover and higher humidity from wetter conditions not allowing temperatures to drop as much overnight. Seeing this made us think more about what the monsoon does to diurnal temperature ranges, something often tied to fruit composition in winegrowing media. It also made us put analysis of diurnal temperature range, and the comparison of it to relevant temperature thresholds, on our list of future newsletter topics.
cvn-ripening-season-review-2023-01-31.png
Extra Notes
Attention all growers, viticulturists, and vineyard owners! University of Arizona Cooperative Extension is conducting a Statewide Viticulture Needs Assessment and needs your help. Topics will include production, irrigation management, soil fertility, and management of pests, pathogens, and disease, among others. Your anonymous feedback is essential and will inform Cooperative Extension as to how it can best serve the wine grape industry. Please click here to access the survey, and contact Matt Halldorson, Yavapai County Director and Associate Agent in Agriculture and Natural Resources with Cooperative Extension, with any questions.
Be sure to mark down March 6th and 7th this year for the Arizona Viticulture Strategic Planning Summit at Biosphere 2 in Oracle. In collaboration with Designing Arizona Signatures and Visit Southern Arizona, University of Arizona Cooperative Extension invites you to the two-day event to help detail and expand research and extension plans for the industry, including a potential research center for state wine grape growers. The keynote speaker will be Dr. Markus Keller from Washington State University. Registration and lodging details will be announced soon. Please contact Joshua Sherman, Associate Area Agent in Commercial Horticulture with Cooperative Extension, with any questions.
For those of you in southeastern Arizona, including the Sonoita and Willcox AVAs, Cooperative Extension manages an email listserv in coordination with the Tucson forecast office of the National Weather Service to provide information in the days leading up to agriculturally important events, like cold-air outbreaks and the occasional winter storm. Please contact us if you'd like to sign up.
And for those of you in north-central and northeastern Arizona, including the Verde Valley AVA, Cooperative Extension also now manages an email listserv in coordination with the Flagstaff forecast office of the National Weather Service to provide similar information for this part of the state. Please contact us if you'd like to sign up.
Undergraduate students in the College of Agriculture and Life Sciences at the University of Arizona are looking for internships with businesses and companies in the viticulture and winery industries. Please contact Danielle Buhrow, Senior Academic Advisor and Graduate Program Coordinator in the Department of Agricultural and Resource Economics, for more information.
Please feel free to give us feedback on this issue of the Climate Viticulture Newsletter, suggestions on what to include more or less often, and ideas for new topics.
Did someone forward you this newsletter? Please contact us to subscribe.
Have a wonderful February!
With current and past support from:

