
Climate Viticulture Newsletter - 2023 May
< Back to Climate Viticulture Newsletter
Hello, everyone!
This is the May 2023 issue of the Climate Viticulture Newsletter – a quick look at some timely climate topics relevant to wine grape growing in Arizona.
April Recap | May Outlook | Start of the Growing Season | April Freezes | Growing Season Heat Accumulation | Extra Notes
A Recap of April Temperature and Precipitation
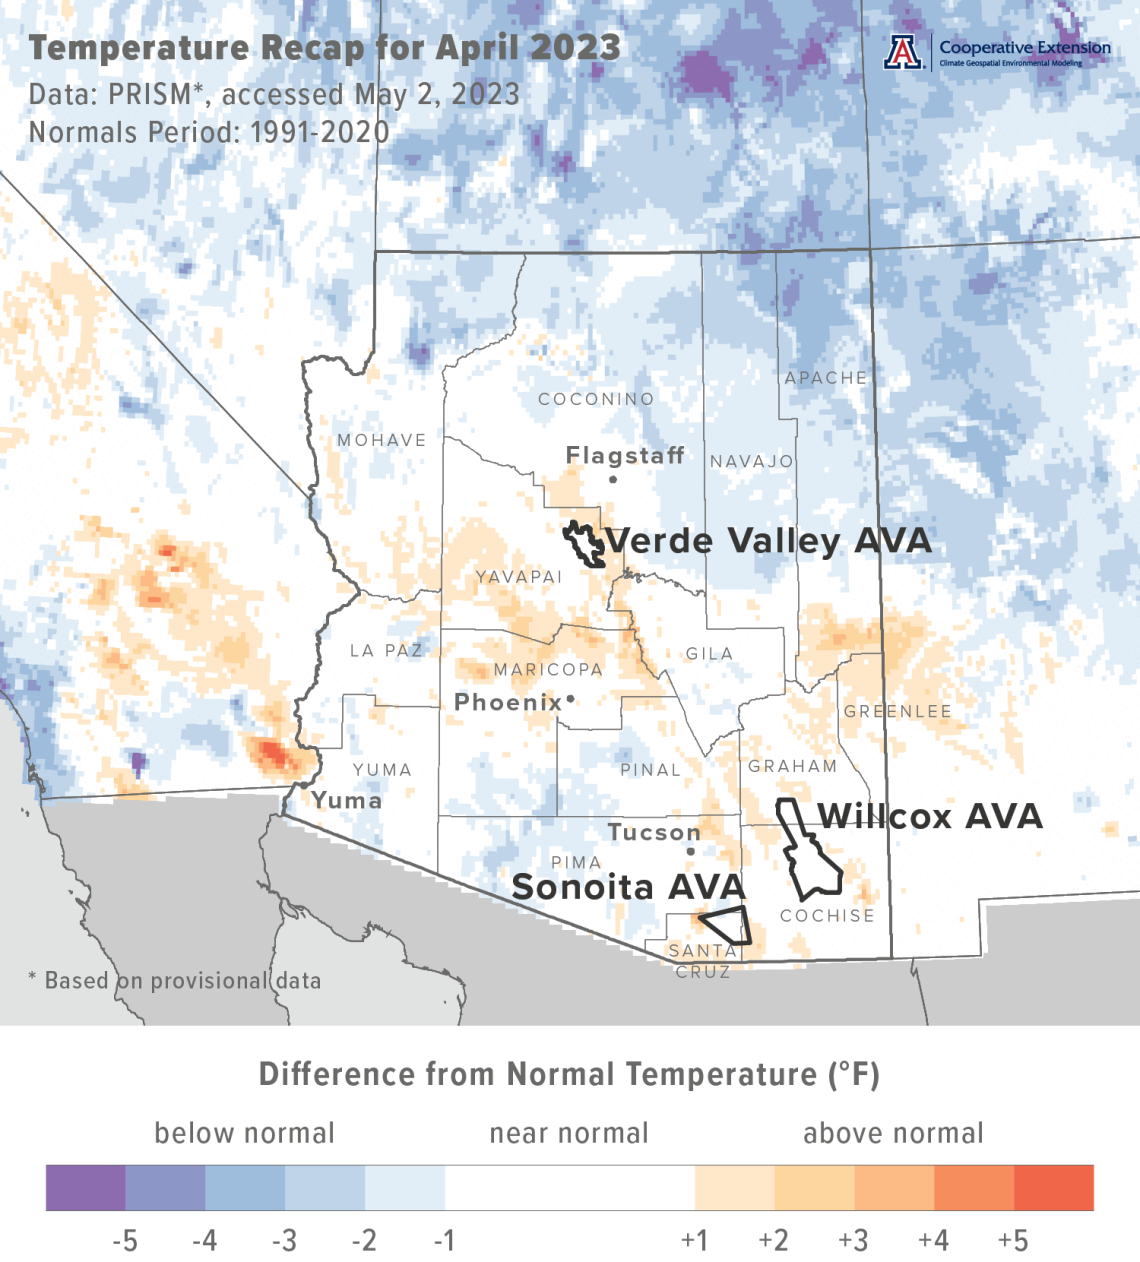
Monthly average temperatures were within 2 °F of the 1991-2020 normal for almost all of Arizona (light blue, white, and light orange areas on map), including all three Arizona AVAs. Areas along the state’s northern border were among the few that differed from this, with values there 2 to 4 °F below normal (blue and dark blue areas on map). For reference, monthly temperatures in April last year were 2 to 4 °F above normal for much of the state.
Area-average maximum and minimum temperatures during April 2023 were 75.3 and 40.7 °F for the Sonoita AVA, 76.2 and 42.0 °F for the Verde Valley AVA, and 77.5 and 40.3 °F for the Willcox AVA. Respective April normals are 73.5 and 41.9 °F, 75.5 and 42.6 °F, and 76.7 and 42.0 °F.
Of course, monthly averages wash away what was perhaps the most important temperature topic during April, minimum temperatures below freezing during the first week of the month. We provide some historical context on this springtime cold snap below.
cvn-recap-202305-tmeanDepartureNormal.png
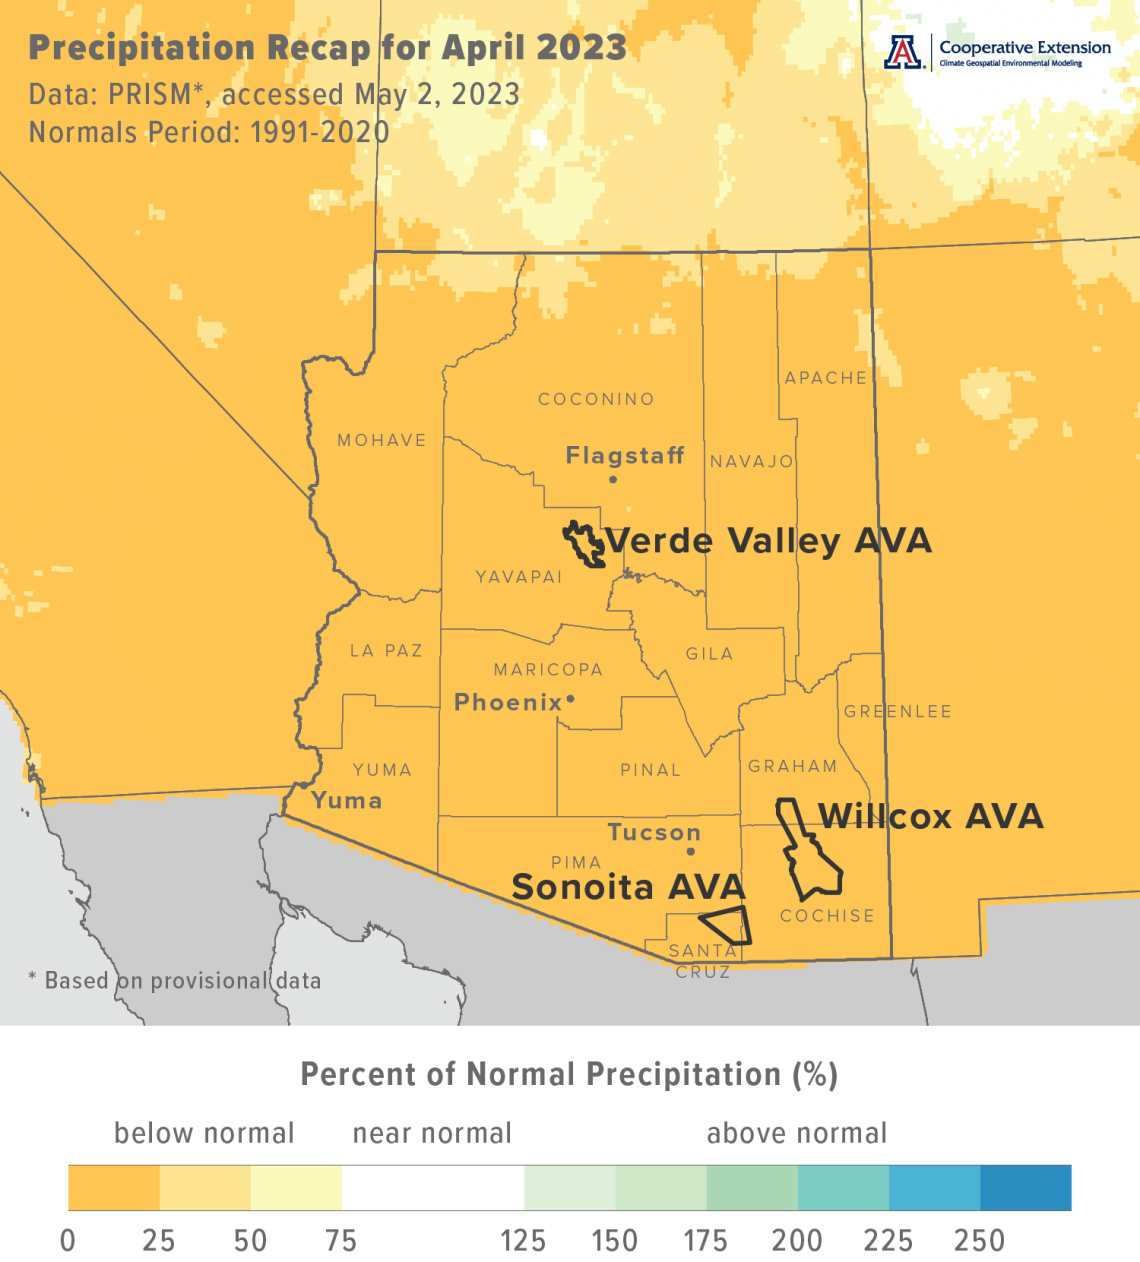
Monthly precipitation totals were below 25 % of normal for almost all of Arizona, including all three Arizona AVAs (dark yellow area on map). Only a few areas along the state’s northern border fared slightly better, with totals there 25 to 50 % of normal (yellow area on map). Precipitation during April last year also was less than 25 % of normal for almost all of Arizona.
Area-average total precipitation in April 2023 was 0.00 inches for the Sonoita AVA, 0.00 inches for the Verde Valley AVA, and 0.00 inches for the Willcox AVA. Respective April normals are 0.38, 0.55, and 0.25 inches.
Based on the daily weather summaries during April for the AZMet Bonita and Willcox Bench stations in the Willcox AVA, total reference evapotranspiration during the first month of the growing season was 6.7 and 7.1 inches, respectively. Remarkably, these amounts almost are half of what total reference evapotranspiration was during the dormant season, from November through March.
Dig into daily weather summaries from 2023 for the AZMet Bonita and Willcox Bench stations in the Willcox AVA
Learn more about PRISM climate data
cvn-recap-202305-pptPercentNormal.png
The Outlook for May Temperature and Precipitation
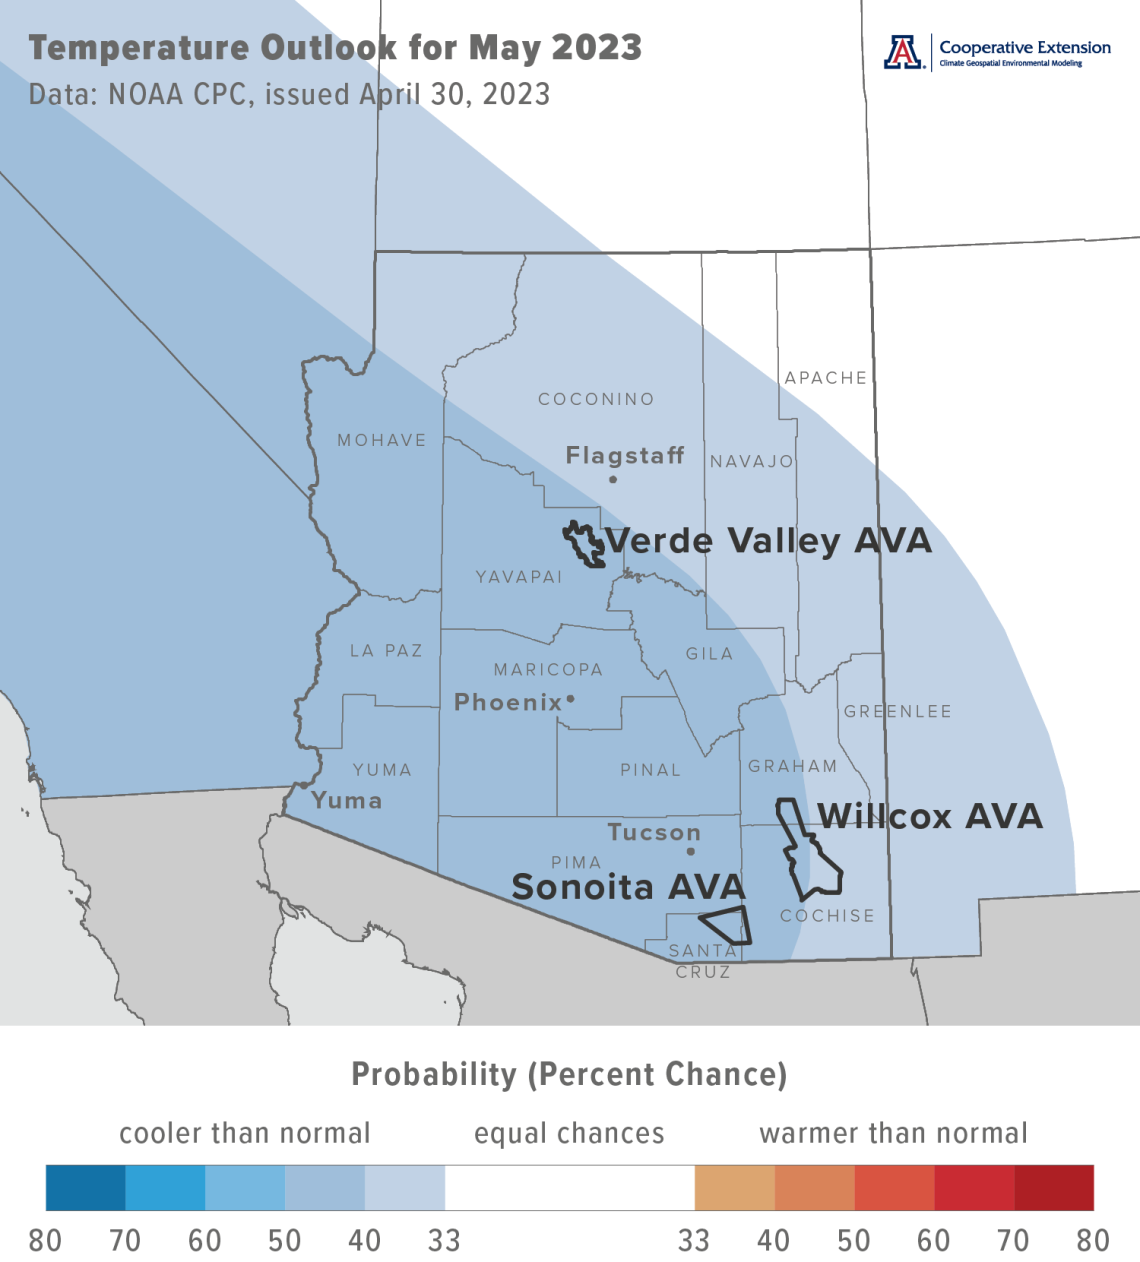
Temperatures over the course of this month have a slight increase in chances for being below the 1991-2020 normal across all but the extreme northeastern part of Arizona (light blue and blue areas on map). For the extreme northeastern part, there are equal chances for below-, near-, or above-normal temperatures (white area on map). Monthly temperatures in May last year were within 2 °F of normal for much of the western half of the state, and 2 to 4 °F above normal for much of the eastern half.
Area-average maximum and minimum temperatures during May 2022 were 85.0 and 51.2 °F for the Sonoita AVA, 88.1 and 53.1 °F for the Verde Valley AVA, and 88.2 and 50.1 °F for the Willcox AVA. Respective May normals are 81.7 and 49.6 °F, 84.5 and 50.0 °F, and 84.8 and 48.9 °F.
It is the first time since 2019 that a May outlook isn’t leaning towards warmer-than-normal monthly temperatures for the entire state. Should May this year come in cooler than the past three, one thing that vines could show is slower progress between growth stages due to less heat accumulation. We look more into growing season heat accumulation below.
cvn-outlook-202305-temp.png
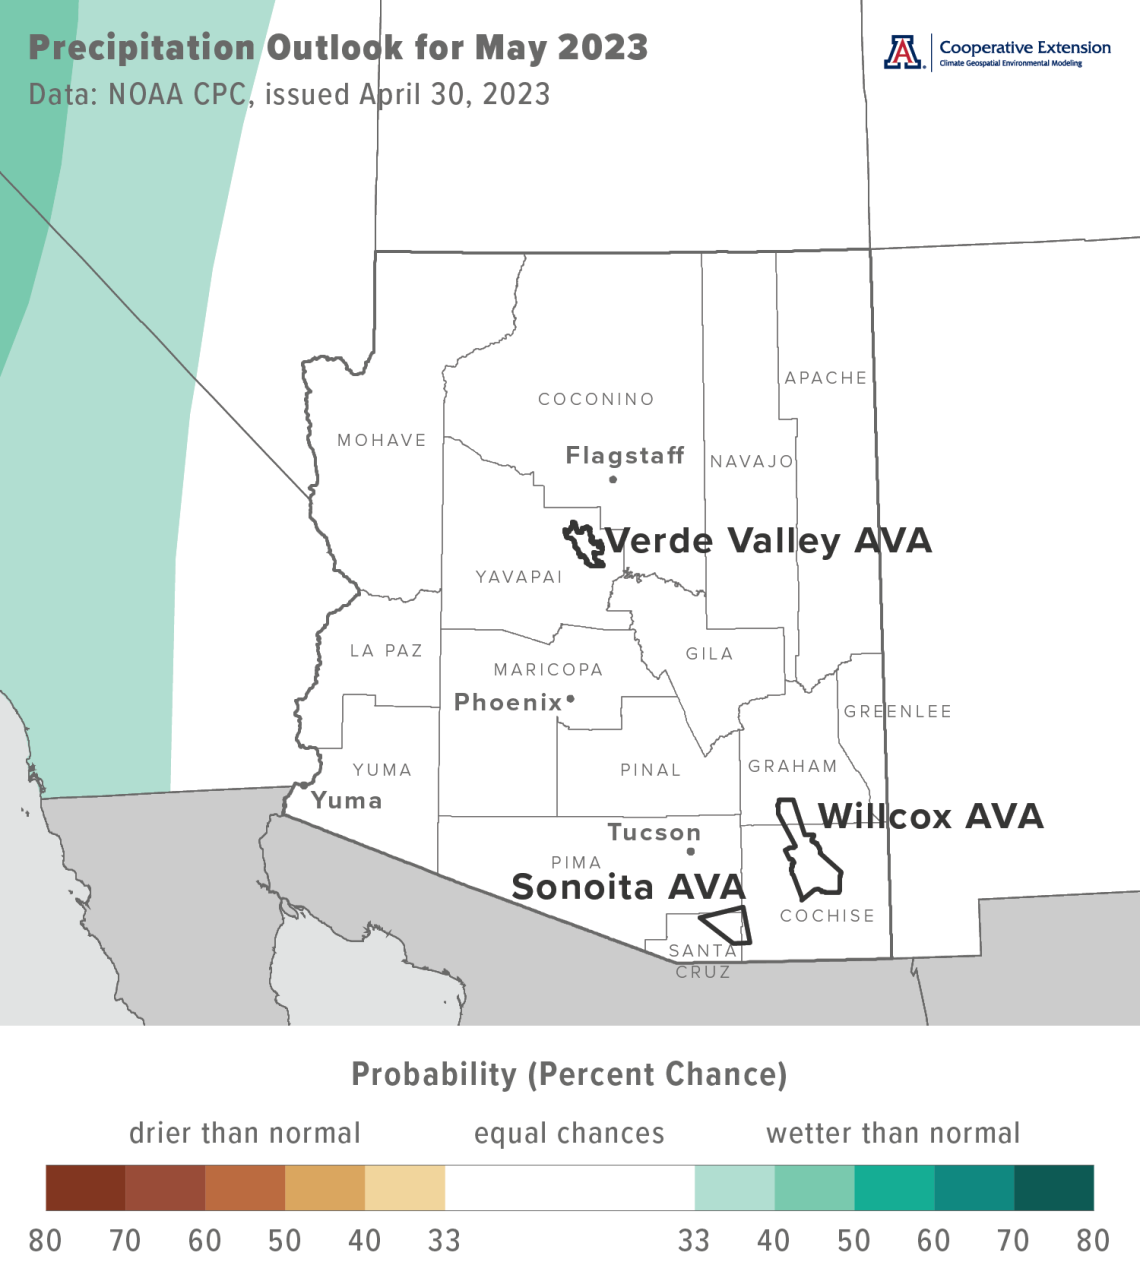
Precipitation totals for this month have equal chances for below-, near-, or above-normal totals for all of Arizona (white area on map). Precipitation during May last year was less than 5 % of normal for almost all of Arizona.
Area-average precipitation totals in May 2022 were 0.00 inches for the Sonoita AVA, 0.00 inches for the Verde Valley AVA, and 0.00 inches for the Willcox AVA. Respective May normals are 0.22, 0.44, and 0.29 inches.
What can one say but welcome to the start of the climatologically warm-and-dry time of the year in Arizona. For information on reference evapotranspiration that can help determine irrigation needs in the Willcox AVA, please refer to the daily weather summaries for the AZMet Bonita and Willcox Bench stations.
To stay informed of long-range temperature and precipitation possibilities beyond the coverage of a standard weather forecast, check in, too, with the six-to-ten-day outlook and eight-to-fourteen-day outlook issued daily by NOAA’s Climate Prediction Center.
cvn-outlook-202305-prcp.png
Vine Dormancy and the Start of the Growing Season
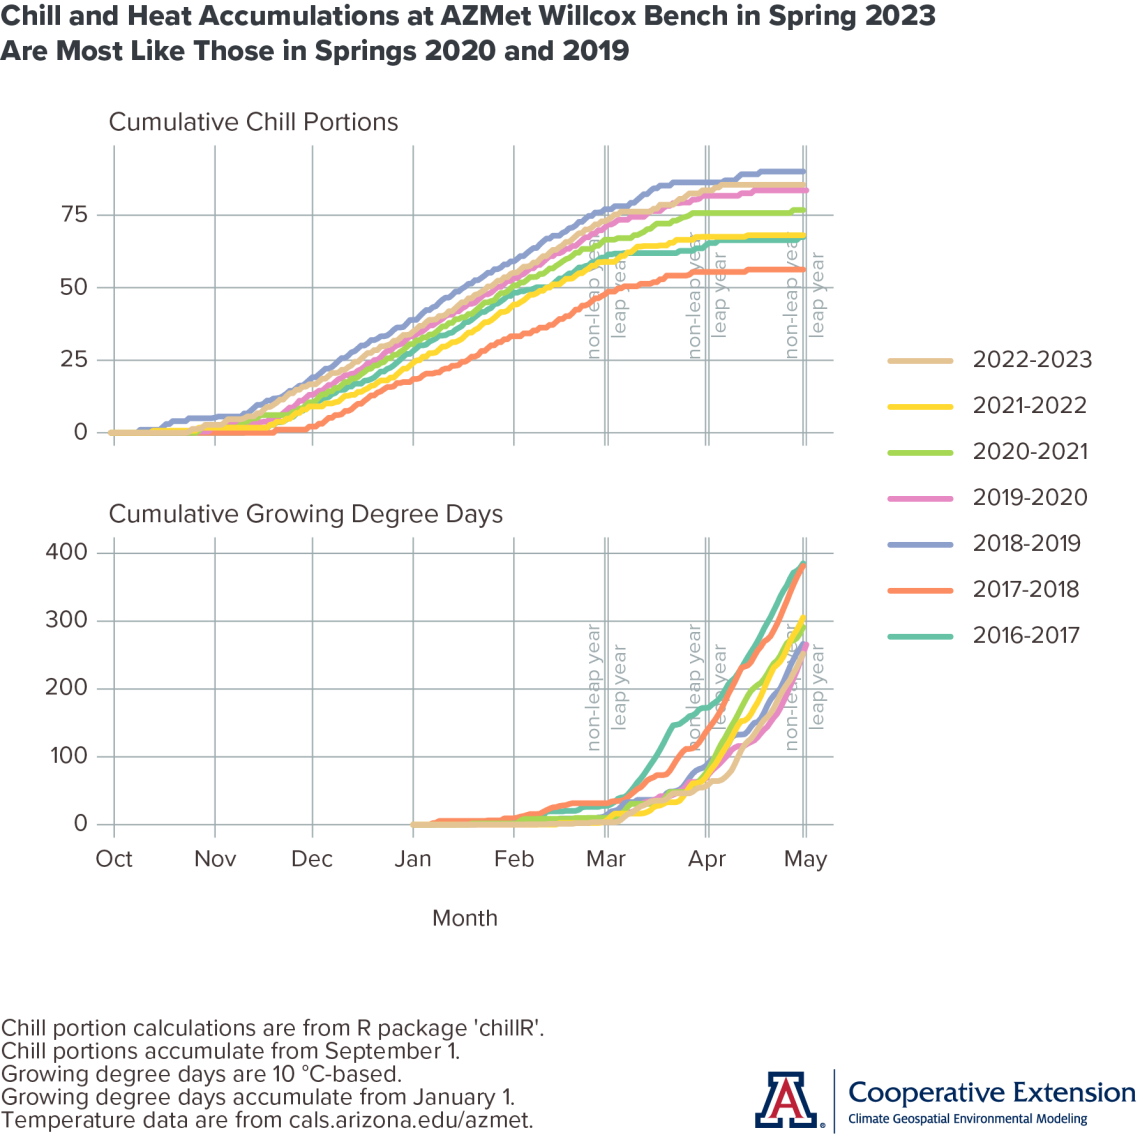
With bud break likely done in perhaps all but the latest varieties and coolest growing areas in the state, we’ll take one last look at chill and heat accumulations influencing the start of the growing season this year. Temperatures in April maintained what we observed and anticipated in the past two newsletter issues. Cumulative chill portion values this year are most similar to those from 2019-2020 and 2018-2019 (tan, pink, and blue lines in top graph, respectively). The same can be said for cumulative growing degree day values (tan, pink, and blue lines in bottom graph, respectively).
Based on this approach of combining deacclimation kinetics and past ‘analog’ years to estimate bud break dates, timing of bud break in 2023 still looks to be most like that from springs 2020 and 2019, at least at this location. Granted, something that might have upended this estimate for some varieties is the few nights below freezing during the first week of April.
As we only use temperature data here from the AZMet Willcox Bench station, the above assessment of the start of the growing season is most applicable to the south-central part of the Willcox AVA. From what we’ve heard from there, bud break observations are consistent with what we’ve been anticipating. Farther away, like in the Sonoita and Verde Valley AVAs, chill and heat might have accumulated differently and their assessment through a deacclimation kinetics lens may have led to different expectations. We hope to expand bud break modeling to these areas in the future.
cvn-chill-heat-accumulation-202305-2023-05-02.png
Freezing Temperatures in April
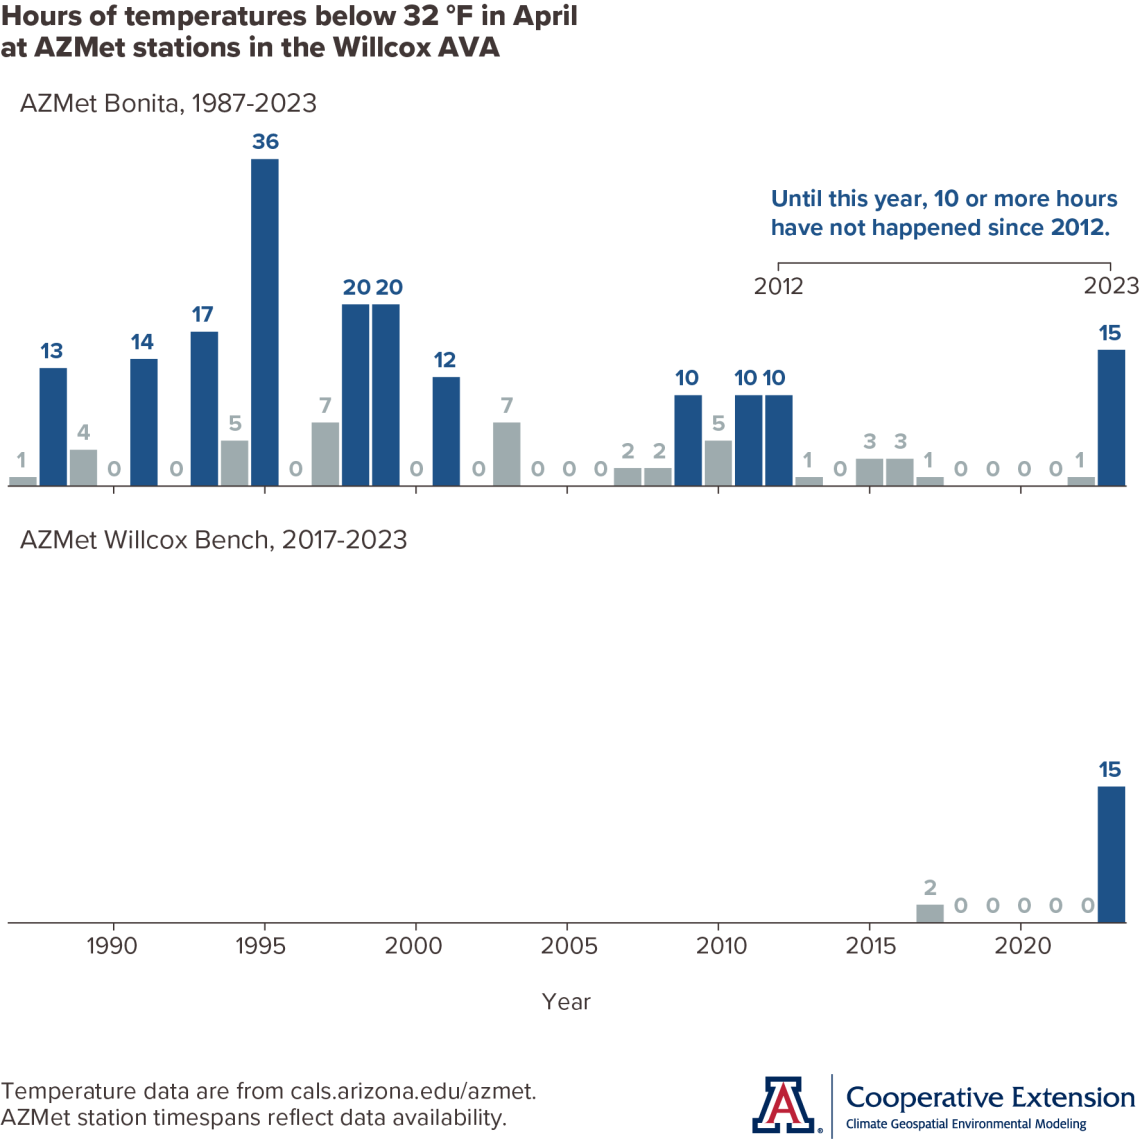
If you thought the freezing temperatures in early April this year didn’t seem typical relative to recent years, you were right. At the AZMet Bonita station in the northern Willcox AVA (top graph), there were a total of 15 hours with an average temperature below 32 °F last month. There hasn’t been an April with more than a total of 10 such hours since 2012 (blue bars in graphs). What has been typical in recent years is just a few such hours at most, if any (gray bars in graphs). A relatively low frequency of exposure to freezing temperatures during the month April over the past two decades contrasts with a relatively higher frequency prior to 2000 and since the start of temperature measurements at the AZMet Bonita station in 1987.
The springtime cold snap this year from April 4 through April 6 resulted in daily minimum temperatures at the AZMet Bonita station of 29, 22, and 29 °F, respectively. The same values occurred at the AZMet Willcox Bench station. From what we’ve heard, early varieties already were past bud break in this area at that time and seem to have been more affected by the freezing temperatures than late ones.
Putting all this together, the risk of spring freeze damage in a vineyard is a combination of the chances of freezing temperatures at this time of year and, should they occur, the sensitivity of a vine given its coincident phenological stage. The former depends on how often the perhaps few general, regional weather patterns that typically bring cold temperatures to Arizona occur, and how cold the air is that they bring. The latter also depends on these dynamic and thermodynamic aspects of weather and climate, but during previous months and in the context of chill and heat accumulation. As suggested by the top graph, at least the former may be changing over time.
Even though we can’t control what leads to these conditional probabilities, there are actions one can take to reduce the risk of spring freeze damage in a vineyard. As evidenced above, growing late varieties can reduce how much of a vineyard is impacted, depending of course on the timing of the freeze event. During temperature inversions and nights with low wind speeds, wind machines mix the colder air settling towards the ground with warmer air above to effectively raise vineyard temperatures. In growing regions like France, where spring freeze damage has been costly in recent years, growers are experimenting with late pruning to delay bud break. For vineyards yet to be planted, site selection can sidestep locations where cold-air drainage is problematic.
cvn-april-hours-below-freezing-202305-2023-05-01.png
Heat Accumulation during the Growing Season
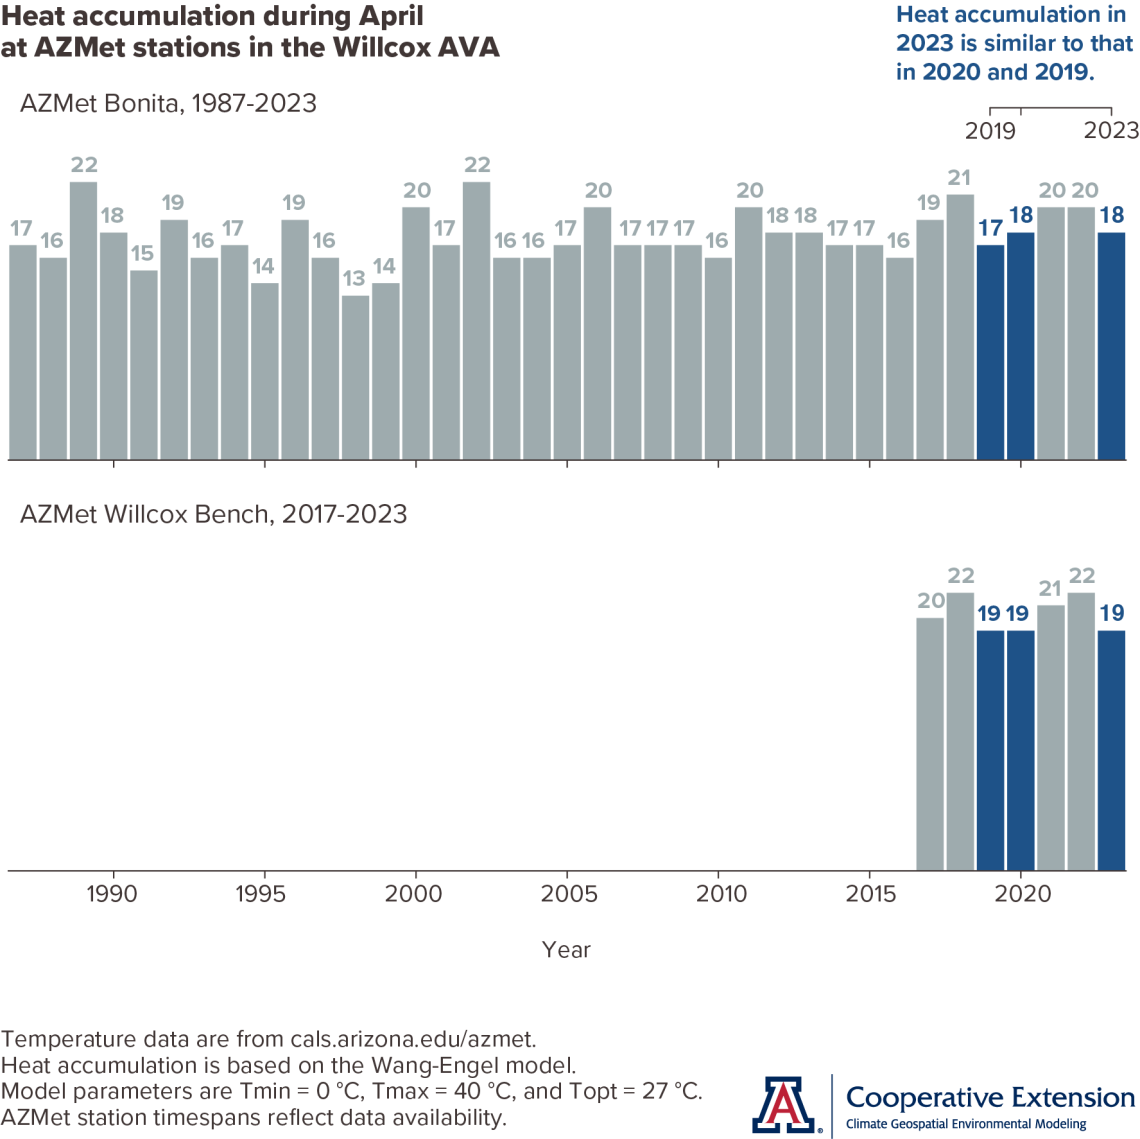
For those vineyards and varieties in the Willcox AVA that made it through the early April freeze this year relatively unscathed, bud break dates may not be the only thing similar to what happened in springs 2020 and 2019. Based on heat accumulation last month at the AZMet Bonita and Willcox Bench stations (top and bottom graphs, respectively), the pace of vines from one early-season growth stage to the next this year also might be much the same (blue bars in graphs). In contrast, vine progress so far this year may seem slower than the past two, as April heat accumulation was less in 2023 than it was in 2022 and 2021 (gray bars in graphs).
One might expect the similarities of vine growth between this year and 2020 at least to end soon. The temperature outlook above for May 2023 is not like the one from May 2020, when there was a strong increase in chances for above-normal temperatures across the state. You’ll likely recall that this was the start of our multi-month record-hot run during the growing season that year.
Although we’re using the Wang-Engel model to calculate heat accumulation here, one reaches a similar conclusion about how 2023 so far compares to previous years using other models. Certainly, we weren’t expecting temperatures in the Willcox AVA last month to be hot enough and in the range in which slowdown or stoppage of vine photosynthesis and growth occurs, something that the Wang-Engel model accounts for. Rather, we’re just picking up where we left off last year with this topic. Call it another case of many methods and few concepts.
Extra Notes
The Water Resources Research Center at the University of Arizona recently published a Water Factsheet for Mohave County, in the northwest corner of the state. The factsheet includes topics like groundwater, surface, and reuse sources, as well as current challenges for water quantity and quality.
Due in part to widespread, above-normal precipitation during the winter months, there is a below-normal potential this month for significant wildland fires across the northern half of Arizona. Across the southern half, potential is near normal.
For those of you in southeastern Arizona, including the Sonoita and Willcox AVAs, Cooperative Extension manages an email listserv in coordination with the Tucson forecast office of the National Weather Service to provide information in the days leading up to agriculturally important events, like spring freezes and high-wind days. Please contact us if you'd like to sign up.
And for those of you in north-central and northeastern Arizona, including the Verde Valley AVA, Cooperative Extension also now manages an email listserv in coordination with the Flagstaff forecast office of the National Weather Service to provide similar information for this part of the state. Please contact us if you'd like to sign up.
Undergraduate students in the College of Agriculture and Life Sciences at the University of Arizona are looking for internships with businesses and companies in the viticulture and winery industries. Please contact Danielle Buhrow, Senior Academic Advisor and Graduate Program Coordinator in the Department of Agricultural and Resource Economics, for more information.
Please feel free to give us feedback on this issue of the Climate Viticulture Newsletter, suggestions on what to include more or less often, and ideas for new topics.
Did someone forward you this newsletter? Please contact us to subscribe.
Have a wonderful May!
With current and past support from:

