R and MS Excel tool for fast processing of camera-trap photos in population modeling, species richness, abundance, and distribution studies
(R and Excel files available below
Updated 15feb2017)
Motion sensing, infrared camera-traps are an incredibly popular tool for monitoring marked and unmarked individuals, describing species distributions and resource use, and describing community composition and dynamics. Converting thousands of images collected by camera traps into raw data is a large hurdle in these studies. Here is an R script for subsetting (based on a custom sampling designs) and compiling a list of images (along with their metadata) stored in local directories and and Excel form for interfacing with those images to compile species detections, counts, and other covariates from images into a single spreadsheet. The emphasis is on distinguishing detections from non-detections for multiple species, but with highly customizable data types. This tool further provides for consistent and robust data structure and entry that can accommodate changes in image analysis as a study progresses.

First, an R script is pasted into a directory containing images or sub-folders with images (where folder names should denote the camera-trap site). The R script contains code for subsetting images based on time conditions. For example it is possible to subset images collected only from 18h00 to 6h00 or only from the first week of every month, etc. Optional coding also allows for 'flagging' certain images for special consideration during image processing. The directory paths (both relative and absolute) for the subsetted images are then written to a .csv file, along with date and time of every photo.

Image data from the .csv file produced by the R-script are pasted into an excel workbook. This workbooks contains a customizable form that allows you to specify many data types (numeric, nominal, binomial) with user-defined values to facilitate fast and consistent data entry. The form includes VBA-script to navigate and display images and enter data in a minimal number of mouse clicks and all data are stored in a single spreadsheet for easy manipulation and merger when the time for analysis comes.
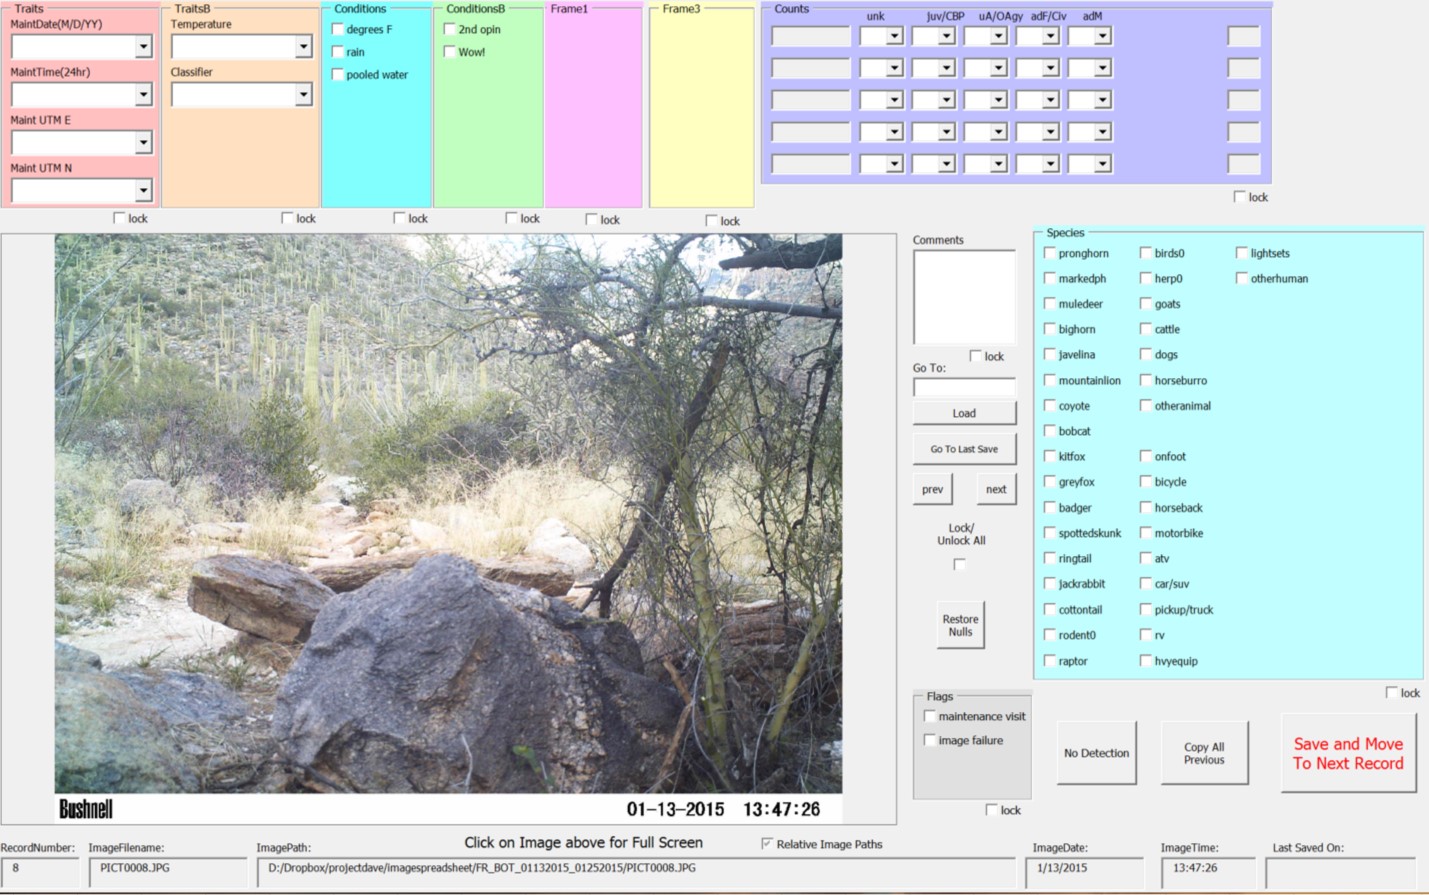
While the input form is flexible in the number and types of data that can be scored for your images, the underlying structure of the spreadsheet is fixed so that modifications of the input form, midway through a study, do not lead to data corruption. Further, the form is centered around distinguishing between no detections, detections (without counts), counts, or not-scored (missing values). Unused data fields result in blank cells in the data spreadsheet, but once the data field is implemented, NA's are inserted by default (if no data option is selected). This allows for changes in image processing procedure to be identifiable in the analysis phase.
updated 22 feb 2017
updated 22 feb 2017
click on the above images to download the base Excel workbook and R-script.
_
_
pronghorn_22feb17.xlsm
pronghonr_22feb17.R
Click on the above images to download an example. The R script selects images from the first 7 days of March, June, September, and December over three years. The Alert is used to flag images taken at 04h00 and 16h00 to remind the user to record the temperature from the image in the spreadsheet. The excel workbook shows use of mulitple classes for tallying counts of animals by age/sex and for humans by agency. Some species are listed so as not to require a count >0, when only presence is desired (birds0).