Drone Imagery
This section provides links to access external repositories of high-resolution drone imagery from different research projects conducted on the Santa Rita Experimental Range (SRER).
The projects and data available are described below.
For more information about the drone imagery collection, please contact Jeffrey Gillan (jgillan@arizona.edu).
A series of high-resolution drone imagery was collected in 2019 on the SRER in the framework of a research project finalized to distinguish with remote sensing the Ecological Sites and the Ecological States (vegetation states) of specific areas of the range previously mapped on the ground. By incorporating existing technologies in drones (real-time kinematic GPS), data processing (automation with Python scripts, high-performance computing), and cloud-based analysis (Google Earth Engine), the project allowed the development of a workflow to increase the efficiency of collecting, analyzing, and interpreting high volumes of drone imagery for repeated monitoring of common indicators of interest to rangeland managers (e.g. vegetation cover and vegetation heights) (Gillan et al. 2021).
Data, including raw imagery, point clouds (.laz & Entwine Point Tiles), digital surface models, digital terrain models, VHMs, and orthomosaics, and software code are available in CyVerse Data Commons at Innovations to expand drone data collections and analysis for rangeland monitoring.
For more information about this project, please contact Jeffrey Gillan.
References
Gillan, Jeffrey K.; Ponce-Campos, Guillermo. E.; Swetnam, Tyson L.; Gorlier, Alessandra; Heilman, Philip; McClaran, Mitchel. P. 2021. Innovations to expand drone data collection and analysis for rangeland monitoring. Ecosphere 12(7):e03649. 10.1002/ ecs2.3649
A series of high-resolution drone imagery was collected in 2016 on the SRER in the framework of a research project finalized to measure forage utilization by cattle using drone point clouds (Gillan et al. 2019). The project focused on cattle utilization in pasture UA-C. Image acquisition occurred immediately before and after grazing using a DJI Phantom 3 Professional and a Phantom 4 multirotor drones.
Raw images and RTK-GPS ground control points for plot location are available in CyVerse Data Commons at Estimating forage utilization with drone-based photogrammetric point clouds.
Orthomosaics and raw photos from the six plots used in the study are also stored on the GeoNadir portal and can be accessed through the links provided in the table below.
For more information about this project, please contact Jeffrey Gillan.
References
Gillan, Jeffrey K.; McClaran, Mitchel. P.; Swetnam, Tyson. L.; Heilman, Philip. 2019. Estimating forage utilization with drone-based photogrammetric point clouds. Rangeland Ecology & Management 72:575–585. DOI 10.1016/j.rama.2019.02.009
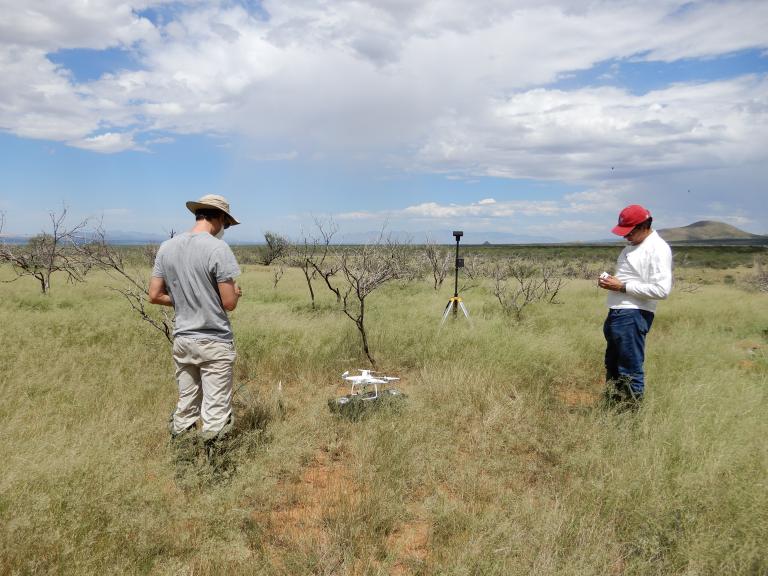
These drone images document the study area of a research project focusing on the critical shrub establishment phase of velvet mesquite (Prosopis velutina) to answer to the question “How does herbivory by livestock, ants, and/or small mammals interact with precipitation to influence the probability of shrub seedling establishment in grasslands?”.
For more information about this project, please contact Austin Rutherford.
This image collection documents the study area of the Santa Rita Rainfall Manipulation Study (RainManSR) carried out by USDA Agricultural Research Service Southwest Watershed Research Center. RainManSR is a collaborative field experimental research site investigating the effects of altered rainfall amounts and timing on the structure and function of Sonoran desert rangelands (Zhang et al. 2021; Zhang et al. 2022).
For more information about this project, please contact Joel Biederman.
References
Zhang, Fangyue; Biederman, Joel A.; Dannenberg, Matthew P.; Yan, Dong; Reed, Sasha C.; Smith, William K. 2021. Five Decades of Observed Daily Precipitation Reveal Longer and More Variable Drought Events Across Much of the Western United States. Geophysical Research Letters 48, 7, e2020GL092293.
Zhang, Fangyue; Biederman, Joel A.; Pierce, Nathan A., Potts, Daniel L.; Devine, Charles John, Hao, Yanbin; Smith, William K. 2022. Precipitation temporal repackaging into fewer, larger storms delayed seasonal timing of peak photosynthesis in a semi-arid grassland. Functional Ecology 36, 3: 646-658.
The following links provide access to a series of drone imagery collected in 2020 on the SRER to delineate small watersheds (catchments). These catchments are instrumented and studied by USDA Agricultural Research Service Southwest Watershed Research Center. Precipitation and Run-off data records are available at https://www.tucson.ars.ag.gov/dap/DataCatalogueOld.htm.
See below the map of the 8 watersheds on the SRER. KML [keyhole markup language] and shapefile (*shp) to be used in Google Earth and Geographic Information Systems software, respectively, are available for download at Spatial data.
Drone Imagery_ARSwatershed map.gif