Precipitation
The Excel format file precip.xls available below for download contains monthly precipitation measurements collected from 75 gauges on the Santa Rita Experimental Range. Of these 75 gauges, 24 are currently being monitored monthly and 51 have been discontinued. Some gauges had measurements recorded under more than one name, but all data are entered under the most recent name (see the next section for the name history of rain stations). The files preciplayout and precipnotes provide supporting information to the Excel file.
Precipitation amounts are recorded in 100ths of inches; two decimal places are assumed (e.g., 125 = 1.25 inches). A zero indicates that no precipitation occurred that month. A value of -9999 indicates missing or unavailable data. The sources of file data were original handwritten records and previously digitized data. In cases of discrepancy, the original records were considered to be the ultimate authority.
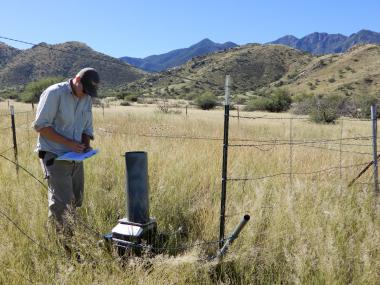
Precipitation_measurements_Blum.JPG
The Precipitation database includes monthly measurements at 75 rain gauges on the Santa Rita Experimental Range (SRER) starting as early as 1922, the UTM Coordinates of rain gauges, and the history of name changes and record of longevity for the gauges. Additional resources are also provided with the data.
Among the 75 gauges included in the database, only 24 are still measured regularly. The frequency of measurement is monthly, and the precision is 0.01 inches. The earliest measurements began in 1922, and 15 gauges have a record from that point to the present. Of the currently measured gauges, 23 have a record of at least 50 years. The locations of the gauges were digitized from locations marked on USGS topographic maps of the SRER. The UTM coordinates represent the digitized points reprojected to the NAD83 datum using the GRS1980 spheroid (McClaran 2002).
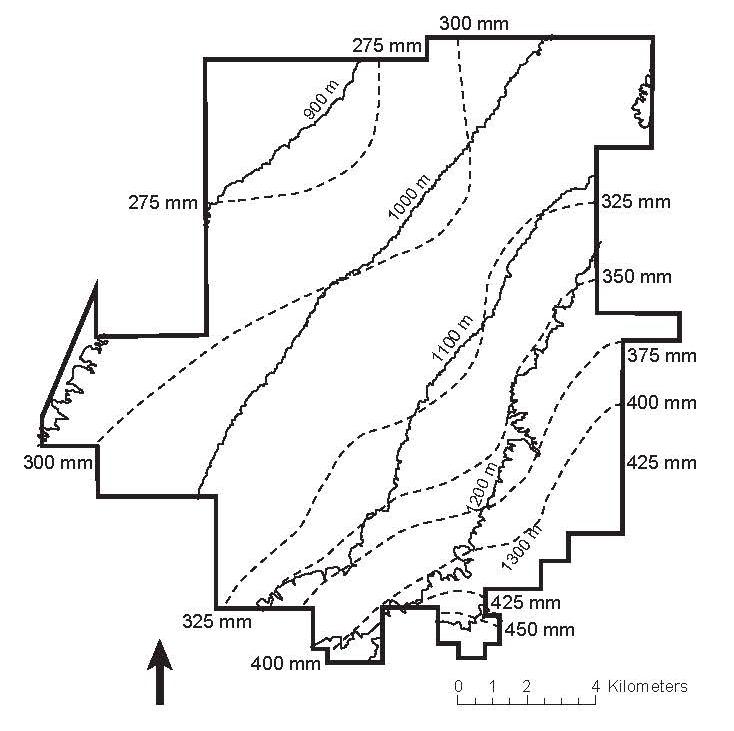
On the SRER, elevation increases from about 900 to 1,400 m, and average annual precipitation increases along this gradient from 275 to 450 mm. Noteworthy features of the precipitation record are distinct summer and winter patterns. Based on the long-term record of the 24 current gauges on the Santa Rita, 2021 was the wettest July-September period at 15.08 inches average (1931 was a close second at 15.01 inches, and 1990 was third wettest at 13.87), which is quite a difference from the 2020 average which, at 2.1 inches, was the driest on record for the July-September period since 1922 (followed by 1973, 1956, 1989, and 1924).
All data and related notes about the contents are available for download on this page. Data users are requested to acknowledge their use of the database in publications, research proposals, websites, and other outlets by following the Instructions for Use, Citations, and Acknowledgement. Additional resources to follow precipitation patterns on the SRER are provided below.
References
McClaran, Mitchel P.; Angell, Deborah L.; Wissler, Craig. 2002. Santa Rita Experimental Range digital database: user’s guide. Gen. Tech. Rep. RMRS-GTR-100. Ogden, UT: U.S. Department of Agriculture, Forest Service, Rocky Mountain Research Station. 13 p.
McClaran, Mitchel P. 2003. A Century of Vegetation Change on the Santa Rita Experimental Range. In: McClaran, Mitchel P.; Ffolliott, Peter F.; Edminster, Carleton B., tech. coords. Santa Rita Experimental Range: 100 years (1903 to 2003) of accomplishments and contributions; conference proceedings; 2003 October 30–November 1; Tucson, AZ. Proc. RMRS-P-30. Ogden, UT: U.S. Department of Agriculture, Forest Service, Rocky Mountain Research Station. p. 16-33.
The protocol to measure precipitation at the SRER is available below for download.
The UTM Coordinates of the 75 Rain Gauge Stations on the Santa Rita Range are available below for download. The coordinates are projected in the NAD83 datum using the GRS1980 spheroid:
Projection: UTM, Zone 12
Datum: NAD83
Spheroid: GRS80
A vector data file (shapefile, *.shp) to be used with Geographic Information System software is also available at Spatial Data.
The list with the name history of the SRER Rain Gauge Stations, including the current and the previous names as well as the period of use of each name, is available below for download.
Additional data and resources on the precipitation at the SRER are available on the following websites:
- USDA Agricultural Research Service, Tucson, that includes daily records for precipitation and sediment and runoff for all rainfall events since 1975. Coordinates for the SRER (#76) locations are available for both gages and flumes. High resolution drone imagery of the 8 watersheds are available on this website at Drone Imagery.
- MyRAINgeLog (University of Arizona), where values for 7 rain gauges at the Santa Rita are reported;
- Standardized Precipitation Index (SPI) Explorer (University of Arizona), which allows exploring SPI values at specific locations by using a gridded climate dataset (PRISM Climate) to estimate local precipitation time series.
Precipitation_Graph Elevation-Precipitation_McClaran2003.jpg