|
|
|
MEMP Homepage |
MEMP Phase I Final Report
|
The United Sates Agency for International Development [USAID] and the government of Malawi (GoM) are collaborating to provide the Malawi Environmental Monitoring Program [MEMP] with the necessary field, technical, and analytical training to carry out several environmental monitoring activities. MEMP was initiated to fulfill a threefold mission aimed at assisting the Ministry of Research and Environmental Affairs [MoREA] and other departments to:
1. Monitor the environmental impacts of policy reforms, in particular the impacts of smallholders' production of burley tobacco;
2. Establish a national capability to assess, monitor, and manage the environmental resources of Malawi; and
3. Provide equipment, training, and methods necessary for the fast and efficient production of maps, documents, and reports based on the results of MEMP's environmental monitoring activities.
The purpose of the MEMP is to support the GoM's Ministry of Research and Environmental Affairs (MoREA) and technical line agencies in the design and implementation of a national environmental monitoring system. The MEMP was initiated in 1993 to monitor the environmental impacts of Agricultural Sector Assistance Program (ASAP) policy reforms and, particularly, to assess the environmental impacts that might accompany an increase in the number of smallholders involved in the production of burley tobacco. Expansion of the ASAP in 1994 has greatly expanded the scope of the agricultural and natural resource management policy reform agendas, requiring an expansion of MEMP activities so as to monitor concomitant environmental impacts.
The objectives of the first two years of the MEMP are to strengthen the technical and institutional capacities of DREA [MoREA] and line agencies in order to (a) assess the possible environmental impacts of smallholder burley tobacco production; and (b) build a broader technical capacity within line agencies upon which a viable national Environmental Information System (EIS) can be based.
Rather than develop an autonomous capacity for environmental monitoring in MoREA that could result in long-term dependency on donor support, MEMP has sought to engage and build upon the existing capabilities of line ministries. The agencies included initially are the Land Resources and Conservation Branch (LR&CB) of the Ministry of Agricultural and Livestock Development (MoA&LD), the Ministry of Irrigation and Water Development (MoI&WD), the Department of Forestry in the Ministry of Natural Resources, the Meteorology Department, and the Department of Surveys.
MoREA is seeking to clarify its vision of a cogent approach to environmental management. As a coordinating agency, it may find that development of an improved administrative capacity is sufficient. However, a serious constraint to improved environmental monitoring is the shortage of appropriate technical and managerial skills. Both of these areas are being addressed as part of the UNDP's Institutional Support for Environmental Management (ISEM) program in the Environmental Affairs Department.
During the first two years of implementation, the MEMP focused more on refining technical skills (e.g., spatial analysis tools such as Geographic Information Systems [GIS]) than in developing its administrative skills within MoREA.
Training in GIS technical skills has revealed three facts: (1) Even within this single area, in-service training cannot satisfy need. (2) The focus on GIS training highlighted the shortage of personnel broadly trained in the environmental sciences. (3) GIS training has not included modules in which trainees are taught to assess or use data. Consequently, there is very little capacity within Malawi to perform applied research on environmental problems. In the future, MEMP must have a more diversified approach to build capacity in the arenas of training and applied research in the environmental sciences.
A technical review workshop of MEMP in April 1995 listed the following variables as essential to monitor pressures and impacts on the environment: changes in agricultural land use, nutrient loss, soil loss, water quality, and wood consumption. The MEMP has received some of these data, but significant data gaps remain. By February 8, 1996, sampling data for one watershed (time series data from January 1995 to April 1995) on water quality, soil and nutrient loss, and rainfall have been processed and entered into a spreadsheet. Some of the data for other catchments have been obtained, but have not yet been incorporated into the database. No data on changes in agricultural production, land use, and wood consumption have been received, and soil specialists still have to process some of their field data. Other, more general data, for example the number of households located in the watershed and their economic and social characteristics, have not yet been compiled, but would provide contextual information for the analysis and allow additional comparisons between the four watersheds.
The MEMP has encountered various problems in obtaining and compiling these data, resulting primarily from the collaborative nature of the monitoring program. MEMP staff reported delays in obtaining some of the data sets (requested in July 1995 and delivered in December 1995). Possible explanations for this delay include lack of commitment from collaborating agencies, change in priorities, limited human resources, and overall government shutdowns. Many times, collaborating agencies provided data that were not fully analyzed or of little use (too much detail, for example) by generalists in the MEMP unit. These obstacles may have resulted either from (1) a lack of clear specifications and misunderstandings on the specific data needs for the MEMP, or (2) a lack of the capability to analyze the field data, whether in line agencies or the MEMP itself.
Using existing data for one watershed, the MEMP has prepared two draft reports, one a synoptic Environmental Data Report Summary and the other a more detailed Environmental Monitoring Report. The World Resources Institute reviewed the purpose, outline, analysis, and data presentation of these reports, and arrived at the following conclusions.
While MEMP staff had identified different audiences for these two draft reports, decisionmakers and technical staff respectively, the authors ultimately dissipated some of their intended focus. For example, the Environmental Data Report presented field measurements (times series of sediment discharge, nutrient, and pesticide concentrations) and discussed constraints and proposed solutions related to the implementation of the MEMP. Similarly, the Environmental Monitoring Report became a combination of a technical description of the monitoring program (sampling sites, data collection, process of collaboration among line agencies, etc.) as well as an analysis and presentation of results of selected data for the 1994/95 monitoring season. Such an approach provided important information, but left the reader looking for an answer as to whether changes in land use, i.e. increased growing of burley tobacco, have affected the environment.
2. Environmental Monitoring Technology
Geographic information technologies, such as GIS, Remote Sensing, and Global Positioning Systems (GPS) are computer-assisted tools for the collection, storage, analysis and display of environmental phenomena. These tools, collectively, offer the potential for a higher degree of access to geographic information for the efficient and effective management and analysis of spatiotemporal data (e.g., the data collected during environmental monitoring) while maintaining greater precision than previously-used methods. Ultimately, the use of these technologies can provide environmental decisionmakers with more timely and accurate information, and can therefore contribute to a more explicitly reasoned decisionmaking process.
Although the use of these technologies shows significant promise for environmental management, it must be recognized that they have not met with the expected success rate in development settings. GIS has been demonstrated and used successfully at the project level, but long-term sustainable implementation of this technology has been rare. In part, this can be attributed to a number of technological issues such as effective training in the use of highly technical software, accessible user interfaces, stable computing environments, access to data networks, etc. However, while these are important issues, to which significant resources are being directed, the more substantive problems related to sustainable technology transfer are associated with organizational and social issues.
The goal of the technology transfer component of the MEMP is to allow the participating agencies, in a coordinated fashion, to employ new geographic technologies to analyze data and provide environmental information in contribution to the program, and in the long-term, provide the important elements for a broader based national-level environmental information system. Toward attaining this goal, microcomputerized equipment, procured in the U.S. but serviceable in Malawi, was purchased. The list of equipment includes microcomputers suitable for GIS and Remote Sensing, data collection and acquisition instruments such as digitizing tablets, tape drives, and GPS units, GIS and Image Processing software to manipulate these data, and peripherals such as printers.
a. Participatory environmental monitoring
To fulfill its objectives, MEMP has been conducting monitoring programs in five small catchments near the towns of Nkhata Bay, Chikwawa, Ntcheu, Mangochi, and Kasungu. The monitoring activities include water sampling at catchment outlets, installation of erosion control-plots and pits, field monitoring pits, and the installation of automated samplers at two of the above-mentioned locations.
Whereas the control plots were managed by MEMP staff who were trained in soil conservation practices, the field pits were managed by the local farmers themselves. Each farmer was also responsible for both reporting the runoff measurements and for collecting the water and sediment samples for subsequent analysis by MEMP staff. All farmers, field assistants, and District Office staff involved in the MEMP received theoretical and some practical training prior to the last monitoring season. In some cases, farmers themselves organized committees for overseeing data collection activities.
b. Participatory research
A survey was conducted in four catchments, Njolomole, Kamundi, Chilindamaji, and Chulu, where MoREA has been collecting rainfall, sedimentation, and runoff data since August 1993. The survey team stayed eight days in each catchment meeting with elders, focus groups of men and women, and with individual farmers. The survey was designed to ascertain farmers’ perceptions, assumptions, and decisionmaking processes that impact natural resource use.
Results of the survey indicate that farmers are particularly aware of changes in natural resources as they affect farm productivity and profitability. The gradual contraction of rainfall and thinning forest cover is associated with declining crop yields and time to find fuel and building materials respectively. Farmers across catchments use similar measures to describe changes but the indicator species or parameter may vary depending on the agroecological zone. For example weed species indicating changes in soil fertility differed between catchments as did pest and disease changes in response to declining rainfall. Agricultural intensification is apparent where population pressures are highest in the south and central regions. Intensification is apparent with decreasing fallow and rotations, and an increase in intercropping.
Farmers listed their major concerns as the cost and availability of inputs followed by lack of safe drinking water and adequately equipped medical facilities. In addition, farmers’ efforts to implement conservation practices are hampered by lack of knowledge, poor health, lack of food, and overburdened extension agents who are vested in delivering programs rather than being responsive to farmers’ needs. Farmers are slow to acknowledge or unaware of their own actions in creating unfavorable resource changes, and quick to point to the detrimental actions of others. Lack of knowledge or unwillingness to assume responsibility for actions is a serious impediment to (1) farmers’ understanding of the rationale for monitoring, and (2) instigating conservation measures.
Involving farmers in an environmental monitoring scheme is probably ambitious at this time. There is no broad-scale understanding of cause and subsequent environmental effect, so presumably few would volunteer for collection of information. Recordkeeping skills are meager and illiteracy high, limiting collection to the literate; alternatively, oral or pictorial methods for recording change might be devised.
However, understanding farmers perceptions allows planners and policymakers to more effectively design interventions that recognize farmers’ realities and sequence measures in a way that makes sense to farmers. Complex factors affect natural resource decisionmaking, and it seems logical to have farmers determine the priorities and processes for their resolution rather than being forced to meet narrow objectives imposed by government or donors.
The initial purpose of the MEMP was to assess the environmental impacts that might accompany an increase in the number of smallholders involved in the production of burley tobacco as a result of policy liberalization. Policy liberalization has surpassed original expectations and has affected the agricultural sector as a whole. With the completion of the National Environmental Action Plan (NEAP) and the development of an Environmental Support Program (ESP), Malawi is much more aware of its critical environmental problems. The emphasis of the MEMP has accommodated the increasing concern over issues of land degradation through soil loss, deforestation, and resultant reduced water flows through major river systems.
The original program design was highly focused on technical approaches to detect change in biophysical parameters with little attention paid to socioeconomic factors. This oversight was modified early during implementation, resulting in an approach where direct field measurements of biophysical change attributable to the impact of policy can be correlated to change in socio-economic parameters. As a result, the four remaining catchments now offer considerable baseline data from which other policy impacts can be evaluated.
One difficulty facing the MEMP in its initial phase is that despite policy liberalization, the farmers' hypothesized entry into burley production has not occurred. Probable reasons include the rise in fertilizer prices concomitant with policy liberalization, the inability of the seed distribution infrastructure to respond to the mandates of the crop calendar, the competition of burley nurseries with women's traditional cash-crop lands, and perhaps a widespread consensus among farmers that despite policy liberalization, entry into burley is simply too risky. As a result of this and other problems, the project has been modified considerably from its original design. A broadening scope, combined with the inherent uncertainty about the nature and magnitude of environmental problems confronting Malawi, suggest that an adaptive approach to project design and initiation should be continued.
For two reasons, the catchment sites developed in the previous eighteen months are not viewed as pilot sites from which to expand the number of sampling areas to cover the entire country. First, the cost of duplicating the effort to gather the baseline information prohibits replicating the effort in anything more than the remaining agroecological or farming-system zones in the country. Second, continuation of this effort cannot be justified until further agency commitment is demonstrated. In light of this, the catchments are viewed as specific sites from which to intensively gather environmental data that can be compared to similar areas found in larger administrative units such as the EPAs, RDPs or ADDs. The result will be two levels of monitoring: (1) site-specific intensive data collection, and (2) extensive monitoring areas. Linkages between the two data levels will be accomplished through appropriate monitoring technologies, such as GIS. Training, development, and institutionalization of appropriate technologies, initiated during the past eighteen months, must therefore continue.
Modifications to the MEMP's original design resulted in a program where individual rainfall events are summarized by duration and intensity while accounting for microscale variation across the catchments. These data are compared with the automated sampler measurements made by the Department of Meteorology. The water and sediment runoff measurements of each individual rainfall event were collected by farmers and field assistants from field pits. The field pits were selected on a basis of slope, soil type, and crop cover. Data from the pits are compared with data collected by EPA staff on control plots located in EPAs. Information pertaining to the influence of different farm practices on the runoff sample results was gathered by LR&CB field assistants. Analyses of the soil data were made by the two soils laboratories run by the Ministry of Agriculture and Livestock Development. Aggregated stage and flow data from the entire catchment were monitored by the Department of Water, with analysis of water quality provided by their Central Water Laboratory. Analysis for organophosphate pesticides was undertaken by the Malawi Bureau of Standards.
The Forestry Research Institute of Malawi (FRIM) in conjunction with the Department of Forestry is collecting household information on wood consumption by species and use. Permanent Sample Plots are located in the catchments and monitored for change over time. HIID completed the socioeconomic baseline study in August, 1995, for all catchments but Chikwawa.
Table 1 below lists the data both collected by and made available to the MEMP.
Table 1. Data Collected By and Made Available To MEMP
|
BASELINE DATA |
Chilindamaji (Nkhata Bay) |
Chulu (Kasungu) |
Njolomole (Ntcheu) |
Kamundi (Mangochi) |
Kalambo (Chapananga) |
|
IMAGERY |
|||||
|
Air Photo |
1990 - 1:25K 1993 - 1:10K |
1990 - 1:25K (partial park coverage) 1993 - 1:10K |
1990 - 1:40K 1990 - 1:10K 1993 - 1:10K |
1990 - 1:40K 1993 - 1:10K |
1990 - 1:40K 1993 - 1:10K |
|
Satellite |
9/72 - MSS 9-10/91 - TM 87-94 - NDVI |
9/72 - MSS 9-10/91 - TM 3-4/94 - SPOT 87-94 - NDVI |
9/72 - MSS 9-10/91 - TM 6/92 - SPOT 87-94 - NDVI |
9/72 - MSS 9/81 - MSS 9-10/91 - TM 3/95 - SPOT 87-94 - NDVI |
9/72 - MSS 9-10/91 - TM 87-94 - NDVI |
|
Video |
1994 - 1:?K |
1994 - 1:?K Video Mosaic |
1994 - 1:?K |
||
|
MAPS (D)=digital |
|||||
|
Topography |
1994 - 1:5K (D) |
1994 - 1:5K (D) |
1994 - 1:5K (D) |
1994 - 1:5K (D) |
1994 - 1:5K |
|
Landuse |
1994 - 1:5K (D) |
1994 - 1:5K |
1994 - 1:5K (D) |
1994 - 1:5K (D) |
|
|
Hydrography |
1994 - 1:5K (D) |
1994 - 1:5K (D) |
1994 - 1:5K (D) |
1994 - 1:5K (D) |
|
|
Boundary & Road network |
1994 - 1:5K (D) |
1994 - 1:5K |
1994 - 1:5K (D) |
1994 - 1:5K (D) |
|
|
Soils |
1994 - 1:5K (D) |
1994 - 1:5K |
|||
|
Forest Cover |
1994 - 1:5K (D) |
1994 - 1:5K |
1994 - 1:5K (D) |
||
|
Slope / Erosion Hazards |
1994 - 1:5K (D) |
1994 - 1:5K (D) |
1994 - 1:5K (D) |
1994 - 1:5K (D) |
|
|
Microshed Analysis |
1994 - 1:5K (D) |
1994 - 1:5K (D) |
1994 - 1:5K (D) |
||
|
WATER |
|||||
|
Guaging |
Manual |
Automatic |
Manual |
Automatic |
|
|
Control plots |
3 |
3 |
3 |
6 - Includes 3 agroforestry trials |
3 - 1994/95 only |
|
Field pits |
4 |
6 |
4 |
6 |
5 - 1994-95 only |
|
Shallow wells |
Water level too deep |
2 - 1995/96 |
2 - 1995/96 |
1 - 1995/96 |
|
|
RAINFALL |
|||||
|
Automated |
1 |
1 |
1 |
1 |
1994-95 only |
|
Standard |
6 |
6 |
6 |
6 |
1994-95 only |
|
SOCIO-ECONOMIC |
|||||
|
Source of income |
1995 |
1995 |
1995 |
1995 |
|
|
Wealth ranking |
1995 |
1995 |
1995 |
1995 |
|
|
Food security |
1995 |
1995 |
1995 |
1995 |
|
|
Source of land |
1995 |
1995 |
1995 |
1995 |
|
|
Reason for fallow |
1995 |
1995 |
1995 |
1995 |
|
|
FORESTRY |
|||||
|
Forest products used by species |
1995 |
1995 |
1995 |
1995 |
|
|
Stems per hectare |
1995 |
1995 |
1995 |
||
|
Diameter classes |
1995 |
1995 |
1995 |
continued
Table 1 (continued)
|
DATA INPUT |
Chilindamaji (Nkhata Bay) |
Chulu (Kasungu) |
Njolomole (Ntcheu) |
Kamundi (Mangochi) |
Kalambo (Chapananga) |
|
Water quality |
1994/95 |
1994/95 |
1994/95 |
1994/95 |
|
|
Water flow |
1994/95 |
1994/95 |
1994/95 |
1994/95 |
|
|
Rainfall |
1994/95 |
1994/95 |
1994/95 |
1994/95 |
1994/95 |
|
Agronomic |
1994/95 |
1994/95 (gaps) |
1994/95 (gaps) |
1994/95 (gaps) |
1994/95 (gaps) |
|
Sediment |
1994/95 |
1994/95 (gaps) |
1994/95 (gaps) |
1994/95 (gaps) |
1994/95 (gaps) |
|
Pesticides |
1994/95 |
||||
|
ANALYSIS & REPORTING |
Chilindamaji (Nkhata Bay) |
Chulu (Kasungu) |
Njolomole (Ntcheu) |
Kamundi (Mangochi) |
Kalambo (Chapananga) |
|
Water quality |
1994/95 |
||||
|
Water flow |
1994/95 |
||||
|
Rainfall |
1994/95 |
||||
|
Agronomic |
1994/95 |
||||
|
Sediment |
1994/95 (USDA) |
||||
|
Pesticides |
1994/95 (MEMP) |
1. The Socioeconomic Baseline Study
This survey enumerated a broad range of socioeconomic conditions in smallholder households who farmed fields (either burley tobacco or other crops) in the MEMP catchment areas. The purpose of the survey was threefold: (1) to collect basic household data to facilitate analysis of how burley tobacco production among smallholder farmers is affecting household economic conditions; (2) to ascertain the effect on broader socioeconomic conditions of the adoption of burley production among smallholders; and (3) to derive the consequences of burley production on natural resources.
The present analysis focuses on patterns of agricultural production, relative wealth of burley growers, food security, land acquisition and fallowing, and use of forest products. Overall, the findings in this survey appear to confirm previous assessments of the relationships between burley production and smallholder wealth, food security, and resource management. In general, burley growers tend to be the wealthier smallholders who are more secure in their food supplies, and who are least likely to face serious problems of resource scarcity. The survey does not reveal major recent changes in overall patterns of agricultural production, although many previous burley growers appear to have stopped this year, mainly due to problems related to shortages of fertilizer. Moreover, the survey appears to suggest that overall patterns of land acquisition are similar between burley and non-burley households, although there appears to be a positive association between greater wealth and acquisition of land through the husband’s family. Although patterns of acquisition are generally similar, patterns of land use do appear to differ, with burley growers typically leaving less land fallow than non-burley households. Burley growers also have a particularly high demand for certain wood products, especially poles for constructing tobacco drying sheds.
a. Patterns of agricultural production
Most smallholder farmers in Malawi, including burley growers, pursue a strategy of diversified agricultural production, which includes combinations of hybrid and local maize, cassava, sunflower, legumes, vegetables, fruits, and tobacco. Most of these crops can be used for both home consumption and for cash sales. The impact of burley production on smallholder household economics must be considered in light of ongoing efforts by smallholders to maintain diversified production. None of the smallholder burley growers in the MEMP survey engage solely in burley production, and most allocate only a portion of their available land and capital to burley production. Similarly, even among burley growers, burley represents only one among a number of strategies for generating income. There is no clear evidence of a shift toward increased allocation of resources to burley production. Although more research is needed, there is some evidence of decreasing interest in burley production, particularly as a result of recent steep increases in fertilizer prices.
The relative importance of burley also appears to vary across catchments. In three of the four catchments, burley was reported as the primary source of cash income among burley growers.
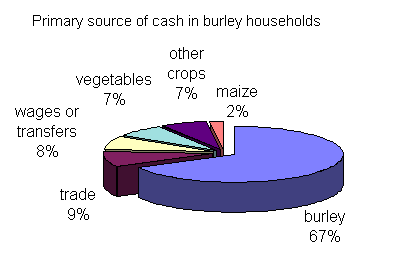
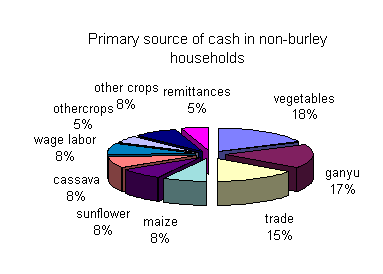
It is important to stress that even among burley growers, while burley is the most important source of cash income it is not necessarily their main source of livelihood (Figure 1). All burley growers in the MEMP sample also grew maize (or, in Nkhata Bay, cassava) as a food staple, as well as combinations of legumes, tubers, vegetables and fruits.
|
|
|
Figure 1. Primary sources of cash income in burley and non-burley growing households.
b. Indications of change in burley production
There is little evidence from the MEMP catchments that a large number of smallholders are shifting into burley production, and there are reasons to believe that under present conditions of increasing fertilizer prices and the collapse and abuse of some burley clubs, the number of smallholder burley growers is unlikely to expand significantly. The MEMP socioeconomic survey recorded a number of non-burley growers who had previously grown burley but stopped because of problems related to credit and fertilizer.
The reasons for failure in burley growing mainly involve problems with fertilizer and credit, although poor rains have also played a part. Smallholders complained that burley clubs (which are intended to provide credit for inputs, particularly fertilizer) had collapsed due to nonpayment of debts and because of disputes over the distribution of profits from sales at auction floors. At the Njolomole site, these problems were recorded in 1994, and continue to represent a significant barrier to participation in burley production. At the Chulu site, a very large number of farmers who were identified as having started burley nurseries in the Fall 1994 planting season ended up harvesting no burley at all because of the failure of local clubs to provide fertilizer on acceptable terms. The number of farmers who attempted but failed in their efforts to grow burley in the Chulu catchment possibly exceeds the number who succeeded. In all catchments, people also complained about unpredictable rainfall. In addition, the recent removal of fertilizer subsidies has put purchases of fertilizer beyond the reach of even relatively wealthy smallholders. Despite these problems, smallholder interest in burley production remains high, especially following the relatively good prices of the last season. But without improved access to credit and/or lower fertilizer prices, the number of smallholders growing burley is unlikely to grow.
c. The relationship between burley cultivation and smallholder wealth
Smallholder farmers who grow burley are, on the whole, wealthier than non-burley-growers. This relationship is demonstrated by the predominance of non-burley households (70 percent) in the lowest wealth quartile, whereas most of the wealthiest smallholders (63 percent) are burley growers. In the mid-level wealth quartiles, households are equally likely to be burley or non-burley growers. Thus, while burley cultivation is not always associated with greater wealth, there is a clear and statistically significant tendency for burley production to be associated with relative affluence among smallholders. The finding that wealth is statistically related to burley cultivation is not surprising, since considerable qualitative evidence exists indicating that burley growers are generally among the wealthiest of smallholder farmers.
Qualitative assessment, from both the MEMP socioeconomic survey and from other socio-economic analyses, suggests that the following interpretations may hold. For the most part, the poorest smallholders are unable or unwilling to invest substantial resources in the potentially lucrative but risky practice of burley cultivation. There is some evidence (particularly in the Chulu and Njolomole catchments) that considerable numbers of poorer smallholders actually were made worse off by investing in failed burley production. However, among those who succeeded in growing burley, many attribute their improved economic condition to burley. Thus, it would appear that in general, smallholders in the middle and upper economic quartiles are most likely to grow burley and that some portion of these find that burley has contributed to increased wealth.
d. Food security
Burley production does not appear to be strongly related to household food production. Overall, households in the MEMP sample annually produced an average of 249 kilograms per capita of their own maize. Burley-cultivating households grew slightly more maize than non-burley households, though this difference is not statistically significant.
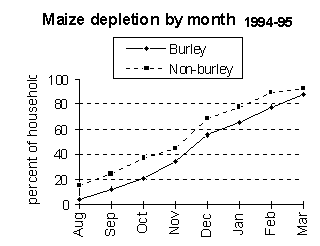
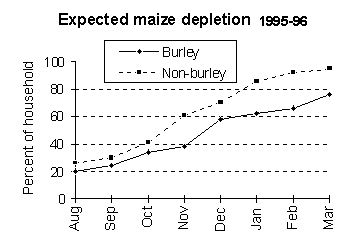
Subsistence maize production, however, is not synonymous with food security. Smallholders also buy and sell maize. Because of their greater income, burley producers are presumed to be in a better position to buy maize. In both the 1994-95 and 1995-96 seasons, burley-growing households reported that they ran out or expected to run out of their own-produced maize later in the season (Figure 2), and a higher proportion of burley households reported having purchased or anticipated purchasing maize, reflecting their greater disposable income.
|
|
|
Figure 2. Maize depletion and expected depletion by month in burley and non-burley growing households, 1994-96.
e. Fallow fields
One somewhat surprising finding of the MEMP socioeconomic survey is that a substantial number of fields held by smallholder households are left fallow – 45 out of 273 total fields in the survey, or 16 percent. Without having area calculations for these fields, it is not possible to assess what proportion of the total cropped area this represents. Nevertheless, the extent of fallowed fields is surprising considering the general scarcity of land in Malawi, particularly in the south. However, the MEMP survey also shows that the primary reasons for leaving land fallow are shortages of labor or money, and ill-health (Figure 3). Only 13 percent of fallowed fields are left fallow for the primary purpose of regenerating soil quality. Some of the other reasons that smallholders reported for leaving fields fallow include the fields being "too big" to cultivate completely, that they are newly acquired, or that their quality is poor. On examination, these factors probably refer to shortages of labor or capital to invest in fully cultivating landholdings.
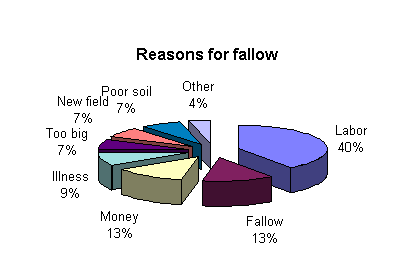
Figure 3. Reasons for allowing fields to remain fallow.
The importance of labor and capital shortages as a reason for fallowing land may explain the general tendency for burley-growers (who are wealthier and therefore in a better position to purchase labor) to leave a somewhat lower proportion of their fields (15 percent) fallow than non-burley growers (19 percent).
f. Forest products utilization inventory
The socioeconomic survey team combined efforts with the Department of Forestry in carrying out the Forest Products Utilization Inventory. This inventory enumerated the main uses of forest products, the preferred species for each type of use, perceptions of scarcity, and actions taken in response to declining availability of forest products.
Respondents were asked to identify the most important products that they obtain from local woodlands in order of priority, and often identified as many as six priority uses. Burley and non-burley households shared very similar priorities, with fuelwood being the overwhelming first priority, and poles being the dominant second priority (Figure 4). Rope, fiber, poles, and timber were the most frequently identified third-priority uses. Other uses identified in each level of priority include hanging racks for tobacco sheds, grass, fruit, medicine, and conservation.
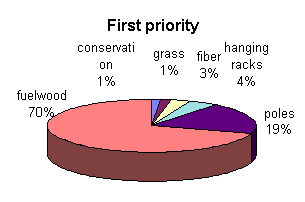
Figure 4. Priority uses of forest products.
The MEMP socioeconomic survey recorded a very large number of preferred species for each type of forest product. In tabulating the total number of "preferred" species for all uses, there are no species that account for more than about 9 percent of the total number of responses. Similarly, for specific wood uses there were no species that were mentioned as being the single most important.
This survey aimed to quantify the woody resource in three catchment areas with remnant woodland cover consisting of native species. The resource was quantified in terms of the number and composition of the woodland species. To complement the qualitative assessment made during the socioeconomic survey, the end uses identified by farmers were quantified . This study enables the MEMP to assess change in woodland cover over time and address the impact of expanded smallholder tobacco production on the tree resources in the catchments. The study was completed by the Department of Forestry and the Forestry Research Institute of Malawi (FRIM). Results are given in Appendix 1 of the Forestry Sample Plot Report, Annex 2 of this document.
Comprehensive monitoring of soil and water quality as functions of crop cover and the farming system was undertaken at all catchments but analyzed, interpreted, and reported only for the Chilindamaji catchment. For Chilindamaji, three control plots and four field pits were established. Two control plots were monocropped with burley and maize, while the third was allowed to lie fallow. Of the four field plots, two were monocropped with burley, two with maize. The three control plots have similar rainfall-runoff relationships, ones characterized by runoff substantially lower than obtained from the field plots, which conclusively demonstrates the effectiveness of erosion-control practices in reducing runoff from fields.
Seven water quality parameters were measured: total dissolved solids, sulfate, nitrate, phosphate, sodium, potassium, and sediment yield. In almost every instance, the field plots released higher amounts of these parameters than did the control plots. Results are tabulated in detail in Annex 4 of this document.
a. Soil loss
One of the objectives for MEMP is to establish and document, with involvement of the farmers at the grassroots level, the on-site and off-site impacts of burley tobacco production on smallholder farmlands.
So far, the results obtained show a positive correlation between the runoff and rainfall events in the burley tobacco control plot as indicated in Figure 5. This was further indicated by high levels of sediment in the runoff following the storm events as highlighted by Figure 6. The high sediment levels indicates major topsoil loss from the farmlands within the catchment.
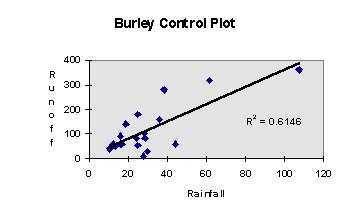
Figure 5. Control plot, Chilindamaji catchment, Nkhata Bay.
The moderate rainfall/runoff relationship (Figure 5) indicates that (1) we can trust farmers to collect valid field data for purposes of environmental monitoring, contrary to the notion that farmers cannot collect environmental data effectively and reliably; (2) the findings from this intensive data sampling can perhaps be extrapolated to other areas of similar ecological and rainfall characteristics, hence there is no need to sample every location in Malawi; and (3) there were no notable indicators to suggest that burley tobacco had significantly greater effects on soil loss than did other cropping factors. However, considerably more research is required to verify this observation.
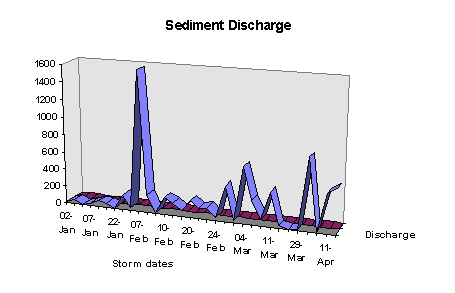
Figure 6. Kalwe River sediment discharge, Nkhata Bay.
b. Nutrient losses
Soil fertility determinant ions are usually concentrated in the finer constituents of topsoil, and thus are easily removed by runoff. Soil loss is accompanied by loss of essential micronutrients. The losses were greater for potassium (K), phosphorus (PO4), and sodium (Na), hinting at a temporal decline in soil fertility. Nitrate-nitrogen (NO3) did not show significant presence during the sampling period, most likely due to the use of inorganic fertilizers; usually applied as basal dressing (20:20:0), these contain no water-soluble nitrates. The nutrient losses are indicated by the peaks in the Figure 7 below.
In monetary terms, soil nutrient losses are likely to become translated into a loss of real income and a decline in food security, particularly for the rural resource-poor whose livelihoods depend on subsistence agricultural yields.
c. Water-quality degradation
One of the MEMP's key objectives is to monitor water-quality degradation caused by soil erosion and sedimentation processes, which are themselves functions of farming practices and land use within each catchment. Results of water analyses indicate that erosion processes contributed to sedimentation of stream waters. Analysis of the samples for pesticide pollutants showed positive results for lindane, aldrin, dieldrin, heptachlor, heptachlor epoxide, and DDT (Figures 8 and 9, and Table 2). Levels of these agrochemicals were found to exceed World Health Organization standards for drinking water, indicating a residual water pollution hazard.
Since pesticides can persist in the soil for many years, the residues detected may be associated with pesticide applications of past as well as of the current years. Such residues could exert adverse effects on ecosystems by creating disequilibria in (1) food chains, (2) ecological linkages such as scavengers, parasites, and insect-host relationships, and (3) other biological processes, posing carcinogenic and teratogenic risks to humans.
The persistence of pesticides is a significant finding that requires further research and long-term observation. The issue will be readdressed this year by sampling of groundwater from protected, shallow wells.
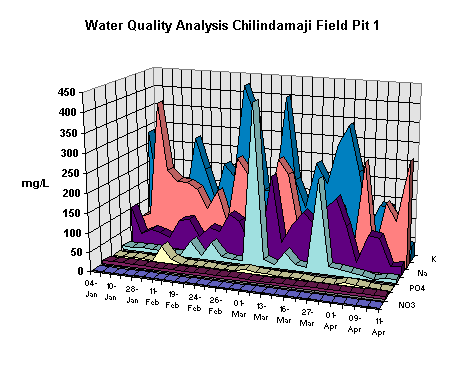
Figure 7. Soil nutrient losses by month in Chilindamaji, Pit 1 (burley).
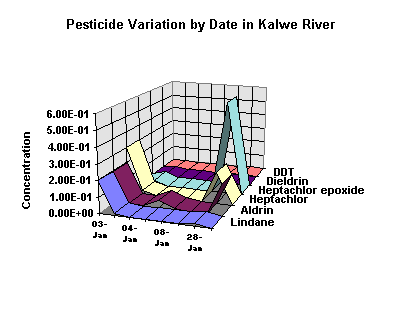
Figure 8. Pesticide variation by date in Kalwe River, Nkhata Bay.
Table 2. High and Low Pesticide Levels Compared with WHO Drinking Water Standards
|
Pesticide |
Lindane |
Aldrin |
Heptachlor |
Heptachlor Epoxide |
Dieldrin |
DDT |
|
WHO standards |
2.00 |
0.03 |
0.03 |
0.03 |
0.03 |
2.00 |
|
High |
200.00 |
200.00 |
300.00 |
10.53 |
10.00 |
3.50 |
|
Low |
0.56 |
0.39 |
0.53 |
0.00 |
0.00 |
0.00 |
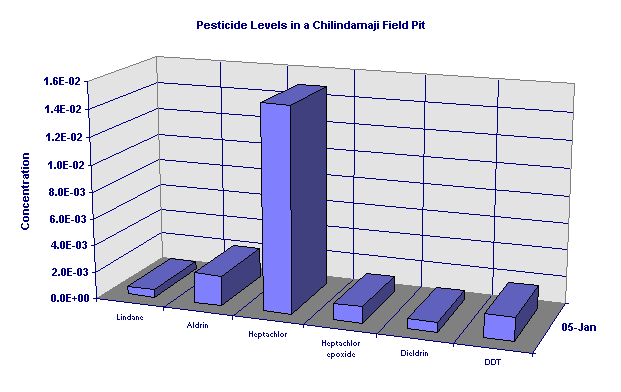
Figure 9. Occurrence of pesticides in a field pit at Chilindamaji, Nkhata Bay.
The small size of the catchments focuses on the issue of scale in environmental monitoring. During the first phase of the MEMP, participating agencies received training in monitoring possible future climate change over southern Africa with its implications for food security. Examples of monitoring forest resource decline at a national scale were also explored, using NDVI data made available through the Meteorology Department or the Famine Early Warning System. The development of a method to extrapolate environmental data from the catchments to representative regions within Malawi is now necessary. Such a capability will be a major component of MEMP's second phase.
While each GoM agency involved in the MEMP had specific needs, many were unfamiliar with GIS and the kinds of analytical capabilities required to support the MEMP's monitoring activities. Consequently, an additional set of analytical requirements were deemed to be essential to support MEMP:
·
Multi-Date Change Detection, in support of monitoring activities. Since many of the data sets were envisaged to be quantitative in nature, procedures for the distinction between true change and natural variability was a strongly needed component. Similarly, analyses with strong statistical foundations were required.·
Time Series Analysis, in support of monitoring activities. Emphasis was placed on the extraction and identification of significant trends.·
Multi-Criteria/Multi-Objective Decision Analysis to enhance resource allocation strategies associated with mitigation procedures.·
Error Analysis and Risk Assessment. In all contexts there is an important relationship between data quality and decision risk. In developing nations, however, where data resources are limited, this is especially important. Lower-quality data can be effective in decision-making contexts if error levels can be quantified and propagated in analytical procedures. Emphasis was thus needed on simple and cost-effective post-mapping assessment procedures, propagation techniques, and risk assessment procedures.Given these more general needs, agency-specific requirements identified during this initial stage of the MEMP included the following considerations:
1. Ministry of Research and Environmental Affairs
MoREA constituted a logical demand-point for GIS given that it has been identified as the agency responsible for (1) coordinating MEMP activities, and (2) summarizing and reporting on the results of data products and analyses conducted by the line agencies. In addition to general competency with the use of GIS and related technologies (GPS and Remote Sensing), MoREA staff must be proficient with analytical procedures, particularly in the context of the statistical analysis of spatial phenomena.
In the context of the burley monitoring project, DoF was charged with monitoring changes in forest resources related to wood use in the burley curing process. As a consequence, emphasis was placed on the use of high-resolution satellite imagery and GIS as a low-cost forest mapping technology. DoF also expressed an interest in the ability to use GIS to help map plantation resources based on surveyors records. Also included were procedures for forest change mapping including change related to both clear-cut and thinning procedures.
3. Land Resources and Conservation Branch, Ministry of Agriculture
LR&CB is the primary agency responsible for landuse mapping in Malawi. In addition, the burley mapping project required that landuse maps be produced for each of the watersheds under study. As a consequence, emphasis was placed in teaching the procedures for supervised and unsupervised landuse/landcover assessment using high-resolution satellite imagery. Special attention was given to ground-truthing procedures using GPS, as well as to post-classification accuracy assessments. Assessment of the ability to detect burley tobacco and distinguish it from other crops was also conducted.
For the burley monitoring project, MET was primarily responsible for providing rainfall statistics for each of the watersheds being studied. Emphasis was therefore placed on the interpolation of point data to create precipitation surfaces. This was extended in accordance with more general departmental needs to include the use of Cold Cloud Duration (CCD) data from the Meteosat satellite to act as a predictive component in surface interpolation. Another area of significant interest to MET was the ability to monitor droughts. Thus, specific emphasis was placed on Change and Time Series Analysis techniques associated with the use of NDVI (Normalized Difference Vegetation Index) imagery from the NOAA satellites for the monitoring of El Niño/ Southern Oscillation (ENSO) events. This proved to be timely as an ENSO warm event (associated with drought in Southern Africa) occurred during the 1994-95 summer season.
For most contexts, it was assumed that Surveys would be the provider of topographic data. Thus, emphasis was placed on the development of digital elevation models (DEMs) and the registration of map data to the national geodetic framework. Topics covered included generation of DEMs from digitized contours, generation of DEMs from aerial photographs using PC-based analytical plotter software and image correlation techniques, polynomial-based rubber-sheet resampling techniques, datum adjustments, forward and backward projection, and georeferencing system design. As part of this work, a national level minimum error georeferencing system was designed and subjected to error analysis.
DoW was responsible for the siting of stream gauging equipment and the assessment of water quality information. Identified GIS needs included groundwater mapping and nonpoint source pollution assessment. Microcatchment analysis was also covered as part of the process of siting runoff pits. The use of CCD data to estimate rainfall was also of significant interest to this group because of the need to estimate direct recharge into Lake Malawi.
DoF was not originally envisaged as a participant in the MEMP, but was later brought into the program because of the importance it plays in regulating Malawi's environment. DoF is primarily responsible for managing the nation's largest natural resource, Lake Malawi. Their main activities are the management of fish habitat and stock, and fishing rights. DoF has found it difficult to maintain an information base on the lake, and it is therefore keenly interested in using automated procedures to facilitate this process.
The purpose of this component is to develop participatory environmental monitoring methods for assessing change as experienced by local communities. The information obtained from this exercise could (1) assist participatory approaches to sustainable development, and (2) provide environmental information to the largest group of environmental managers in Malawi, the smallholder farmer. A study was initiated to determine the feasibility and mechanism by which farmers could collect environmental data on their own, data that would be relevant to their seasonal farming activities. Surveys were completed in four MEMP catchments which provide information on farmers’ perceptions of the cause of environmental change.
Indicators used by farmers include crop pests, wild plant availability, subsistence products such as thatching grass, building poles and fuelwood, crop varieties and rotations, dominant weed species, and termite species. Two indicators used widely by farmers are (1) diminishing soil fertility and rainfall as mirrored by falling crop yields, and (2) declining water levels in streams and wells. There is clear evidence of gender-differentiated indicators of natural resource change; women observed environmental change differently from men, both in individual communities and across catchments. Women were particularly ill-informed about the causes and subsequent environmental effects of the depletion of natural resources, a shortcoming closely allied with female illiteracy and low (or no) levels of formal education.
Agricultural intensification, though not quantified, is occurring because of increasing population densities, and is characterized by (1) shorter rotations and/or fallow periods, and (2) increased intercropping. The study did not consider whether intensification might also include increased rates of adoption of soil- and water-conservation practices. Harvest shortfalls are increasing, as summarized in the socioeconomic survey (Annex 3), with farmers looking to the remaining woodlands and dambo areas for salable timber, charcoal, vegetables, and reeds.
One significant finding of the participatory survey is that in many areas, people seeking information depend less on community-level authorities and sociocultural organizations than do their counterparts in other southern African nations. Such apparent autonomy may be a relict of the previous political system. Regardless of its origin, however, it must be considered in each of the many proposals for community-based development in Malawi.
It is generally assumed that changes in policy result in concomitant changes in environmental management and quality. That this has not been evidenced in Malawi requires donors and the GoM to recast their strategies. One avenue that might be pursued in coming to grips with the social construction of authority is the undertaking of research to gain a broad understanding of the economic and political history of Malawi as these affect resource use.
Due to the highly variable socially-differentiated indicators that the survey produced, it is not clear what is the most appropriate approach to take in developing a participatory environmental monitoring system to complement the computer-based system proposed for GoM agencies. Monitoring change in natural resources provides an opportunity for community education that could result in people's deeper understanding of environmental processes. The information so gained could be used to influence productivity and resource planning, and may assist extension planners as they strive to understand the logic behind farmers' resource allocation decisions. We therefore propose a follow-up to the original survey so as to solicit ideas from individual farmers. We also suggest that informal surveys in the catchments be administered, with information obtained used to refine the indicators list as a function of both the catchment and the specific farming system.
One of the difficulties that has been clarified by the participatory surveys is the level of misunderstanding that underlies problems in communication between local inhabitants and (for example) the forestry service in its attempts to establish participatory forest conservation. With little cognizance of the social dynamics of environmental change or a local lexicon to describe such change, policymakers often fail in their attempts to enroll local people in mitigative or preventative projects. At the very least, findings presented to local land managers (i.e., the farmers) must be reported in ways that listeners can understand and act on. This mandates the utilization of local terminology, while at the same time maintaining a user-friendly perspective that takes into account local values.
This component existed in Phase I, but languished. The Small Grants project will be resuscitated in Phase II, in which the person filling the Environmental Scientist position will make sure that the fund is actively used by MoREA and the University of Malawi.
Environmental management is often based on uncertainty and incomplete information concerning environmental issues, and therefore requires an adaptive approach. The following subsection discusses the assumptions inherent in forecasting changes in land use patterns following policy liberalization.
1. Land Use Response to Policy Changes
With a number of policy driven development programs anticipated under the Natural Resources Management and Environment Support Program (NATURE) and the Environmental Support Program (ESP), it is appropriate to discuss a suitable framework for analysis of not only the specific issue of liberating smallholder access to cash markets, but other policy reform issues with environmental implications as well.
There is little question that there is considerable anthropogenic environmental change in Malawi. What is often difficult to understand is why this is occurring and what can be done about it. There are several simple models that might be applied in analyses of these various linkages. We depict three of these simple models (a – c) first, then introduce a fourth (d) that we propose using in the next phase of the MEMP.
a. The Vicious Circle or Downward Spiral model
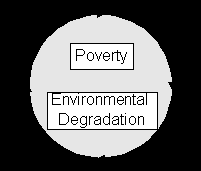
Figure 10. The Vicious Circle model linking poverty and environmental degradation.
Poor households in Malawi often find it difficult to meet their basic human needs. As a result of the limited options available to them, they are often forced to overuse natural resources, thereby degrading the resource base. The resulting degradation further limits the ability of people to break free of their over-dependency on natural resources, and will result in the perpetuation of poverty. The model illustrated by Figure 10 has been termed the ‘vicious circle,’ due in part to what is viewed as a direct link between poverty and environmental degradation. Increasing poverty drives further degradation, which leads to continued poverty.
Concern has been voiced, therefore, that a development program attempting to address poverty issues but reliant on the increased use of the natural resource base might actually accelerate the ‘downward spiral’ of environmental degradation and possibly exacerbate poverty over the long term. This concern was the initial impetus for the monitoring program now known as the MEMP.
The original program design of the MEMP focused on the status of the natural resource base in the circular model. With the inclusion of the socioeconomic baseline studies carried out by HIID, MEMP has been able to provide information on the relative change in wealth of smallholder farmers who adopt burley cultivation.
b. The Environmental Entitlements model
The ‘vicious circle’ or ‘downward spiral’ model, has been criticized because it assumes that farmers do nothing, or sit idly by, in the face of accelerating environmental change. The model reflects neither farmers' survival strategies nor their ability to adaptively manage natural resources in the face of change. The ‘environmental entitlements’ model considers three additional factors, all of which are interlinked: (1) the status of the natural resource base, (2) farmers' ability to manage these resources, and (3) how the first two listed items change over time.
The MEMP is providing tools for monitoring the status and change of the environmental resources in Malawi. With the inclusion of the pilot programs proposed during the past year, such as the Farmer-Based Monitoring component, information on the ability of resource-poor farmers to manage their resource endowment could also be provided. Refinements to this model can be made via the additional use of transects and participatory surveys to ascertain indigenous knowledge and practices within Malawi.
c. The Web of Causation model
The ‘environmental entitlements’ framework departs from the simple cause-and-effect relationship of the ‘vicious circle’ model, but it may itself be an oversimplification of the complex issues surrounding environmental degradation. Numerous complex diagrams exist, including the Nexus of Environmental Degradation in the National Environmental Action Plan (Government of Malawi, 1995), which in their attempts to show all the interactions creating degradation often make it difficult to perceive the underlying causes. A simpler diagram is presented in Figure 11, one that incorporates the economic, social, and political factors known as the structuring processes. These processes may have significant, but often overlooked, impacts on why farmers are/are not able to successfully adapt to environmental change.
Figure 11. The Web of Causation model linking poverty and environmental degradation.
As discussed above, the number of smallholder farmers adopting burley cultivation during 1993-1995 was less than anticipated, and resulted in a significant program modification in August of 1994. Analysis of some of the structural processes in the ‘Web of Causation’ model may reveal the reasons for the cautious approach taken by many smallholder farmers in reacting to this policy issue, and may shed light on how they may react to proposed programs under the ESP.
d. The Environmental Cascade model
The Environmental Cascade model continues to enhance the level of complexity inasmuch as (a) the factors contributing to the Vicious Circle model are identified, and (b) the opacity of the Web of Causation model's socio-economic factors (hitherto simply a ‘black box’) is made transparent. Central to the construction of this model is the earlier work of Prof. C.F. Hutchinson and his model of household options (formerly known as "coping strategies") when faced with food insecurity. The fundamental thesis of the Environmental Cascade model is that each household option has a concomitant environmental impact. The level of difficulty in returning to the status quo ante is represented by the slope of the curves in Figure 12. As this tangent increases, households become more and more stressed, while environmental security cascades into realms increasingly difficult to reverse. Once households descend past the horizontal line bisecting the food security quadrant, they become enmeshed in a cycle of poverty from which it is difficult to extract themselves without externally-provided assistance.
The Environmental Cascade model can be used to predict where environmental degradation is likely to occur. In addition to monitoring environmental indicators themselves, the monitoring and identification of their precursors – household indicators of stress – will allow more-timely intervention and mitigation strategies to be devised. On a nationwide basis, existing datasets – such as those collected by FEWS – can thus be used to target locales requiring intensive monitoring activities. Such an approach dovetails with one of the MEMP's policies, which is to make maximal use of prior datasets.
Figure 12. The Environmental Cascade model linking poverty and environmental degradation.
1. Forms of Environmental Management
Environmental management involves three different actions taken either separately or in concert.
· Preventive actions seek to avoid future damage to environmental systems. Example: many areas in northern Malawi as yet not impacted by expanding agriculture or demographic pressure.
· Mitigative actions reduce or soften the impact of activities that would otherwise become damaging to environmental systems. Example: increasing pressures on natural resources around protected areas in Malawi’s Forest Reserves and National Parks.
· Remedial actions where prior damage is repaired, and the health of systems restored. Examples: many areas in southern Malawi; those regions impacted by refugees during the 1980s and early 1990s; and current concerns over increased sedimentation of the mid-Shire River drainage system.
The four small 1000 ha microcatchments are not representative of any one specific agroecological zone, but offer instead the potential to model different environmental management options. The Ntcheu site has been degraded by Mozambican refugees, and offers the potential to monitor environmental rehabilitation efforts. The Mangochi site faces multiple land and resource allocation issues; these present options for developing strategies to contend with migration resulting from increasing demographic pressure on the land base. The Chulu site shares a border with a protected area, and can be used to evaluate the impacts of increasing use of natural resources in protected areas. The Nkhata Bay site still has approximately two-thirds of the total area under woodland cover. Different approaches to participatory landuse planning for sustainable development could be monitored in this catchment.
Future monitoring sites would be based in areas where soil and water management and conservation interventions are on-going or planned. This would have the dual advantage of measuring the effectiveness of mitigation interventions while demonstrating to local resource users the advantages of adopting soil and water conservation practices.
3. The Need for an Adaptive Approach
Due to the modifications and adaptations made in the technical procedures to accommodate the limited number of smallholders moving into burley tobacco production, the first year's data collection exercises must be considered to largely be a learning experience. Some inferences concerning general trends may be made from the preliminary findings, but with limited confidence because of data quality issues.
The level of effort to develop baseline maps in the current catchments is unlikely to be replicated in all eight agroecological zones or ten farming system zones as has been requested by LR&CB. Regardless of this, interest from other researchers in Malawi in replicating the baseline data in their research areas has been expressed.
Integrating geographic data technologies with farmer-based monitoring still makes sense, and is one of the innovations of the MEMP. In order to link monitoring with mitigation, the agents of change must be incorporated into the planning process. The logical step is to evaluate the responses of the communities to the proposals made in the Environmental Indicators and Change report (Annex 1). There is some concern that the concept may be ahead of its time in Malawi. If this is the case, a more passive monitoring and reporting system will be more appropriate.
4. The Value of a Decentralized Approach
The use of remotely-sensed data in several line ministries (Section IV.C) has provided these agencies with the opportunity to monitor environmental change at regional, as well as national, levels. Landuse participatory planning and analysis targeted at specific local conditions has now become possible.
5. The Imperative of a Participatory Approach
There are scores, if not hundreds, of examples of failed development projects scattered all over the developing world. In many cases, the projects collapse once the technical experts or foreign advisers leave because local people do not perceive how the proposed development can benefit them directly. A participatory appraisal, coupled with participatory project design and implementation, invests local people in their own futures and assures them that their concerns are being considered and included. While not a panacea for guaranteed project success, projects will almost surely failed in the absence of a participatory approach.
As in any long-term program, staffing is always in a state of flux. However, this problem is particularly acute in the case of our Malawian colleagues, where the problem is exacerbated by the shortage of trained personnel (refer to Subsection 3 below).
2. Experience in the Environmental Sciences
One of the difficulties in project implementation became noticeable only after some time had elapsed: It became clear that Malawians have not had the training in, exposure to, or practical experience in the environmental sciences necessary to develop the comprehensive strategies required to address the environmental problems facing the country. Rather than obtaining a general level of understanding regarding cause-effect links and problem-solution sets, single solutions are often sought to what may be multi-causal problems.
3. Retention of Technical Personnel
How to contend with the endogenous civil service hierarchy in developing countries is a problem common to many development projects. The difficulty is twofold: either personnel who need no further technical training (and who will not, in any case, work in a technical capacity, such as experienced supervisors) are assigned for training, or personnel trained by a project are immediately promoted to supervisory positions where they are unable to use their newly-acquired skills. In either event, it is difficult to retain qualified technicians at staff-level to do the real work the project requires. The civil service needs a horizontal promotions career path so that trained technical personnel can pursue and sharpen their skills rather than being relegated to administrative functions if they accept promotion under the existing system.
4. Range of Individual Capabilities
The range of individual capabilities was particularly obvious in the GIS training, where some people who were wholly computer-literate and had received prior training in international centers such as ITC, The Netherlands, were placed in the same classroom as those who had never before turned on a computer. In hindsight, this seems a singular waste of opportunities. It would have been far better to have taken those people who already possessed technical skills and to have trained them in problem-solving techniques (refer to Subsection 2 above).
5. Technical and Managerial Capacities
Effectiveness in environmental management and planning is more a matter of performance than of organizational placement in the structure of government. If the Environmental Affairs Division (EAD) wishes to become an effective voice for the environment, it must concentrate on developing technical and managerial competence – two areas of striking weakness at the current time. The lack of established positions within MoREA has been previously noted to be a factor hampering EAD’s ability to accomplish its mandate in the past. Similarly, the lack of technical specialists has also hindered implementation and raises questions regarding EAD’s ability to coordinate activities in line agencies that have staff with greater technical proficiencies. Steps have been taken recently to address the problem of understaffing
As of mid-1996, there were 17 EAD staff members. It is essential that recruitment and retention of staff be based on (1) the technical qualifications of applicants in accordance with clearly defined job descriptions, and (2) a coherent strategy relating staffing to organizational priorities rather than to sources of project funding. Improved management of staff and other resources is also essential if EAD is to be accepted as an equal, and authoritative, partner by line agencies and other public and private entities in Malawi.
6. Competition for Scarce Technical Resources
As donor interest in the environment increases, those civil servants who constitute the backbone of line agencies tend to be drawn into a comparatively few activities, often outside the priorities of their own agency. In effect, donors are (a) competing with each other over a limited pool of technical staff, and (b) pulling competent staff away from their functions within their agencies. The net result is that while donor-funded activities might be strengthened, the overall ability of line agencies to function effectively is diminished.
To contend with the points made in Subsection 6 above, agencies must decide where their priorities lie, and must make these explicit to donors. Such a strategy will assure the precedence of GoM internal priorities over donor priorities.
The linkage between the MEMP and the decisionmaking process was always implicit. It was assumed that the information emerging from the monitoring program would be used (1) to inform policy, and (2) to inform mitigation strategies. Because MoREA is not, in fact, a policy-implementing agency, the necessary linkages failed to materialize. The failure to link to the decisionmaking process calls for the future development of institutional mechanisms that are able to address both policy and mitigation needs. Such linkages must be applicable and useful both to decisionmakers and to line agency, field-level representatives.
Underlying the presumption that the information emerging from the monitoring program would be used in the decisionmaking process was the fundamental – and ultimately simplistic – assumption that if information exists, it will be used. New strategies must be developed, ones that clearly relate data collection to the utility and relevance of the information acquired.
The MEMP is based in MoREA, which is charged with the coordination of environmental programs by implementing agencies in other ministries and must therefore rely heavily on their technical expertise. The agencies themselves are involved in collecting and analyzing new data for the MEMP instead of relying on existing or historical datasets as their primary sources of information. For MEMP to succeed, a high level of coordination among participating agencies is mandatory. The issue of commitment by senior managers in the line agencies should be viewed as key to the successful implementation of Phase II of the program.
Concern over the issue of commitment has led to a proposal to emphasize linking monitoring to current or proposed mitigation programs within line agencies. A closer link between monitoring and mitigation is likely to bring greater line agency commitment.
Another difficulty encountered concerns the authority of the EAD in relation to securing cooperation from line agencies. This issue of authority is tied most directly to the placement of environmental affairs within Government, and is one that emerges routinely in other countries. Until the decision to elevate EAD to department level, EAD was actually at a lower level in the public sector hierarchy than the agencies whose activities relating to the environment it was to coordinate. Even as a department, EAD lacks the hierarchical basis for requiring cooperation from line agencies that are in most cases larger, better funded, and have long histories of working with established clienteles in clearly defined sectoral areas.
Nevertheless, cooperation is best when it is offered rather than compelled, and there is at this point no reason to assume that a change in location in Government is needed for EAD to be successful. Indeed, there is little compelling evidence from other countries that placement under a nonsectoral structure, such as the Office of the President or Vice President, or establishment as a parastatal outside of traditional public sector structures and procedures, necessarily results in an improved ability to execute policies and improve environmental planning and management at all levels within the country. Technical competence of the responsible agency, its ability to provide valued services to public and private sector entities alike, adequate financing, and high level political support are all factors that affect performance more directly than the simple matter of placement.
1. The Environmental Management Approach
The original MEMP design strategy, i.e., coupling intensive data collection with extensive sampling, has now become difficult to rationalize. Intensive monitoring in the five microcatchments is unsustainable, for too many opposing factors tend to intrude. Nor is it now practical to consider extensive sampling over the entire country. Instead, one important factor to emerge from monitoring in the five watersheds is that the expertise now exists to monitor as necessary anywhere in the country.
Rather than on the one hand continuing intensive monitoring in the five watersheds indefinitely or on the other hand resorting to extensive sampling strategies, the MEMP should (1) focus on predicting where environmental problems are likely to be encountered, then (2) mobilize the capacity for pre-emptive, intensive studies. Given the existing limitations in budget, mandate, and human resources, such an approach is appropriate.
a. Linking monitoring with research
As it is not yet clear how decisionmakers will respond to the MEMP, it is recommended that in the short term a greater effort be made to link the current environmental monitoring technologies with similar research at the Bunda College of Agriculture, ICRAF, and the Malawi Agroforestry Project. These programs have existing data gathered from similar agroecological zones, from catchment transects, and from village resource-mapping efforts. Further evaluations of the participatory approach (the farmer-based system) can be achieved by working with the already-existing farmer groups available through other programs.
b. Demonstration plots for extension
Greater attention must be paid to coupling the GIS thematic maps, field pits, and control plots with both formal and informal extension messages and programs.
c. Technology transfer
Within each of the agencies involved in the MEMP, a number of products were identified as suitable for development in operational settings. Examples include topographical and infrastructural data, coordinated climatological data, land cover and land use data, etc. It is envisaged, therefore, that specifically-targeted assistance using GIS and related technologies, coupled with services that can be provided by short-term technical experts, will facilitate the development of these products. The products themselves will form the foundation for a National Mapping Program that will serve as the precursor to the planned EIS.
d. Farmer participation
Of the three avenues identified as possible solutions to overcome the impediment of peasant illiteracy – currently a major constraint for participatory research and monitoring activities – one, restricting involvement to those farmers possessing literacy, is ultimately inconsistent with the goals of the MEMP. Such a restriction would preclude the participation of most women, few of whom have had the luxury to attend school. Women frequently view environmental problems quite differently than do men, and may have different ideas as to what the solutions might be and how these may best be implemented. If environmental mitigation proposals are to be accepted by the populace at the grassroots, active participation and acceptance by all societal strata must be a sought-after goal.
A second avenue, the development of a procedure that allows information to be recorded pictorially, is a viable short- to medium-term solution, one that will assuredly expand farmer participation in the MEMP. The third avenue is future-oriented; it seeks to involve literate schoolchildren, who could then assist in their parents' participation. Not only does this avenue have the advantage of including environmental issues as a school activity, but it also invests the next generation of land caretakers with a deeper appreciation of the links among farming, conservation, and their own future.
There are a number of recommendations for specific alterations to the implementation of the technology transfer component of the MEMP. These recommendations have arisen from the observations of the Clark and University of Arizona teams, input from USAID, and from the GoM following the Decision Makers' Workshop.
a. Continued sensitization
Awareness and interest in geographic information technologies has been increasing, albeit at a rate sufficiently slow as to retard the diffusion and adoption process. As a result, it has been difficult to maintain (1) a sense of commitment and continuity among the trainees, and (2) continued support from their sponsoring agencies. Although GoM officers are well trained to carry out their respective tasks, a broader level of awareness among them is needed so as to assure (1) a full commitment to participants in the technology transfer component, and (2) a more effective use of the technology within their respective agencies, both for monitoring and for basic environmental research. This could be accomplished by extending GIS training to senior-level researchers and scientists from each agency, preferably focusing on staff who are able to articulate and initiate research agendas. This would complement the currently trained technicians from MEMP I who are now able to carry out fundamental data development and analysis. Given the time constraints of the senior-level officers, the attempt should be to make them GIS literate as quickly as possible, perhaps through a two-week intensive sensitization.
One of the conclusions of the Decision Makers' Workshop concerned the need to begin sensitization and develop support at much higher political levels within the GoM. It is important that, at a minimum, the level of the Principle Secretary be made aware of GIS technology and its opportunities within the GoM. This may best be accomplished by holding a session similar in format to the Decision Makers' Workshop for such senior-level civil servants.
The first phase of the MEMP has been successful in working with government officers in the ADDs. These government officers are close to the local resource problems, and as such are better able to formulate research agendas that can immediately affect environmental monitoring and mitigation. The landuse mapping analysis and associated activities being conducted by one of the trainees, who resides in the Mzuzu ADD, will do much to increase awareness at this level. Decentralizing the technology transfer implementation process away from the departmental offices and toward the field at the ADD level is therefore a reasonable strategy.
b. Overcoming scientific and research deficiencies
One of the most significant barriers to the adoption of GIS during Phase I has been the lower-than-anticipated level of scientific and research expertise of the trainees, and their lack of capacity within their agencies to initiate, conceptualize, articulate, and conduct independent scientific research related to environmental management. Although the trainees have been adept at acquiring the fundamentals of GIS, a much broader range of skills is needed to efficiently employ these new technologies. Emphasis must be placed in Phase II on activities aimed at enhancing technical capacities within each of the participating agencies.
A long-term mechanism for addressing these deficiencies will be to institute a GIS education and training process in Malawi. At the university level, two committees, the Post-Graduate Research and the Academic Planning Committees, must be involved in any long-term curriculum planning, including the identification of suitable sites for housing a ‘GIS Lab’ and training center. During the months of August and September, University faculty are free to attend refresher courses, offering an appropriate window for training faculty in the potential uses of GIS technology. Faculty who may be suited to become GIS trainers can simultaneously be identified. However, it is clear that there is currently a lack of any local expertise to develop curricula and training programs in GIS. During Phase II of the MEMP, therefore, a long-term expatriate technical advisor/faculty member will be placed in the University of Malawi system. This person will be charged with developing the GIS curricula, research, and training programs that will ultimately create and institutionalize local-level GIS capabilities.
c. Infrastructural adjustment
A significant barrier to the continued use of GIS technology derives from the bureaucratic and financial infrastructures currently in place in Malawi's civil service. The reality is that Malawian civil servants are vastly overworked and undercompensated. This has resulted in low morale, and a high level of absenteeism (although sanctioned) to attend the many donor-sponsored workshops and training sessions. Although in general these activities offer positive contributions for government officers, their frequency has had the tendency of disrupting ongoing work assignments. The lure, of course, is the additional compensation paid to attendees. In most cases, attending a week's workshop will earn a civil servant more than a month's salary. Even more, a trip overseas can easily be equivalent to a year's salary. This has had a significant impact on the quality and quantity of routine work, as well as being detrimental to the performance of the new tasks that trainees are being asked to undertake.
Currently there is no personnel structure in place that can accommodate the technical, educational, and salary requirements of GIS analysts. This deficiency, as confirmed by GoM officers, will significantly reduce the chances for success. Government officers cannot adequately carry out these new activities without an infrastructure in place or proper compensation for employing the newly-acquired technical knowledge and expertise. To overcome this hurdle may require the creation of a professional level within the civil service, one that offers an attractive compensation and benefits package. This recommendation may be overly bold, but it is by no means out of place. The acquisition of new technologies should merit a rethinking of existing structures where necessary.
A GIS Users' Group was established early in Phase I of the project, and included representatives from each of the participating agencies and other interested departments (and even staff attached to other donor-sponsored projects). Initial interest waned as it was quickly recognized that without formal acknowledgment by the GoM in terms of financial support and bureaucratic recognition, the Group could not have enough influence. The formalization of this Group is currently on-hold, but should be encouraged for any future activities. In particular, the Group could play a vital role in the development of a suitable civil service professional grade.
2. Clearly Defined Strategies for Linking Monitoring to Mitigation
As initially conceived, the MEMP was intended to be a national monitoring system. As a result of the World Bank-sponsored National Environmental Action Plan (NEAP), considerable interest has been expressed in the extension of this activity to the development of a national Environmental Information System (EIS). The decentralized character of the MEMP is inherently compatible with an EIS, as any such enterprise will necessarily be a multisectoral effort.
However, the actual (as opposed to theoretical) situation regarding the MEMP has been much more difficult to clearly define and operationalize. The MEMP was designed to inform policy, but it had no built-in link to decisionmakers. Conventional wisdom posited that monitoring should benefit the farmers, and this led to the participatory monitoring component. However, the information that trickled up to higher echelons was rarely, if ever, put to use. This shortcoming will be redressed in MEMP II, which has a hardwired link to policymakers through the Environmental Policy Advisor position.
Even so, there is no method for the MEMP to effect action, although certainly a great deal more emphasis must be placed on ways in which recommendations arising from program activities can be reported in ways that enhance and assist the decisionmaking process. Thus, while the MEMP's primary roles are to inform policy and establish saliency, it must also (a) provide useful information to resource managers down to the level of smallholder farmers, and (b) evaluate pathways that can lead to mitigation.
Consider how the MEMP may respond to deforestation activities. Accompanying the loss of tree cover itself are two other attendant impacts that are environmentally damaging. The first is streambank cultivation, which leads to siltation of watercourses. The second is hillslope cultivation as it affects soil erosion rates. MEMP's task, as noted above, includes evaluating pathways that can lead to mitigation of the environmental damage caused by these three simultaneous and linked problems. The suite of responses might include fiscal penalties, complete exclosure, and/or agroforestry or woodlot projects, etc.. The role of MEMP II, i.e., informing policy and establishing saliency, pertains to the relative combination of these tactics that might be employed in specific geographical areas under particular socioeconomic conditions. Simultaneously, the MEMP will succeed if, and only if, it is able to generate information useful to and usable by smallholder farmers – the largest group of environmental decision makers in Malawi.