
Climate Viticulture Newsletter - 2024 March
< Back to Climate Viticulture Newsletter
Hello, everyone!
This is the March 2024 issue of the Climate Viticulture Newsletter – a quick look at some timely climate topics relevant to wine grape growing in Arizona.
IN THIS ISSUE
- A Recap of February Temperature and Precipitation
- The Outlook for March Temperature and Precipitation
- Vine Dormancy and the Start of the Growing Season
- Q & A from the Winter Viticulture Symposium
- Extra Notes
A Recap of February Temperature and Precipitation
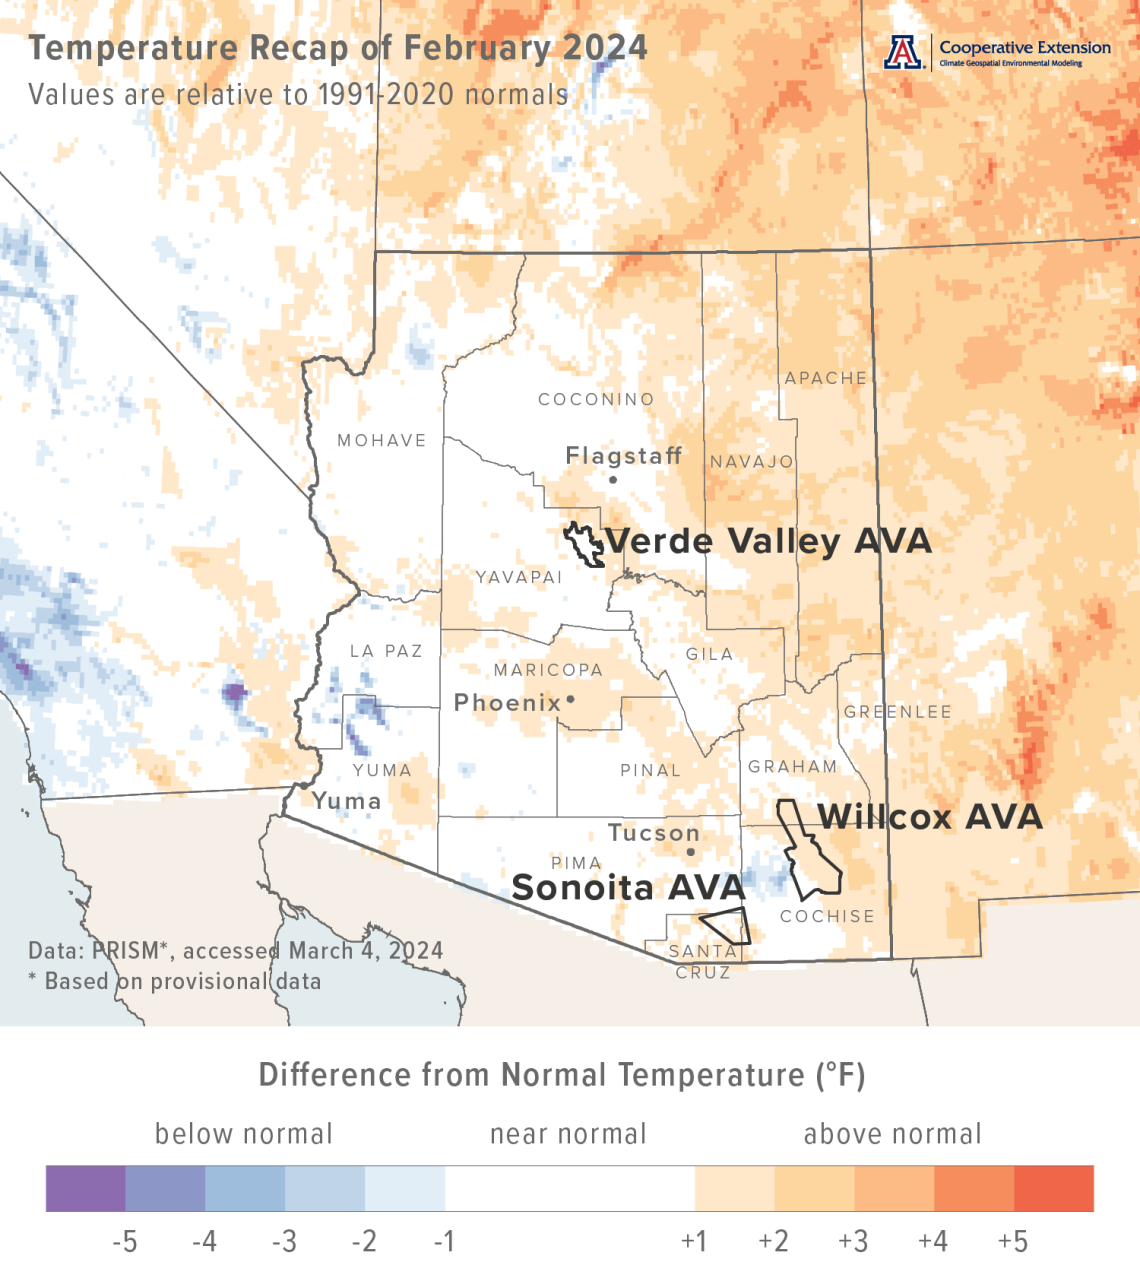
Monthly average temperatures were 1 to 3 °F above the 1991-2020 normal for many areas in the eastern one-third of Arizona (light orange and orange areas on map), including the Sonoita and Willcox AVAs. Much of the rest of the state, including the Verde Valley AVA, saw near-normal temperatures (white areas on map). For reference, monthly temperatures in February last year were 3 to 5 °F below normal for much of the southern half of the state, and more than 5 °F below normal for much of the northern half.
Area-average maximum and minimum temperatures during February 2024 were 61.5 and 34.8 °F for the Sonoita AVA, 61.1 and 34.6 °F for the Verde Valley AVA, and 62.8 and 35.3 °F for the Willcox AVA. Respective February normals are 61.2 and 33.2 °F, 61.6 and 32.9 °F, and 63.1 and 32.7 °F.
Temperature last month ranged between 78.3 and 24.8 °F at the AZMet Bonita station and between 79.5 and 26.2 °F at the AZMet Willcox Bench station.
cvn-recap-202403-tmeanDepartureNormal.png
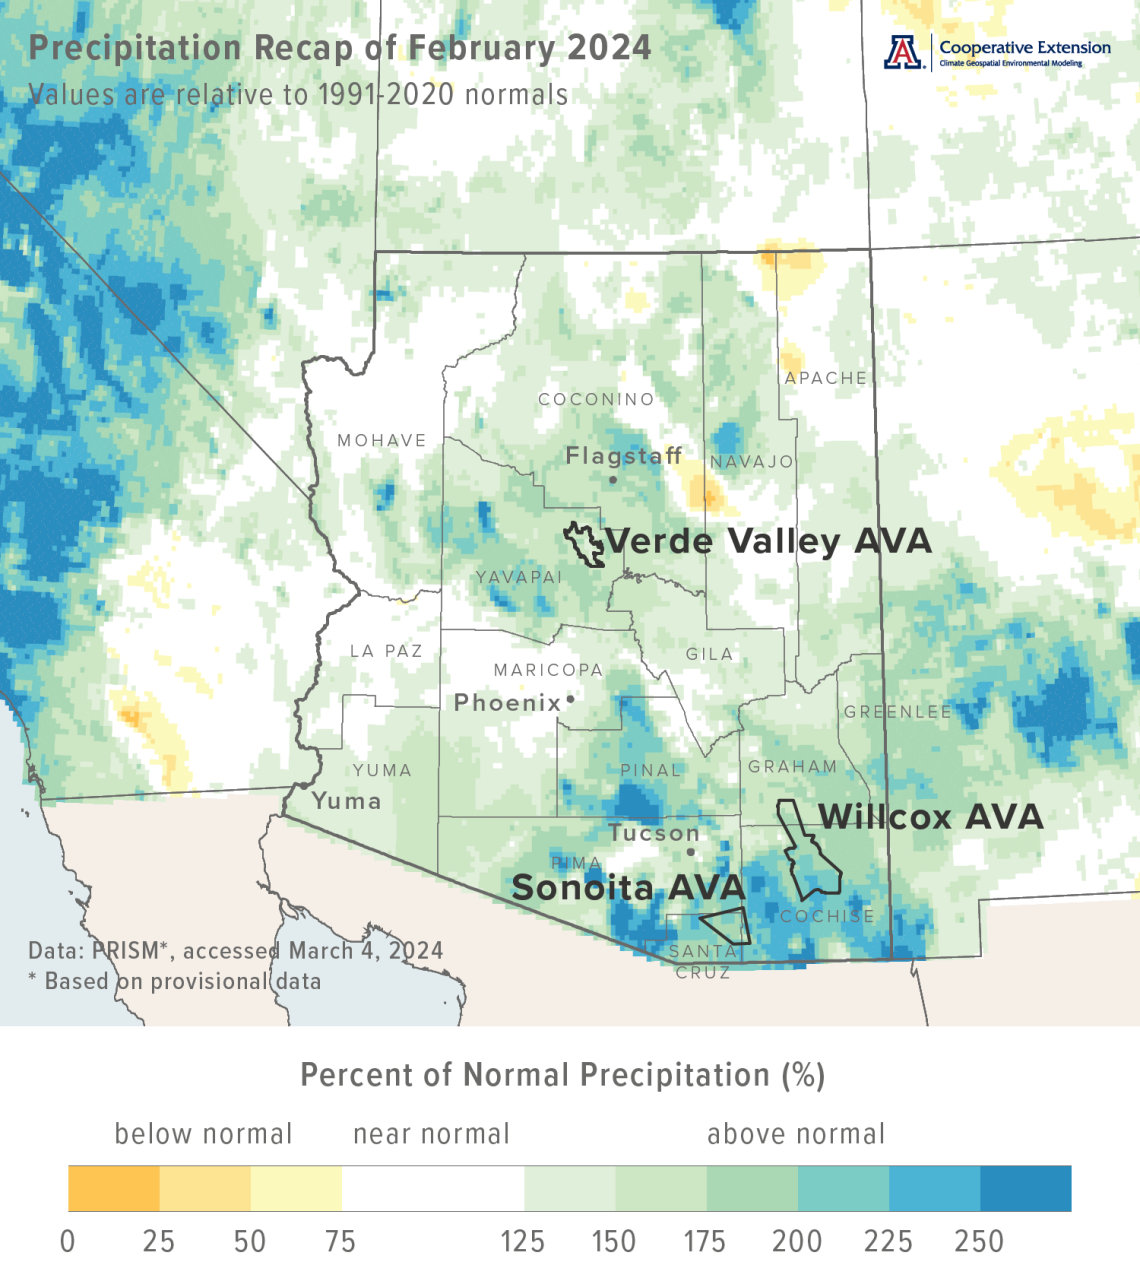
Monthly precipitation totals were more than 150 % of normal for many areas across the north-central and southern parts of the state (aqua and dark aqua areas on map), including all three Arizona AVAs. Several locations in southeastern Arizona measured amounts more than 200 % of normal (light blue, blue, and dark blue areas on map). Otherwise, totals mostly were near normal (white areas on map). Precipitation during February 2023 was less than 75 % of normal for most of the western half of Arizona, and near normal for most of the eastern half.
Area-average total precipitation in February 2024 was 2.21 inches for the Sonoita AVA, 2.28 inches for the Verde Valley AVA, and 1.80 inches for the Willcox AVA. Respective February normals are 1.12, 1.43, and 0.93 inches.
Total precipitation last month was 0.97 and 1.27 inches at the AZMet Bonita and Willcox Bench stations, respectively.
Dig further into daily weather summaries for the AZMet Bonita and Willcox Bench stations in the Willcox AVA
Learn more about PRISM climate data
cvn-recap-202403-pptPercentNormal.png
The Outlook for March Temperature and Precipitation
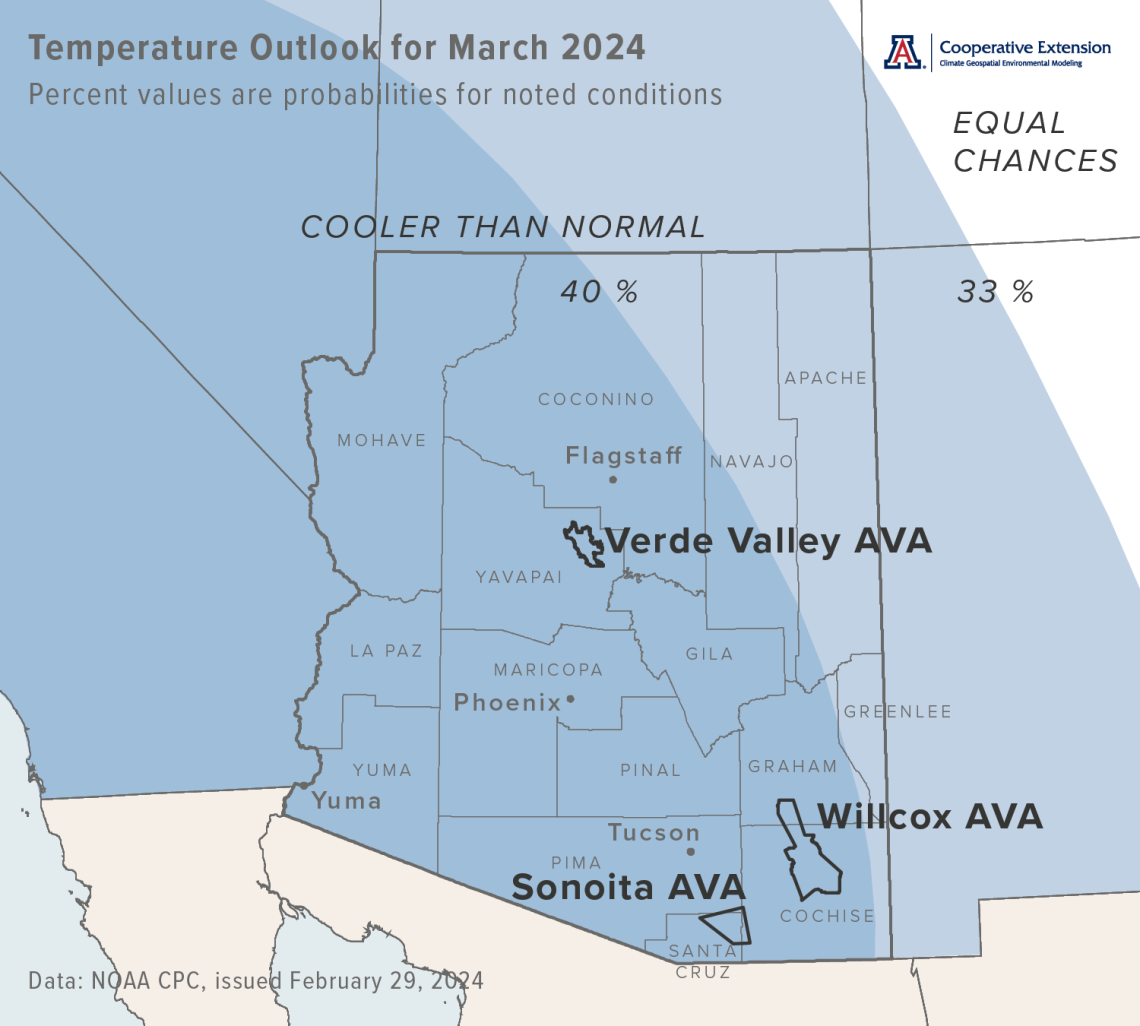
Temperatures over the course of this month have a slight increase in chances for being below the 1991-2020 normal across all of Arizona (light blue and blue areas on map). Monthly temperatures in March last year were 1 to 4 °F below normal for much of the southeastern and east-central parts of Arizona, and more than 4 °F below normal for much of the rest of the state.
Area-average maximum and minimum temperatures during March 2023 were 63.8 and 35.0 °F for the Sonoita AVA, 60.2 and 35.2 °F for the Verde Valley AVA, and 65.9 and 35.7 °F for the Willcox AVA. Respective March normals are 67.1 and 36.9 °F, 68.0 and 37.6 °F, and 69.4 and 37.1 °F.
Temperature in March last year ranged between 76.8 and 20.3 °F at the AZMet Bonita station and between 78.4 and 21.9 °F at the AZMet Willcox Bench station.
cvn-outlook-202403-temp.png
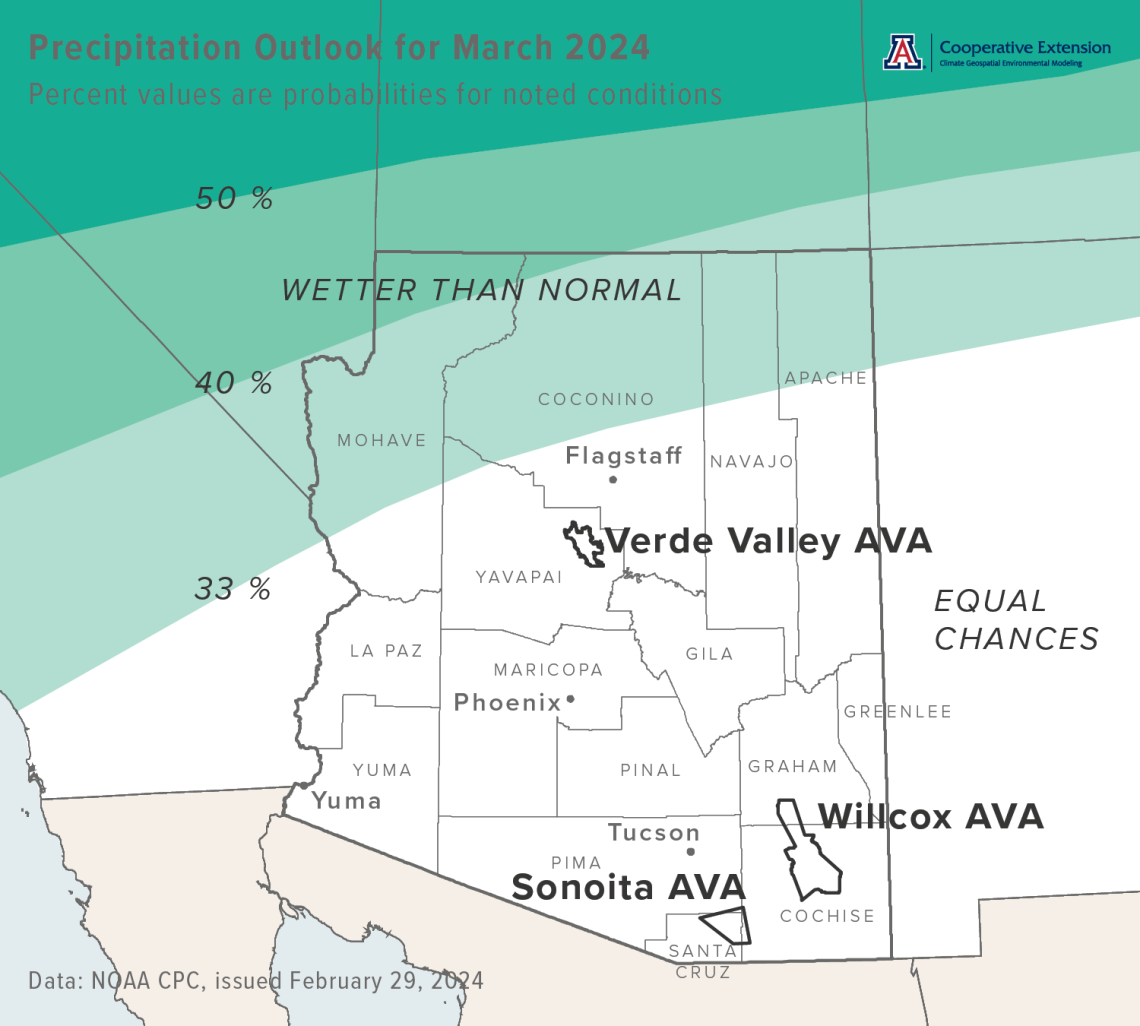
Precipitation totals for this month have a slight increase in chances for being above normal across the northern tier of the state (light aqua and aqua areas on map). For the rest of Arizona, there are equal chances for below-, near-, or above-normal totals (white area on map). Precipitation during March 2023 was more than 200 % of normal for many areas in the northern half of the state, transitioning to totals between 50 and 75 % of normal in the southeastern part of the state.
Area-average precipitation totals in March 2023 were 0.65 inches for the Sonoita AVA, 3.13 inches for the Verde Valley AVA, and 0.52 inches for the Willcox AVA. Respective March normals are 0.97, 1.31, and 0.76 inches.
Total precipitation in March last year was 0.31 and 0.18 inches at the AZMet Bonita and Willcox Bench stations, respectively.
To stay informed of long-range temperature and precipitation possibilities beyond the coverage of a standard weather forecast, check in, too, with the six-to-ten-day outlook and eight-to-fourteen-day outlook issued daily by NOAA’s Climate Prediction Center.
cvn-outlook-202403-prcp.png
Vine Dormancy and the Start of the Growing Season
Although it’s been about a year since we last visited this topic, you’ll likely recall that deacclimation kinetics are related to how chill accumulation, dormancy state, and temperature affect the loss of cold hardiness and timing of bud break in grape vines. It also is an explanation for why relatively lower (higher) heat accumulation is needed for vines to start the growing season during winters with relatively higher (lower) chill accumulation. In previous spring newsletter issues, we leveraged this relationship between these two measures related to vine dormancy with past 'analog' years to estimate when bud break might occur.
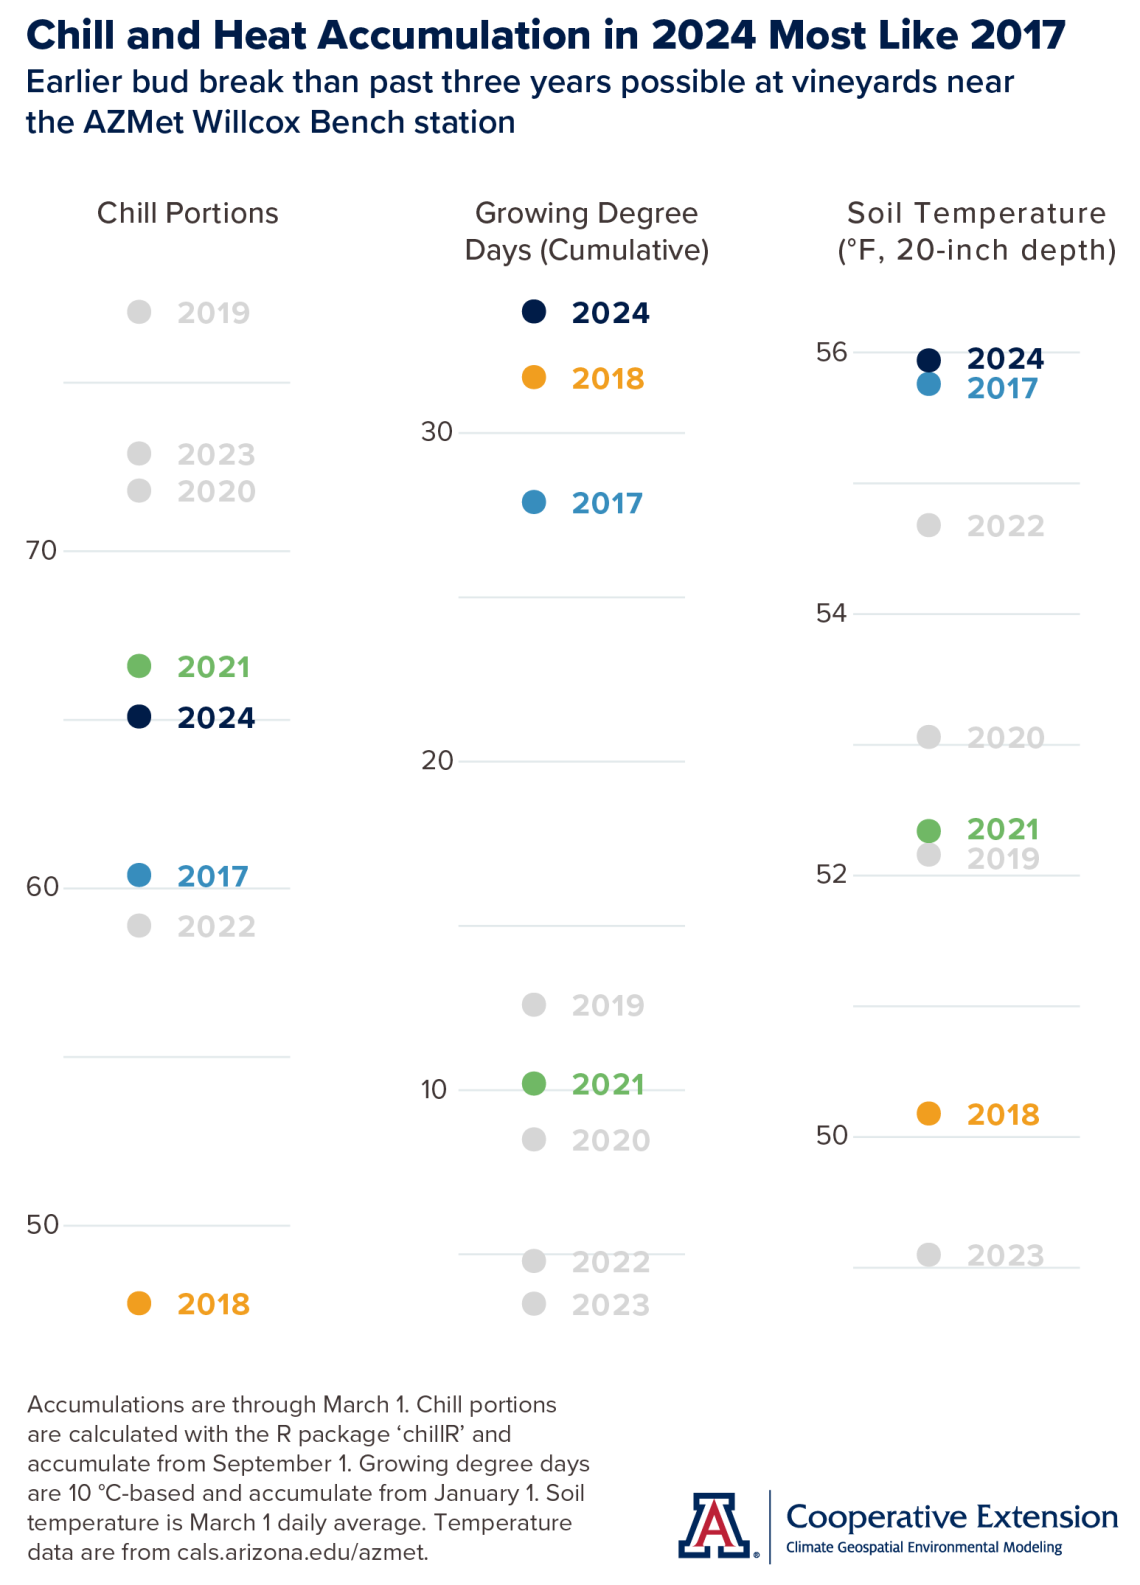
Temperature conditions at the AZMet Willcox Bench station in the south-central part of the Willcox AVA so far this dormant season have resulted in cumulative chill portion values that are near average (dark blue dot in left graph). Since station records began, values have been higher in four other years and lower in three. Values this year are closest to those in 2021 and 2017 (green and blue dots, respectively, in left graph). Cumulative growing degree day values, in contrast, are among the highest in station history, closest to those in 2018 and 2017 (dark blue, orange, and blue dots, respectively, in middle graph).
As soil temperature sometimes is part of the discussion about the start of the growing season, we show those data, as well, in the graph on the right. Values this year are among the highest in station history, closest to those in 2017 (dark blue and blue dots).
Based on this, timing of bud break in 2024 looks on track to be most like that from spring 2017, and earlier than that from the past three years, at least at this location.
cvn202403-chill-heat-accumulation.png
Q & A from the Winter Viticulture Symposium
This month, attendee questions from the recent Winter Viticulture Symposium about Arizona climate and wine grape growing center on extreme and record-setting conditions in recent vintages, and those anticipated in future ones as climate change continues. Although there were questions several along these lines, we only address a few that cover the extent of these topics.
What are the best practices and strategies for mitigating extreme weather? Arizona is not unique among global wine-grape-growing regions when it comes to excessively hot temperatures during the growing season and ripening in particular. Responses to such conditions aim to prevent or reduce detrimental impacts on vines and fruit, like severe water stress and lower quality, and range figuratively in the vineyard from head to toe: improving soil health; optimizing soil moisture; planting drought- and heat-tolerant rootstocks and scions; managing canopies to adequately shade the fruit zone; further protecting vines and fruit with kaolin clay and shadecloth; and delaying ripening until relatively cooler conditions by delaying bud break.
Arizona becomes more unique, however, when it comes to excessive rainfall at this time of year. Few previous responses, like optimizing soil moisture, may apply here, along with other ones like: planting varieties with loose clusters and resistance to fruit rot; and managing canopies to allow fruit zones to dry out after monsoon storms. Despite many potential ways to mitigate excessive heat and moisture, specific recommendations for Arizona viticulture may not yet be fine-tuned, may vary between growing areas, and may differ between growers with different production goals. Furthermore, responses to excessive heat may not help matters when contending with excessive rain. Delaying ripening until relatively cooler conditions may require a grower to successfully get fruit through more of the monsoon and the challenges it brings.
What varieties will thrive here as our climate changes? One answer to this is to note which varieties did well, and not so well, in recent vintages, whether from fruit quality or composition standpoints. From 2020 through 2023, the sequence of ripening conditions could qualify as ‘weather whiplash’, a phrase used to describe a quick change from one set of extremes to an opposite set, particularly for the Sonoita and Willcox AVAs. Regardless of such conceptualization, this volatility is in line with the expectation for a more variable and extreme summer climate both now and in the coming years. For Arizona viticulture, performance of varieties during these vintages may suggest what their role might be in monsoon hedging and be an indication of their future viability.
What additional measures can we take in a new vineyard? Site selection and vineyard design add to and are linked to some of the general recommendations above. For example, an adequate water supply and irrigation system helps with optimizing soil moisture. An eastern- or northern-facing aspect, or the cardinal direction a slope faces, typically is cooler than southern- or western-facing ones. Row orientation, in combination with canopy management, can help determine when fruit receive direct sunlight.
Extra Notes
The Water Resources Research Center at the University of Arizona recently published a Water Factsheet for Santa Cruz County, where almost all of the Sonoita AVA is. The factsheet includes topics like water supply and demand, sustainable water management, and the significance of the Santa Cruz River.
ADWR (Arizona Department of Water Resources) recently released the first of its Supply and Demand Assessments, examining groundwater status in all 51 basins across the state. Results are available through a new web site and interactive dashboard.
Continuing from the last couple of months, different influences seem to be acting on where the storm track will track over North America – and if it will track over the Southwest – during March, including the ongoing-but-weakening El Niño event and other global climate phenomena like the Madden-Julian Oscillation. Regarding the former, there is a 79 % chance that it concludes during the April-through-June timeframe. Odds have increased to 55 % that La Niña conditions take hold across the tropical Pacific Ocean during summer.
For those of you in southeastern Arizona, including the Sonoita and Willcox AVAs, Cooperative Extension manages an email listserv in coordination with the Tucson forecast office of the National Weather Service to provide information in the days leading up to agriculturally important events, like spring freezes and high-wind days. Please contact us if you'd like to sign up.
And for those of you in north-central and northeastern Arizona, including the Verde Valley AVA, Cooperative Extension also now manages an email listserv in coordination with the Flagstaff forecast office of the National Weather Service to provide similar information for this part of the state. Please contact us if you'd like to sign up.
Undergraduate students in the College of Agriculture and Life Sciences at the University of Arizona are looking for internships with businesses and companies in the viticulture and winery industries. Please contact Danielle Buhrow, Senior Academic Advisor and Graduate Program Coordinator in the Department of Agricultural and Resource Economics, for more information.
Please feel free to give us feedback on this issue of the Climate Viticulture Newsletter, suggestions on what to include more or less often, and ideas for new topics.
Did someone forward you this newsletter? Please contact us to subscribe.
Have a wonderful March!
With current and past support from:

