
Climate Viticulture Newsletter - 2021 June
< Back to Climate Viticulture Newsletter
Hello, everyone!
This is the June 2021 issue of the Climate Viticulture Newsletter – a quick look at some timely climate topics relevant to winegrape growing in Arizona and New Mexico.
A Recap of May Temperature and Precipitation
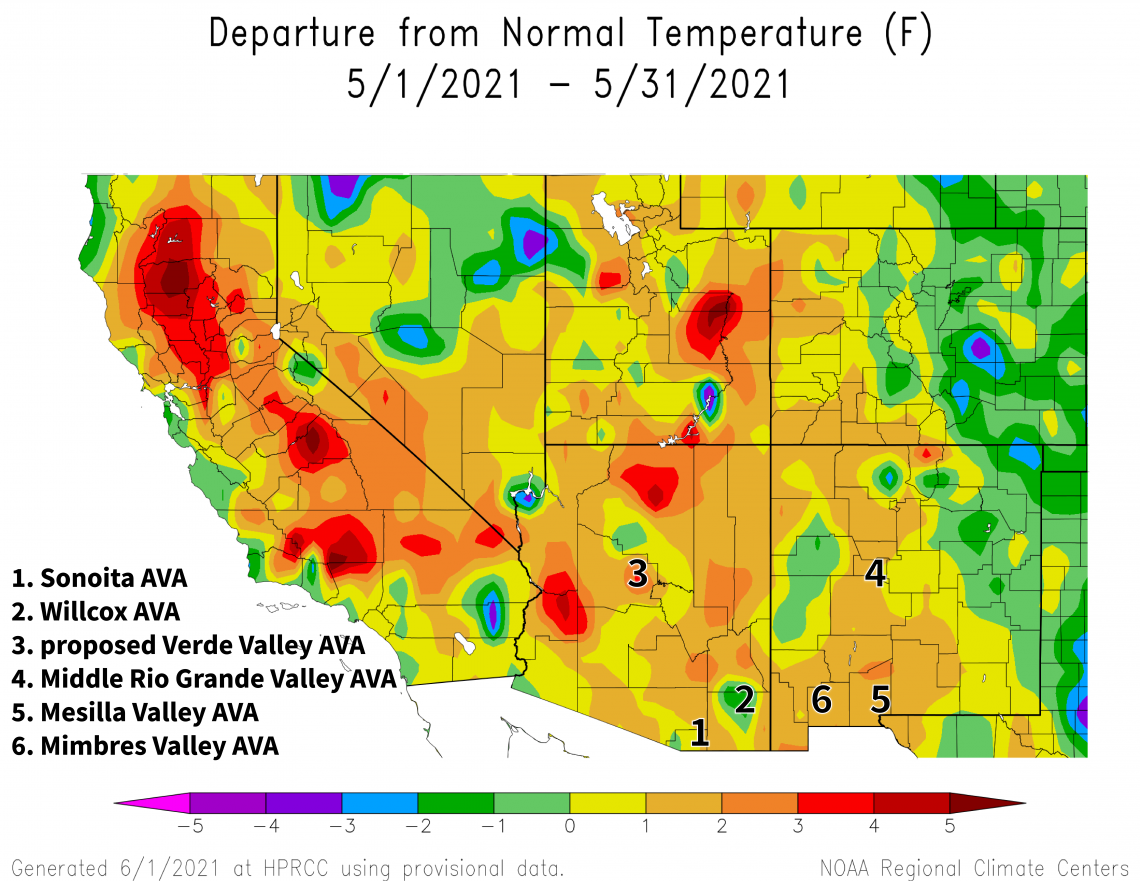
Temperatures last month were 1 to 3 °F above the 1991-2020 normal for much of Arizona and the western half of New Mexico (light and dark orange areas on map). Otherwise, temperatures largely were within 1 °F of normal for both states (green and yellow areas on map). As a comparison, temperatures for May last year were 2 to 4 °F above the 1981-2010 normal.
Being more on the warm side than not, temperatures last month may have made for relatively shorter interphases – the time between growth stages – during this first half of the growing season. We look at some of the details of this below.
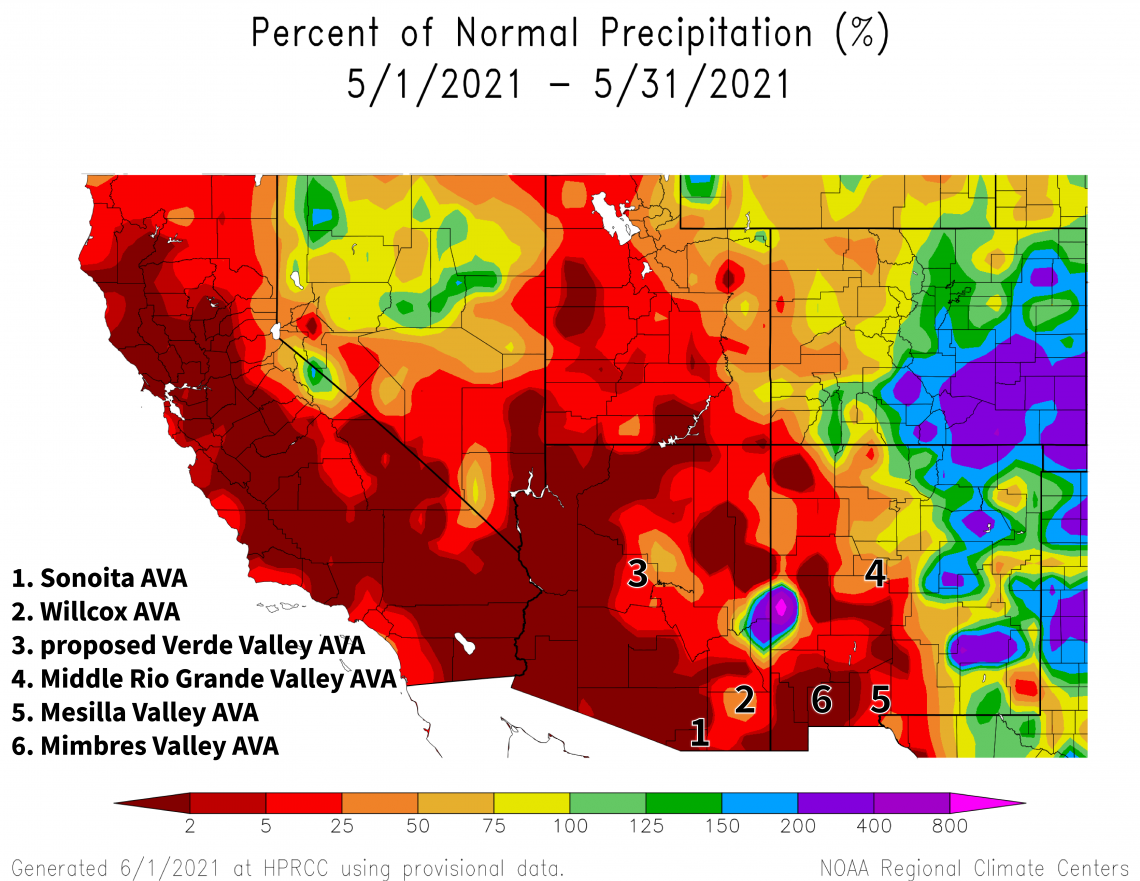
The spatial pattern of precipitation anomalies last month closely follows that which we just saw with temperature. Monthly totals less than 50% of the 1991-2020 normal cover almost all of Arizona as well as the western half of New Mexico (dark orange and red areas on map). Benefiting from the storm season of the southern Great Plains, the eastern half of New Mexico received amounts near or up to 200% of normal (yellow, green, and blue areas on map). Precipitation totals in May last year were less than 50% of the 1981-2010 normal for almost all of both states.
Apart from the eastern plains of New Mexico, May is another month during which we don’t expect much rainfall in the region. Although that may make some of the dry anomalies less grim, it doesn’t make for any improvement in the ongoing regional drought conditions. Many locations in the region continue to rack up records, posting once again, for example, another driest 12-month period. As conditions like these might increase reliance on irrigation, soil salinity may become an issue, particularly if the groundwater used for irrigation is saline.
View more NOAA ACIS climate maps
The Outlook for June Temperature and Precipitation
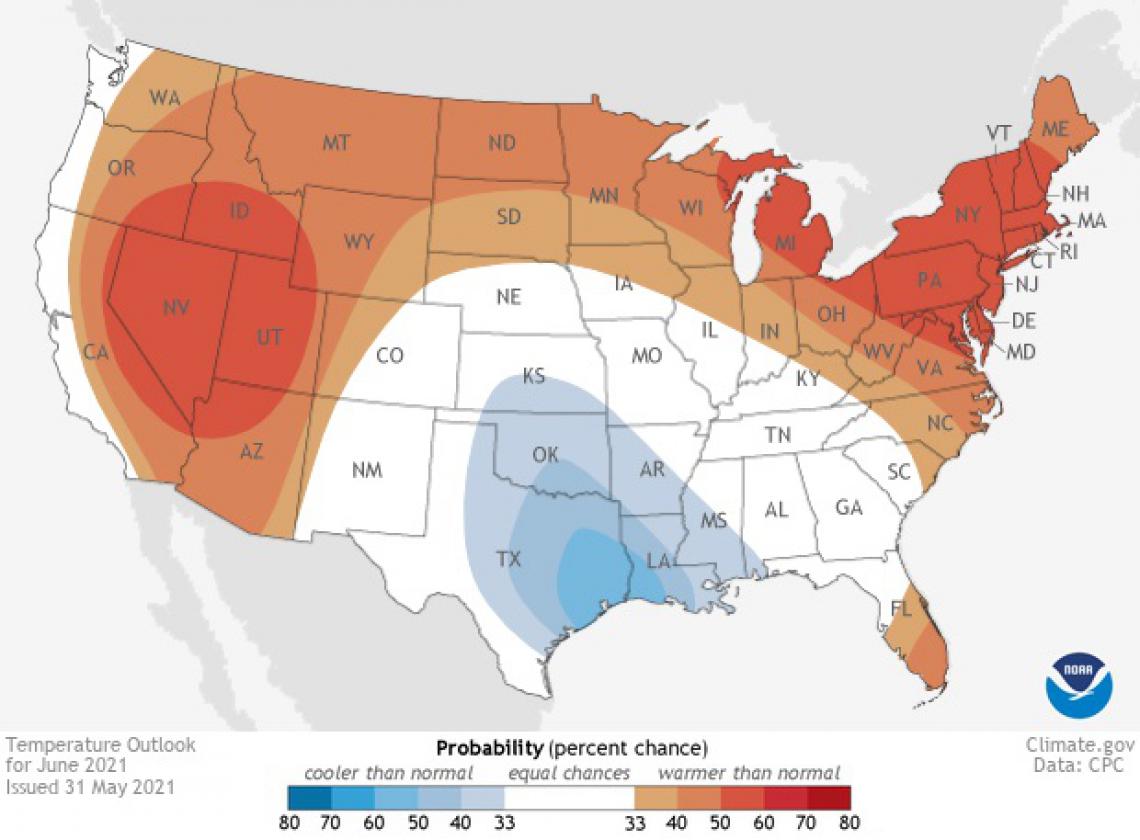
Moderate chances for temperatures above the 1991-2020 normal cover northwestern Arizona (dark orange area on map), while slight chances for above-normal temperatures extend across the rest of the state and into extreme northwestern New Mexico (orange and light orange areas on map). For the rest of the Land of Enchantment, there are equal chances for below-, near-, or above-normal temperatures (white area on map). For reference, monthly temperatures in June last year were near or up to 2 °F warmer than the 1981-2010 normal for most of Arizona and 2 to 4 °F warmer for much of New Mexico.
2021-jun-temp-outlook-noaa-cpc.jpg
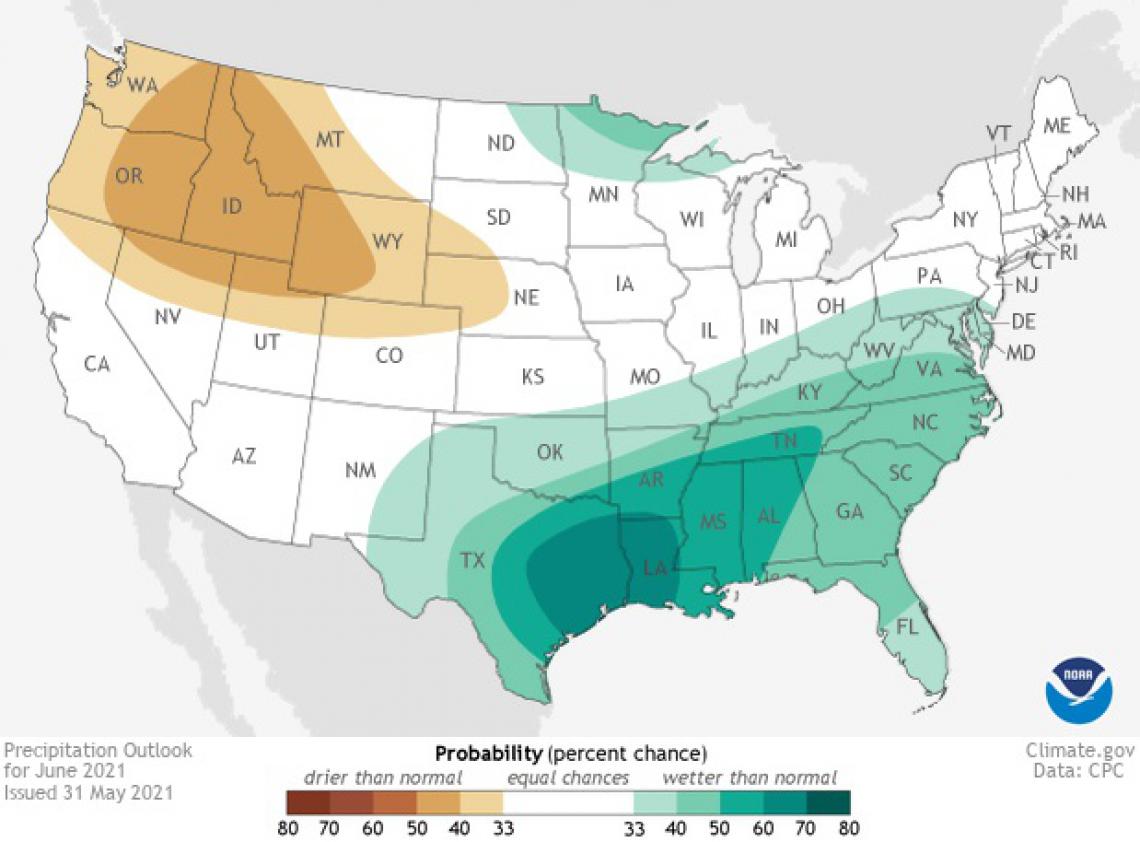
There is a slight increase in chances for precipitation above the 1991-2020 normal for southeastern New Mexico (light aqua area on map). Otherwise, equal chances for below-, near-, or above-normal precipitation exist for the rest of the region (white area on map). Looking back at June 2020, monthly precipitation totals were less than 50% of the 1981-2010 normal for almost the entire region.
Heading into what typically is the hottest and driest month for many locations, the increased odds for warmer-than-normal conditions in Arizona may also bring to mind the topic of heat waves, like the one in June 2017, and their effects on vines. Fortunately, such temperatures currently are not in any forecast or outlook. Unfortunately, high confidence as to when monsoon moisture will move into the region and lead to rainfall, which would help ameliorate the hot and dry condition, is not in any forecast or outlook, either.
Read more about the June 2021 temperature and precipitation outlook
2021-jun-prcp-outlook-noaa-cpc.jpg
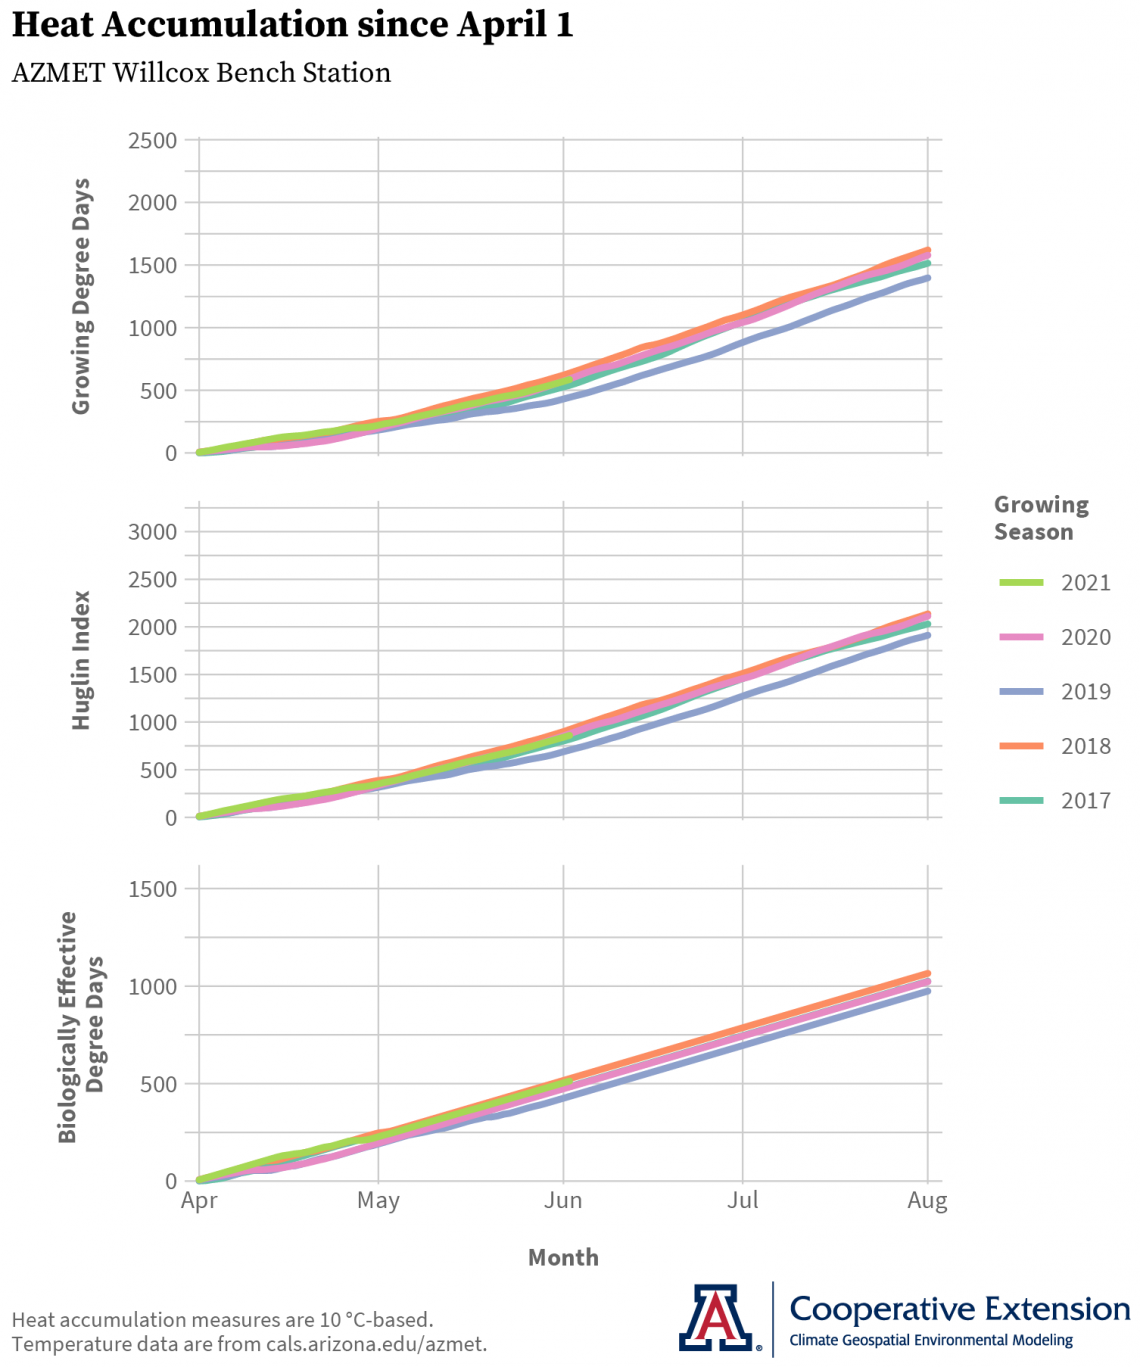
Heat Accumulation during the Growing Season
As noted last month, timing of phenological stages early in the growing season can affect timing of when and, as an important consequence, the conditions under which grapes ripen. Earlier dates of veraison – the start of the ripening period – due to prior growth stages happening earlier in the year and to shorter times between such stages often lead to grapes ripening under warmer temperatures. Due to the many effects that temperature has on fruit composition, this can result in higher sugar concentrations, less acidity, higher pH, and changes in aromatic and phenolic compounds.
At the start of this month, accumulation of growing degree days since April 1 this year at the AZMET Willcox Bench station (green line on top graph) is similar to values observed over the previous four, except for 2019 (pink, orange, and aqua lines and blue line on top graph, respectively). That being so, and with budbreak dates that look to have been slightly later this year relative to 2020, field notes from the vineyard this time last year still may be the more valuable reference for planning upcoming vineyard activities, at least at this location. Accumulations of growing degree days since April 1 this year also are above the 1991-2020 normal for other warm-climate growing areas in Arizona, but near normal for such areas in New Mexico, based on information from the Climate Toolbox.
Growing degree days may have a potential limitation when it comes to prediction of growth stage timing in the coming weeks, which is the absence of accounting for the slowing and eventual stopping of vine photosynthesis and growth as temperatures rise above 95 °F. A resulting delay in phenology can lead to later veraison dates, and thus later harvest dates.
To address this, we’re starting to kick the tires on other heat accumulation models that incorporate an accounting of maximum temperatures. This month, we’re looking at two such models common in climate-viticulture studies and that we’ve looked at before: the Huglin Index (middle graph), commonly used in Europe; and Biologically Effective Degree Days (bottom graph), of Australian provenance. The take-away this time is that neither lead us to conclude differently from the conclusions we drew from growing degree days (top graph). Nor do either show any effect from the record heat we experienced last summer, something we’ll look for in other models in upcoming newsletter issues.
Keeping Up with the New Climate Normals
Did you catch that we compared temperature and precipitation conditions to a different 30-year period earlier in the newsletter? It’s because the National Centers for Environmental Information within NOAA started rolling out new climate normals last month. Updates like this take place once every decade, once the preceding decade ends. To help with the roll out, NOAA put together a brief Q&A on understanding climate normals and looks also to have a new point-of-entry for accessing those data for individual stations.
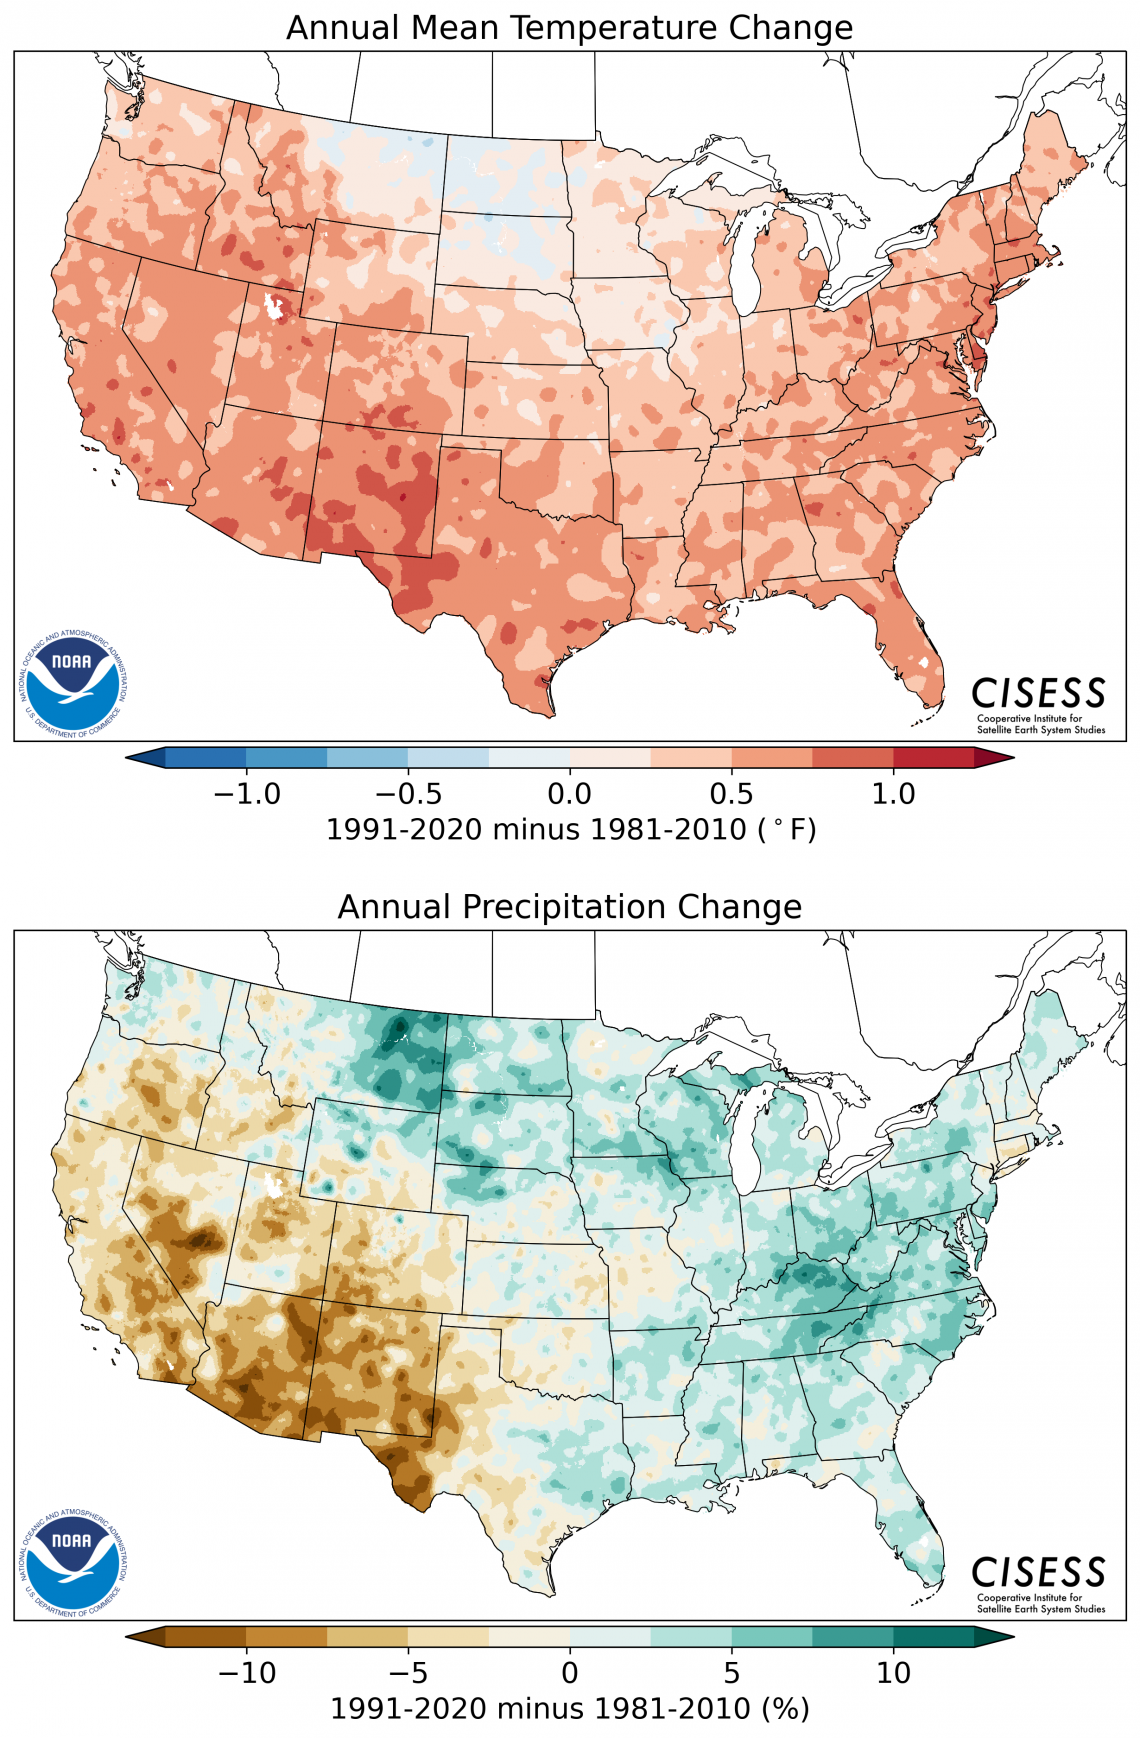
With the 1991-2020 normals now replacing the 1981-2010 normals, we’re simply exchanging the 2010s for the 1980s when it comes to calculating a 30-year climate baseline for comparisons. Unsurprisingly, the 1991-2020 period is the warmest 30-year period on record for the country. Perhaps unfortunately, our part of the country underpins a good part of that. For example, the 1991-2020 normal for annual average temperature is 0.5 to 1.0 °F warmer than that of the 1981-2010 normal for almost all of Arizona and New Mexico (light and dark salmon areas on upper map). When it comes to precipitation, several years of drought during the 2010s have made their mark. Average annual totals declined for the 1991-2020 period by 5 to 15 % for almost all of both states relative to the 1981-2010 period (dark tan, light brown, and dark brown areas on lower map).
Although the 30-year period is an industry standard for calculating normals and useful in many contexts like determining plant hardiness zones, one can see and perhaps become uneasy with how such a relatively short timeframe normalizes longer-term phenomena like warming trends due to climate change. For example, had the map in the above recap of May temperatures been made using the 1981-2010 normal, we would’ve seen more orange and dark orange areas covering Arizona and New Mexico. Plainly, a period permanently based on a set of earlier years would help keep attention on this longer-term issue. That being said, we find that being aware of both short- and long-term perspectives is a useful approach for many climate and viticulture topics.
normals-change-maps.png
Vineyards in Arizona and New Mexico may not be the only ones with vines showing no or slow growth this growing season. Different causes are possible, but freezing temperatures in fall occurring before vine dormancy, and thus able to damage vascular tissue, currently are getting the blame in parts of California. Treatment of affected vines depends on the degree of cold damage. With the occurrence of freezing temperatures in October 2019 and October 2020 in many relatively warmer growing areas in the Southwest, the cause of little or no early-season growth looks to be the same.
Regional drought conditions continue to influence the wildland fire season in the Southwest. There is an above-normal potential this month for significant wildland fires for all of Arizona and all of New Mexico except for the eastern plains where the potential is normal.
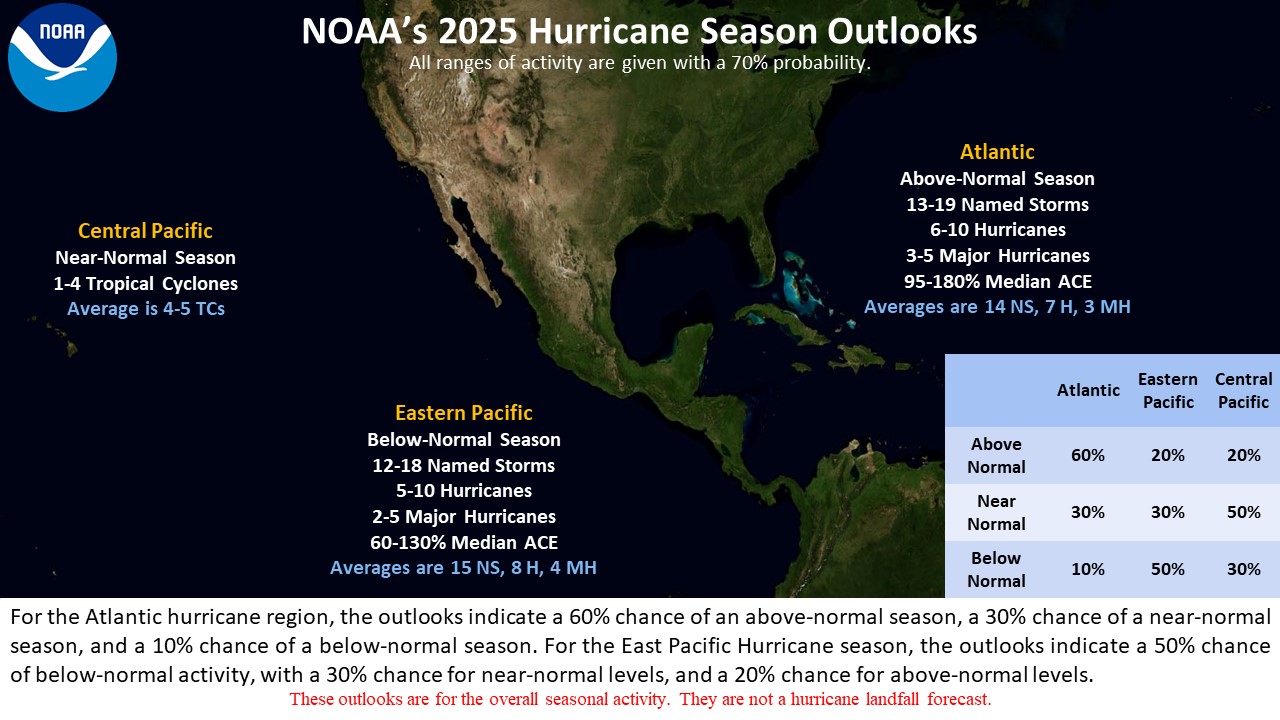
It may be late summer or early autumn before we potentially see any mention of tropical cyclones influencing the weather forecast, but the eastern Pacific hurricane season had its official start on May 15. The National Oceanic and Atmospheric Administration, or NOAA, shortly thereafter released its outlook, stating that near- to below-normal overall activity is most likely this year. Regardless of the number, intensity, and duration of storms that form to our south along the western and southern coasts of Mexico, let’s hope one or more send moisture in our direction and help alleviate the current drought conditions. Read more about the details of the outlook for the 2021 eastern Pacific hurricane season here.
Undergraduate students in the College of Agriculture and Life Sciences at the University of Arizona are looking for internships with businesses and companies in the viticulture and winery industries during 2021. Please contact Danielle Buhrow, Senior Academic Advisor and Graduate Program Coordinator in the Department of Agricultural and Resource Economics, for more information.
A recent donation of 40 acres near Willcox plus recent funding from the USDA-AZDA Specialty Crop Block Grant program are some of the first steps of a newly formed public-private collaboration towards a Viticulture Center of Research (VCOR) that will help support winegrape growing in Arizona. The funding will provide resources to convene the state viticulture industry and its supporters in the latter half of 2021 to determine common interests and develop plans for moving the VCOR project forward. Another first step is to gather letters of support that demonstrate backing of the VCOR project from the Arizona viticulture industry to relevant leaders in the University of Arizona. To learn more about the VCOR project and how to contribute a letter of support, please contact Joshua Sherman, commercial horticulture agent with University of Arizona Cooperative Extension.
For those of you in southeastern Arizona, Cooperative Extension manages an email listserv in coordination with the Tucson forecast office of the National Weather Service to provide information in the days leading up to agriculturally important events, like days with high winds or excessive heat. Please contact us if you'd like to sign up.
Please feel free to give us feedback on this issue of the Climate Viticulture Newsletter, suggestions on what to include more or less often, and ideas for new topics.
Did someone forward you this newsletter? Please contact us to subscribe.
Have a wonderful June!
With support from:

