
Climate Viticulture Newsletter - 2019 September
< Back to Climate Viticulture Newsletter
Hello, everyone!
This is the 2019 September issue of the Climate Viticulture Newsletter – a quick look at some timely climate topics relevant to winegrape growing in Arizona and New Mexico.
A Recap of August Temperature and Precipitation
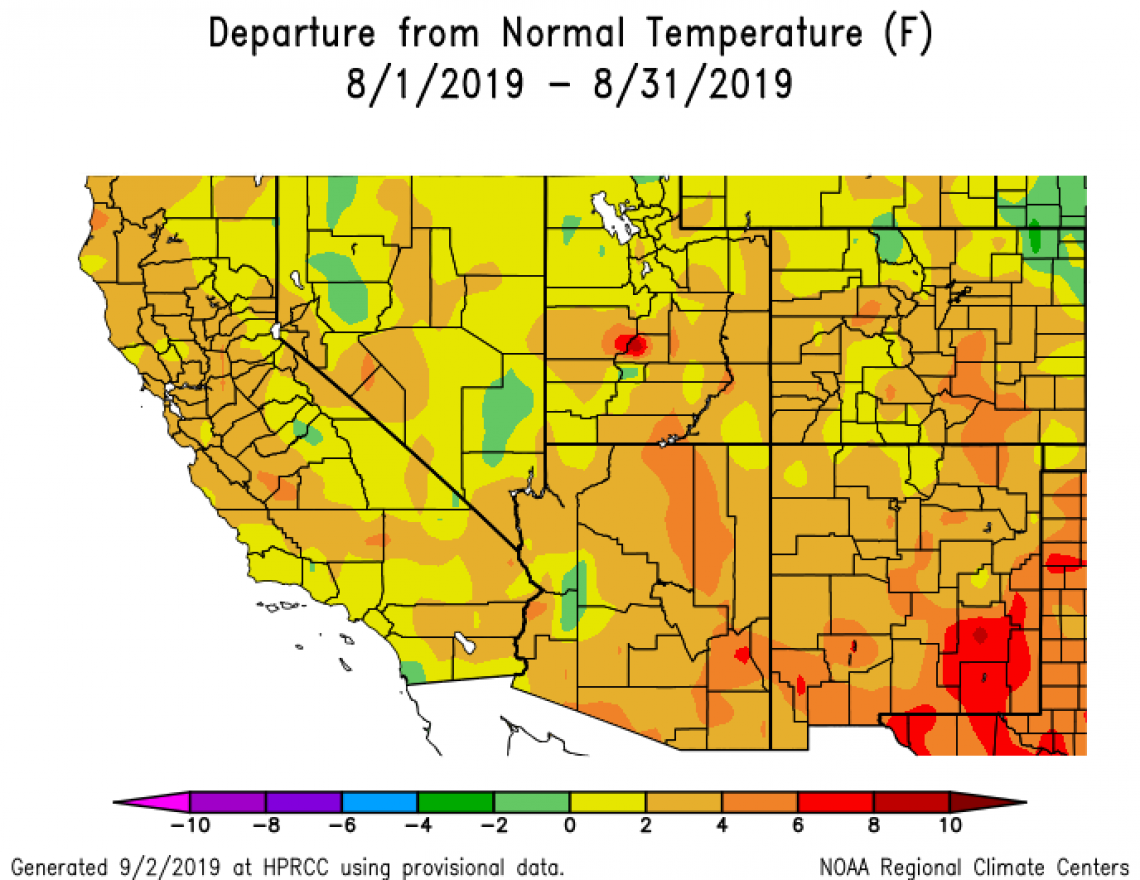
Monthly average temperatures in August were 2° to 6° Fahrenheit above the 1981-2010 average for much of Arizona and New Mexico (orange areas on map), with parts of southeastern New Mexico 6° to 10° Fahrenheit above average (red areas on map). Temperatures were within 2° Fahrenheit of normal for a few northern and western locations in the region (yellow and light green areas on map). Similar to July, there were days this past month when excessive heat may have made an appearance in relatively warmer winegrape growing areas. I jotted down August 14, 15, 19, 20, and 21 as such days in the Willcox and proposed Verde Valley American Viticultural Areas (AVAs). In fact, the Tucson forecast office of the National Weather Service reported an all-time August record for maximum temperature in Willcox, AZ of 107° Fahrenheit on the 20th. From a vine’s perspective, excessive heat can mean daytime temperatures above 95° to 100° Fahrenheit, the point at which losses through respiration become greater than gains from photosynthesis and phenological development grinds to halt.
2019-sep-last1m-temp-noaa-acis.png
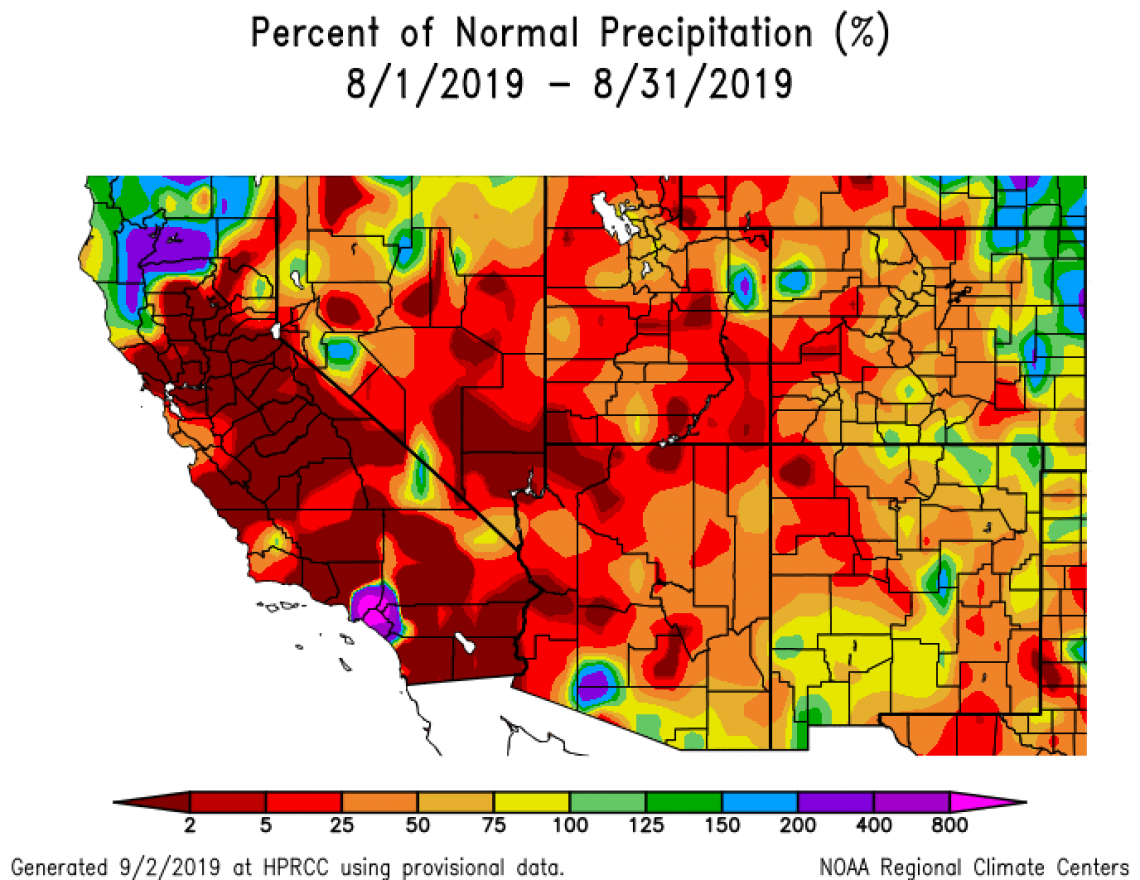
Monthly precipitation totals were less than 50% of normal for much of Arizona, as well as northwestern and southeastern New Mexico (dark orange and red areas on map). Despite the continuation of a relatively dry monsoon, a few locations in the region nonetheless measured near- or above-average amounts (yellow, green, blue, and purple areas on map), most notably in extreme southern Arizona and southwestern New Mexico. One potential benefit of the mostly drier-than-normal conditions is a decrease in pest and disease pressures. For more technical summaries of monsoon precipitation at a number of weather stations in the region, visit the Climate Science Applications Program at the University of Arizona.
2019-sep-last1m-prcp-noaa-acis.png
The Outlook for September Temperature and Precipitation
There is an increased chance for above-average temperatures across the entire region, particularly for northern Arizona (orange areas on map). Unlike the past few months, warmer-than-average temperatures likely won’t affect grape quality and composition through excessive heat this time of year for fruit that still might be on the vine. In contrast, it may help with ripening fruit for vineyards in relatively cool winegrape-growing areas like those in northern New Mexico.
2019-sep-temp-outlook-noaa-cpc.gif

There is a slightly increased chance for above-average precipitation across all of Arizona and New Mexico (green areas on map), due in part to the potential for tropical cyclones to our south in the eastern tropical Pacific Ocean. Although typically distant, tropical cyclones in September can send moisture up the Gulf of California and into the region, leading to additional rainfall. As we’re near the end of our summer rainy season when conditions start to dry out, wetter-than-normal conditions may keep pest and disease pressures hanging around a bit longer than usual.
2019-sep-prcp-outlook-noaa-cpc.gif
Heat Accumulation So Far This Year
A variable that helps us understand and predict the timing of vine growth stages is the accumulation of heat during the year, often quantified by the sum of growing degree days (GDDs).
As mentioned in past newsletter issues this summer, timing of vine growth stages appears more sensitive to cooler- or warmer-than-normal temperatures during spring. If growth stages earlier in the year like budburst and flowering are behind or ahead of their average dates, the timing of subsequent phenological stages like the start of ripening and harvest often follow suit.
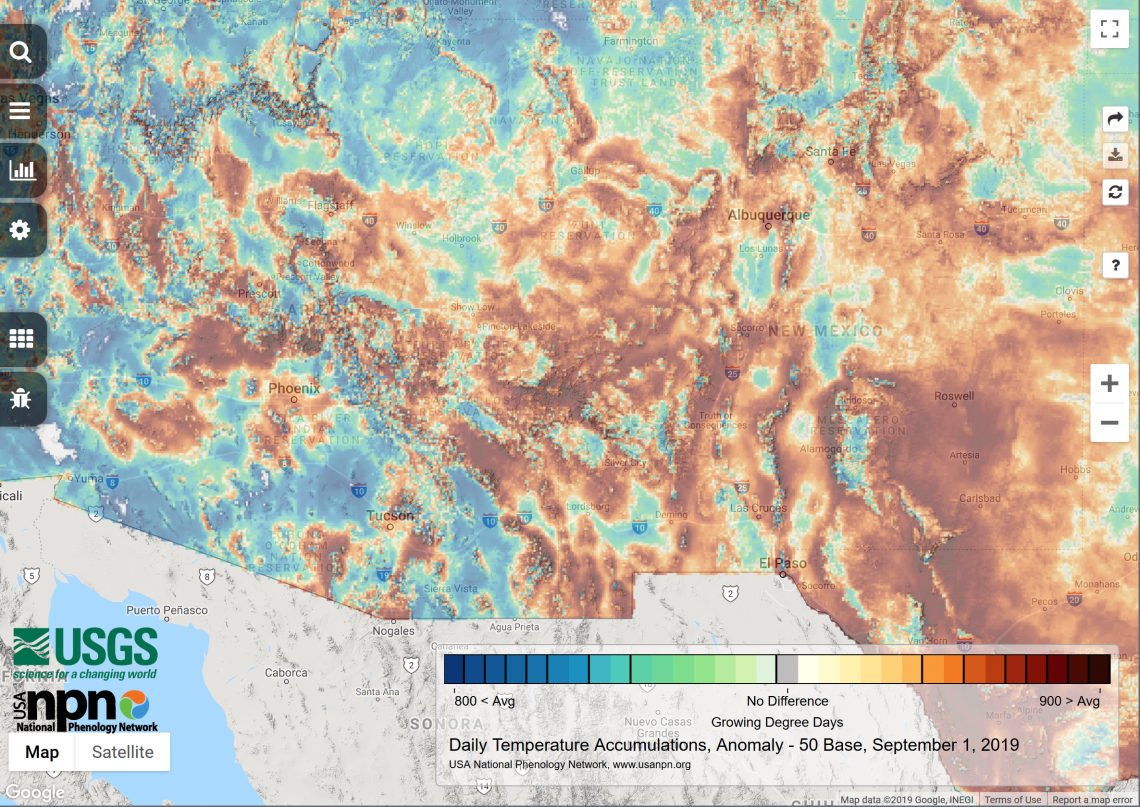
Such effects of relatively cool May and June temperatures across Arizona look to still be hanging around, as we start September with accumulated GDDs that are below average values for many areas of the state (blue and green areas on map). This is the case, for example, in the Sonoita, Willcox, and, to a lesser degree, proposed Verde Valley American Viticultural Areas (AVAs). Heat accumulations in several other areas in the state, however, are above average (yellow, orange, and brown areas on map). In New Mexico, where May temperatures weren’t as much below normal, heat accumulations are slightly below- (green areas on map) or slightly to much above-average for almost all of the state (yellow, orange, and brown areas on map).
Current accumulated GDDs also are lower than values from this time last year for several winegrape growing areas, with reports so far of ripening and harvest dates being about two weeks later than those in 2018. We’d be interested in hearing from you if you are observing similar or different conditions in your vineyard.
2019-sep-cgdd-usgs-npn.png
Another Look at Excessive Heat
During the summer in relatively warm winegrape-growing regions, like those in southeastern and north-central Arizona and southern New Mexico, international studies suggest that grape quality and composition is sensitive to excessively high temperatures at this time of the year. Too much heat, for instance, can result in higher sugar levels and lower acidity, as well as a decrease in anthocyanins, which can have a negative effect on tannin retention, ageing, and color of red wines.
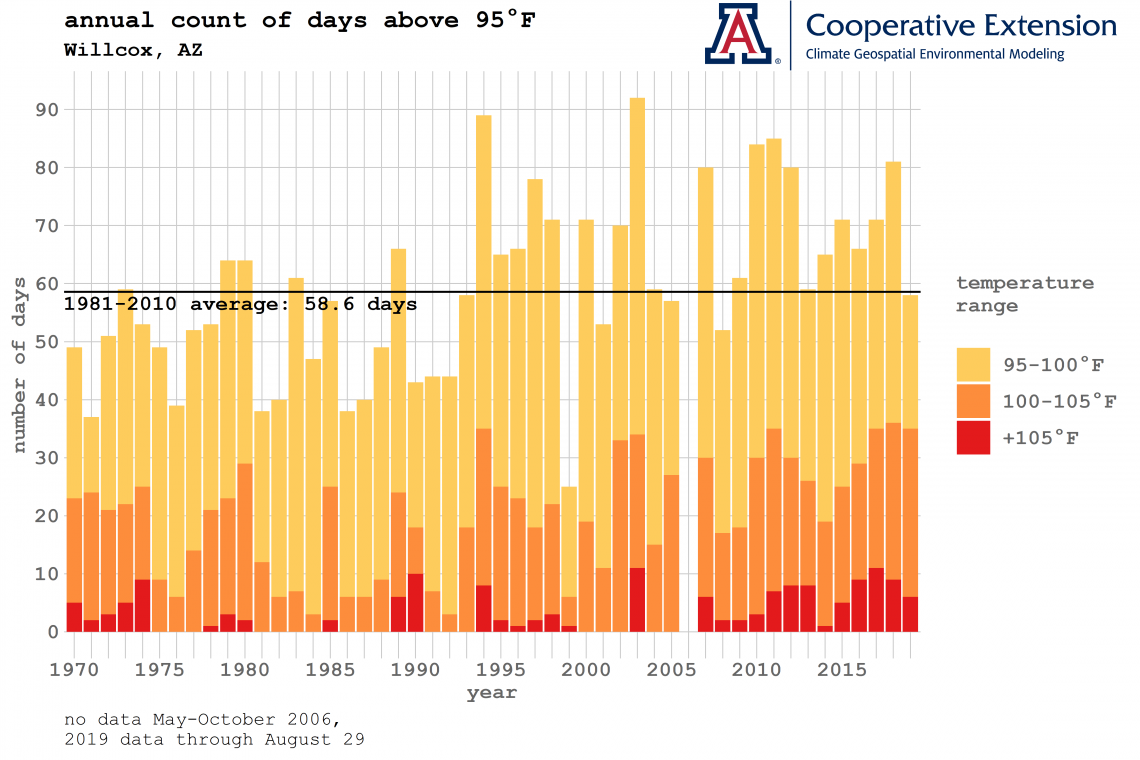
Using daily maximum temperature records from Willcox, AZ as an example, there have been 58 days above 95° Fahrenheit in 2019 through August 29. This is almost equal to the 1981-2010 average of 58.6 days per year. Given the recent weather and current forecast for early September, it’s possible that the 2019 total will increase and be higher than normal, similar to the majority of years since the mid-1990s. Of these 58 days so far in 2019, 23 were between 95° and 100° Fahrenheit (yellow segment on graph), 29 were between 100° and 105° Fahrenheit (orange segment on graph), and 6 were above 105° Fahrenheit (red segment on graph).
There are management actions that one can take before, during, and after heat waves to minimize impacts. If there were any effects of excessive heat this past summer for vineyards in the region, hopefully they were minimal.
ann_count_95f_willcox_az_cvn_w_logo.png
Yavapai County Wineries: Establishments, Jobs, and Wages
Making a special guest appearance in the newsletter this month are some highlights from current work by our colleagues in the Economic Impact Analysis Program at the University of Arizona.
Economic data on Arizona wineries are collected as part of the Quarterly Census of Employment and Wages administered by the U.S. Department of Labor Bureau of Labor Statistics. As the number of wine-producing establishments has grown in Yavapai County from six to 16 between 2014 and 2018, the number of winery jobs has grown from 58 to 223. Annual wages paid to winery employees have risen from less than $1.5 million to nearly $7.7 million from 2014 to 2018.
It’s a growing industry!
| 2014 | 2015 | 2016 | 2017 | 2018 | |
|---|---|---|---|---|---|
| wine producing establishments |
6 | 8 | 8 | 9 | 16 |
| winery jobs | 58 | 93 | 117 | 156 | 223 |
| annual wages paid to winery employees ($ millions) |
$1.47 | $2.34 | $3.93 | $5.47 | $7.68 |
source: U.S. Department of Labor Bureau of Labor Statistics, 2018
Mentioned as of interest by several growers, we are helping to put together ‘growing season in review’ workshops for winegrape growing areas of north-central and southeastern Arizona. One will be in the Verde Valley on October 17, and another will be in Benson on October 25. The basic idea is to have half a day for attendees to discuss and learn from each other on different topics like cultivar quality and yield, experienced conditions, and whether or not it was easier or harder to produce a high-quality crop. Registration information coming soon!
For those of you in southeastern Arizona, Cooperative Extension manages an email listserv in coordination with the Tucson forecast office of the National Weather Service to provide information in the days leading up to agriculturally important events, like late spring freezes and summer heat waves. Please contact us if you'd like to sign up.
Please feel free to give us feedback on this issue of the Climate Viticulture Newsletter, suggestions on what to include more or less often, and ideas for new topics.
Did someone forward you this newsletter? Please contact us to subscribe.
Have a wonderful September!
With support from:
