
Climate Viticulture Newsletter - 2024 April
< Back to Climate Viticulture Newsletter
Hello, everyone!
This is the April 2024 issue of the Climate Viticulture Newsletter – a quick look at some timely climate topics relevant to wine grape growing in Arizona.
IN THIS ISSUE
- A Recap of March Temperature and Precipitation
- The Outlook for April Temperature and Precipitation
- Vine Dormancy and the Start of the Growing Season
- Q & A from the Winter Viticulture Symposium
- Extra Notes
A Recap of March Temperature and Precipitation
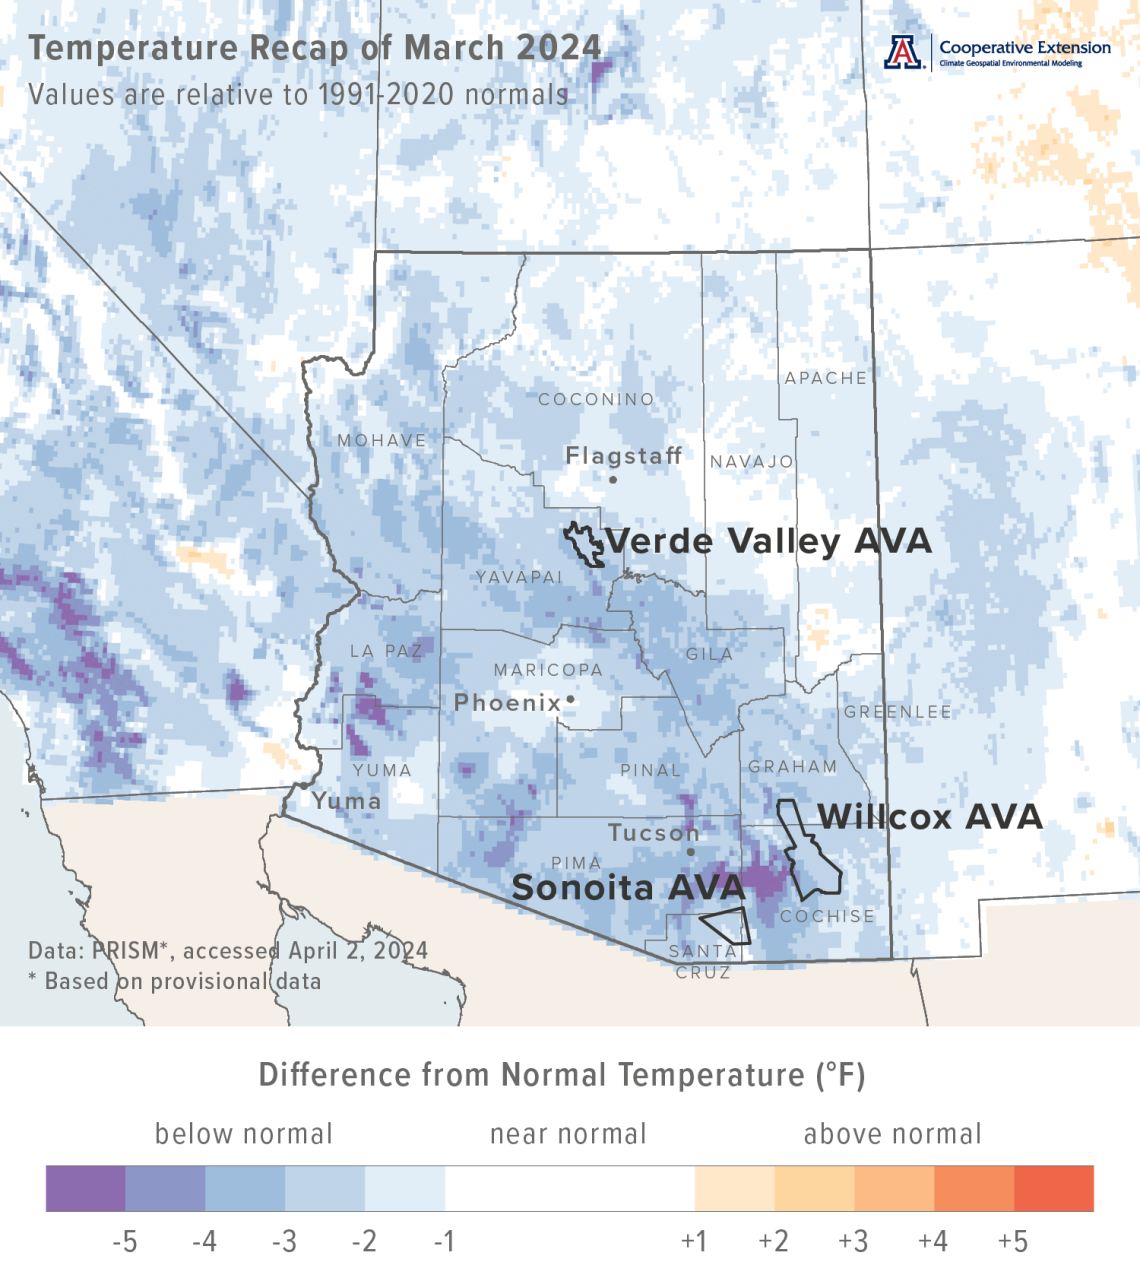
Monthly average temperatures were 1 to 4 °F below the 1991-2020 normal for almost all of Arizona (light blue, blue, and dark blue areas on map), including all three Arizona AVAs. For reference, monthly temperatures in March last year were 1 to 4 °F below normal for much of the southeastern and east-central parts of Arizona, and more than 4 °F below normal for much of the rest of the state.
Area-average maximum and minimum temperatures during March 2024 were 63.4 and 36.2 °F for the Sonoita AVA, 62.8 and 37.1 °F for the Verde Valley AVA, and 63.8 and 36.8 °F for the Willcox AVA. Respective March normals are 67.1 and 36.9 °F, 68.0 and 37.6 °F, and 69.4 and 37.1 °F.
Temperature last month ranged between 75.6 and 29.8 °F at the AZMet Bonita station and between 76.5 and 30.2 °F at the AZMet Willcox Bench station.
cvn-recap-202404-tmeanDepartureNormal.png
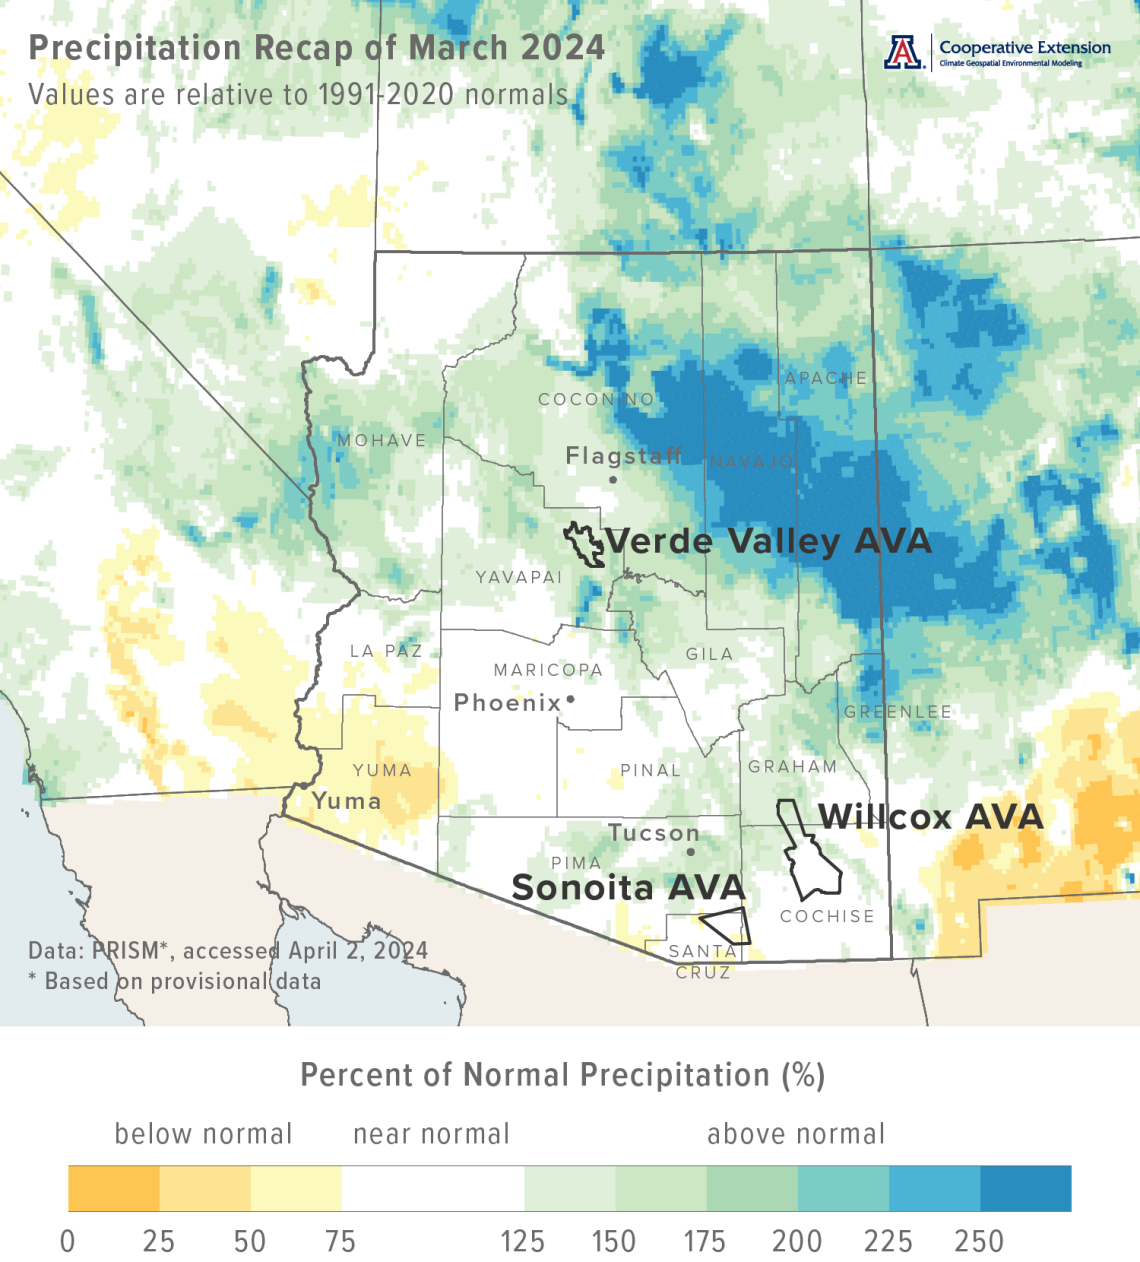
Monthly precipitation totals were more than 125 % of normal for much of the northern half of the state and some of the south-central and southeastern parts of the state (aqua and blue areas on map), including the Verde Valley AVA and the northern part of the Willcox AVA. Otherwise, and except for extreme southwestern Arizona, totals were near normal (white areas on map). Precipitation during March 2023 was more than 200 % of normal for many areas in the northern half of the state, transitioning to totals between 50 and 75 % of normal in the southeastern part of the state.
Area-average total precipitation in March 2024 was 0.84 inches for the Sonoita AVA, 1.96 inches for the Verde Valley AVA, and 0.89 inches for the Willcox AVA. Respective March normals are 0.97, 1.31, and 0.76 inches.
Total precipitation last month was 0.94 and 0.63 inches at the AZMet Bonita and Willcox Bench stations, respectively.
Dig further into daily weather summaries for the AZMet Bonita and Willcox Bench stations in the Willcox AVA
Learn more about PRISM climate data
cvn-recap-202404-pptPercentNormal.png
The Outlook for April Temperature and Precipitation
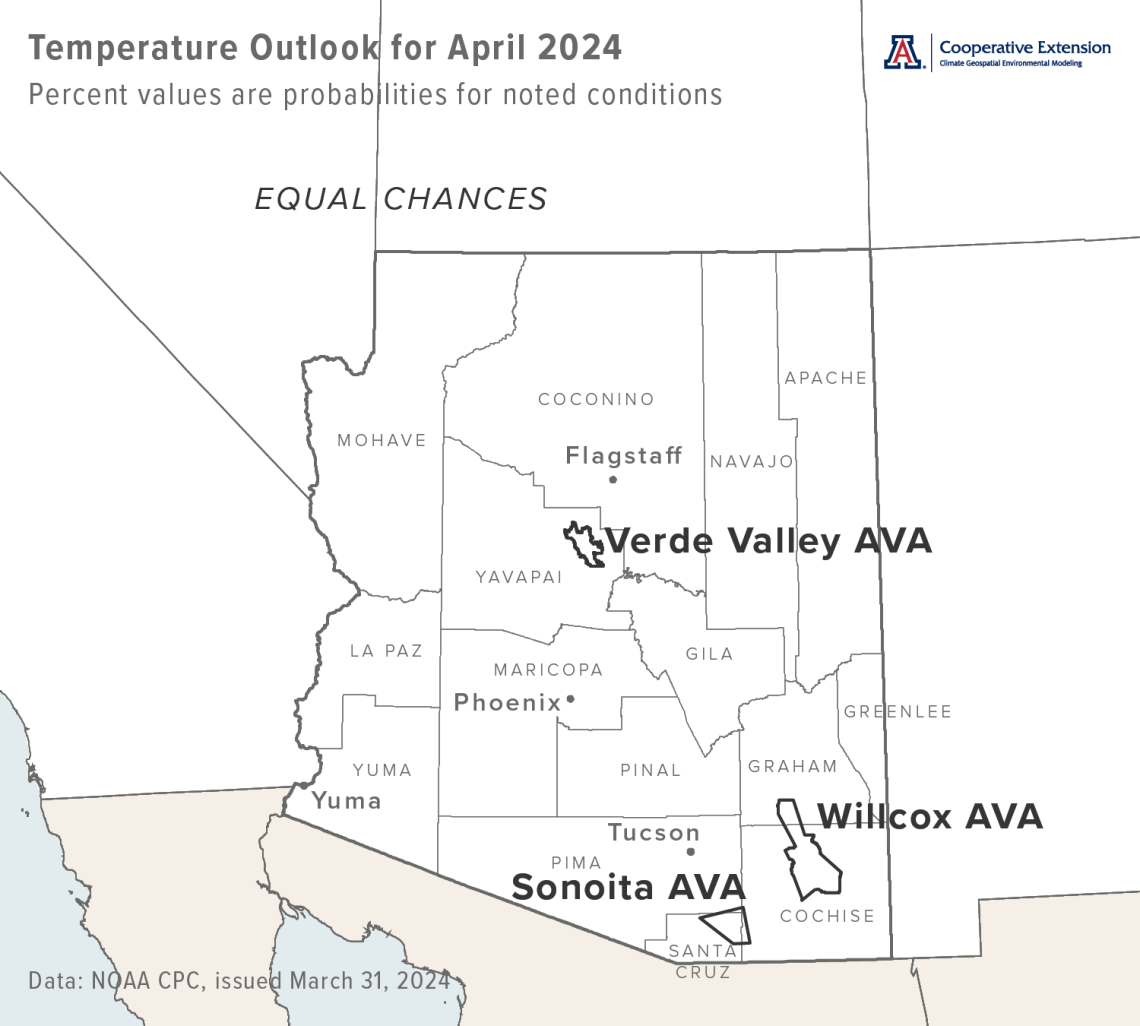
With indications of a relatively cool first half and a relatively warm second half, temperatures over the course of this month have equal chances for being below, near, or above the 1991-2020 normal across all of Arizona (white area on map). Monthly average temperatures in April last year were within 2 °F of normal for almost all of the state.
Area-average maximum and minimum temperatures during April 2023 were 75.5 and 40.5 °F for the Sonoita AVA, 76.7 and 41.5 °F for the Verde Valley AVA, and 77.9 and 40.3 °F for the Willcox AVA. Respective April normals are 73.5 and 41.9 °F, 75.5 and 42.6 °F, and 76.7 and 42.0 °F.
Temperature in April last year ranged between 90.3 and 21.6 °F at the AZMet Bonita station and between 91.4 and 21.9 °F at the AZMet Willcox Bench station.
cvn-outlook-202404-temp.png
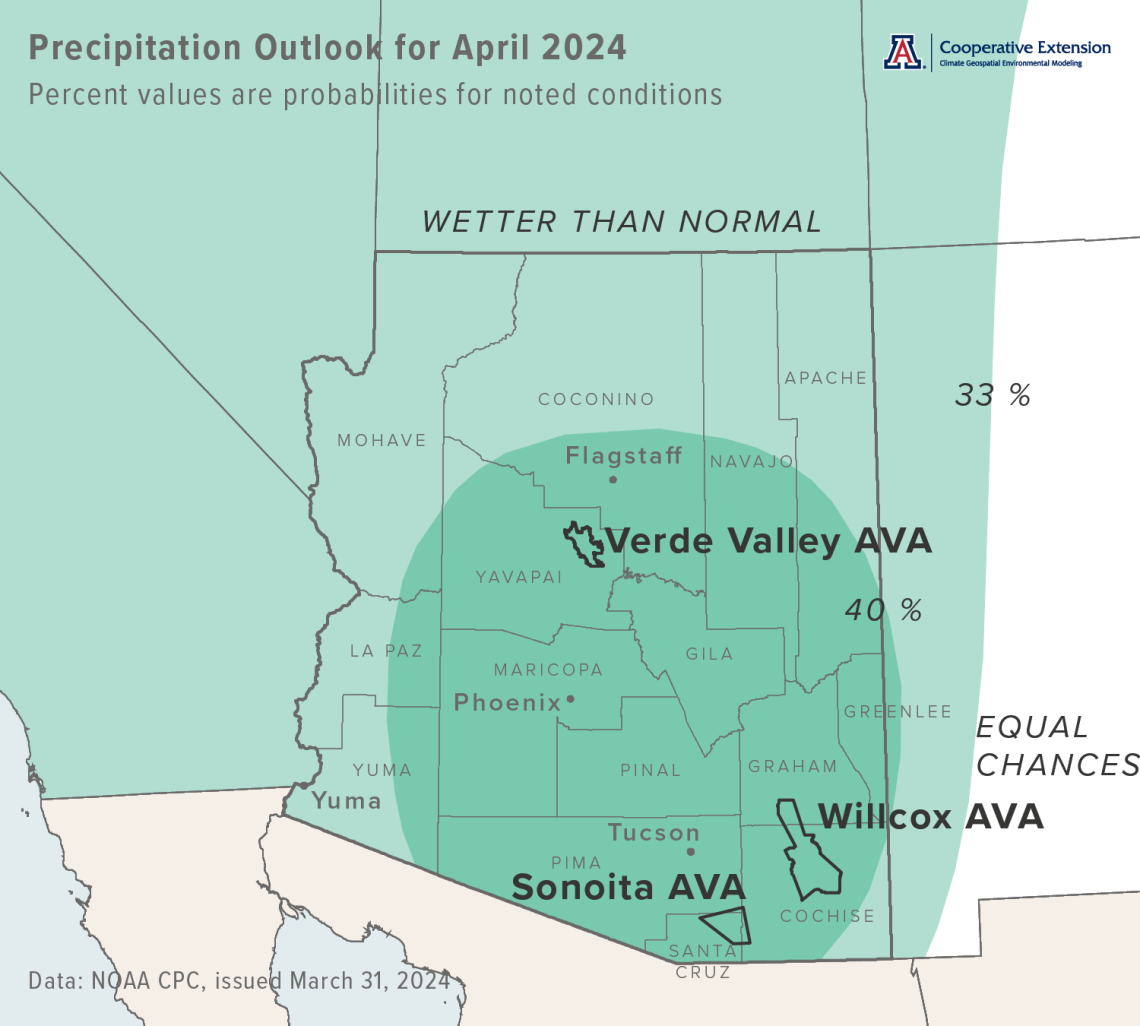
Precipitation totals for this month have a slight increase in chances for being above normal across the state (light aqua and aqua areas on map). Precipitation during April 2023 was less than 25 % of normal for almost all of Arizona.
Area-average precipitation totals in April 2023 were 0.00 inches for the Sonoita AVA, 0.00 inches for the Verde Valley AVA, and 0.00 inches for the Willcox AVA. Respective April normals are 0.38, 0.55, and 0.25 inches.
Total precipitation in April last year was 0.00 and 0.00 inches at the AZMet Bonita and Willcox Bench stations, respectively.
To stay informed of long-range temperature and precipitation possibilities beyond the coverage of a standard weather forecast, check in, too, with the six-to-ten-day outlook and eight-to-fourteen-day outlook issued daily by NOAA’s Climate Prediction Center.
cvn-outlook-202404-prcp.png
Vine Dormancy and the Start of the Growing Season
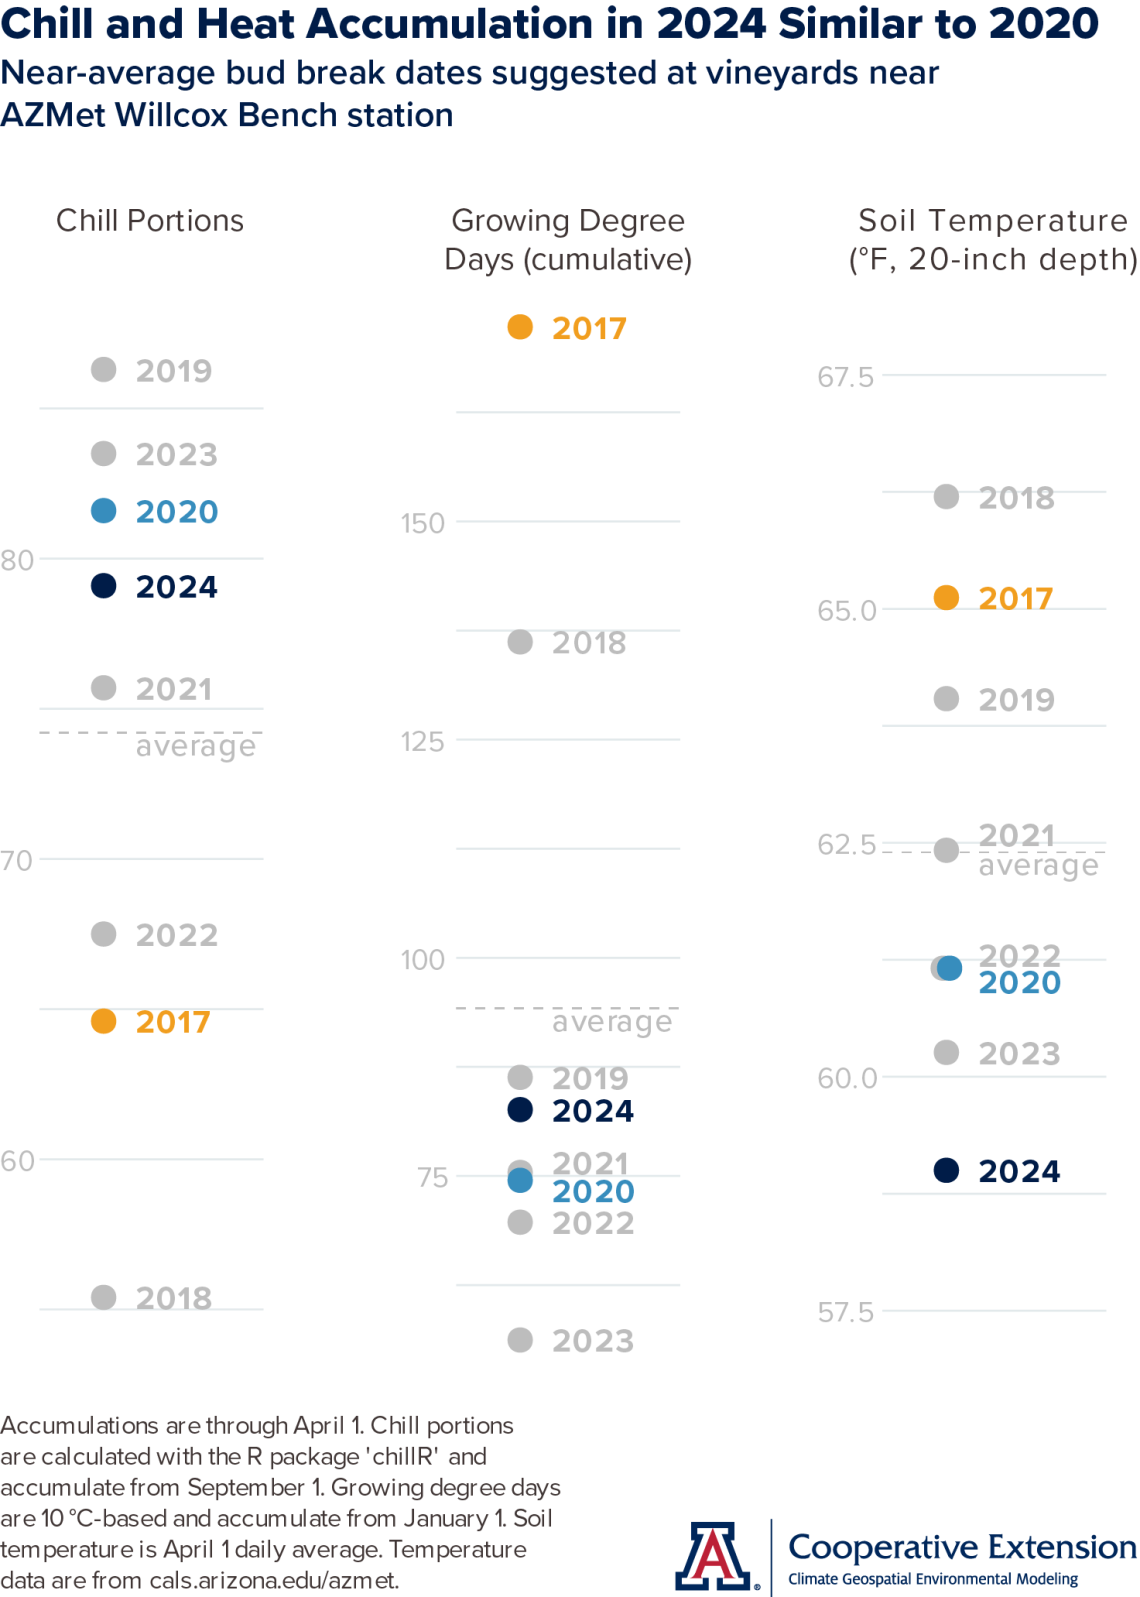
With relatively cool temperatures last month at the AZMet Willcox Bench station in the south-central part of the Willcox AVA, similarities of chill and heat accumulations between this year and 2017 diminished since the start of March (dark blue and orange dots, respectively, on graphs). In contrast, similarities between this year and 2020 increased (dark and light blue dots, respectively, on graphs), to the point where timing of bud break in 2024 looks to be most like that from spring 2020, as of April 1 and at least at this location.
This goes to show how temperature variability in the weeks leading up to bud break may influence bud break dates. Instead of a year with relatively early bud break dates, like 2017, current chill and heat accumulations suggest dates closer to an average of the past several years, like 2020 and based on bud break data we’ve seen.
Chill portion accumulation through April 1 this year is above the station average (dark blue dot and gray dotted line, respectively, in left graph), with higher values only in 2019, 2020, and 2023. Heat accumulation is below average (dark blue dot and gray dotted line, respectively, in middle graph), with lower values only from the past four years. As soil temperature sometimes is part of the discussion about the start of the growing season, we show those data, as well. The daily average on April 1 this year is below average (dark blue dot and gray dotted line, respectively, in right graph), the lowest since 2017 and a result of the recent storm.
cvn202404-chill-heat-accumulation-2024-04-02.png
Q & A from the Winter Viticulture Symposium
We change pace this month in this section and switch from specific questions to what was more of a discussion topic at the Winter Viticulture Symposium last December. As in previous newsletter issues, we presented analyses at the symposium of ripening-season temperatures over 95 °F, which, in addition to affecting fruit composition, generally represent conditions that slow and eventually stop vine photosynthesis as thermometer readings move further above that mark. Are there better ways to estimate the slow-down and stoppage of vine photosynthesis with meteorological data? After all, not all afternoons with temperatures over 95 °F are equal once one factors in humidity. People might feel more comfortable at 95 °F and lower humidity, whereas vines, arguably, might prefer higher humidity with that amount of heat in order to lower how much water they lose to the atmosphere through transpiration at a given level of photosynthesis.
Using temperature and humidity measurements, one can estimate saturation and actual vapor pressure. Vapor pressure here refers to the contribution of water vapor to total atmospheric pressure, also known as the partial pressure of water vapor. With temperature fixed, more water vapor in the air translates to greater vapor pressure, and vice versa. Saturation vapor pressure is the vapor pressure when air is saturated at a given temperature, and the assumed condition inside a leaf. Actual vapor pressure is the vapor pressure when air is, typically, less than saturated at a given temperature, and the estimated condition outside of a leaf. With temperature fixed, higher atmospheric humidity results in greater actual vapor pressure, and vice versa. As the difference between these two measures of vapor pressure increases, so does the amount of water that the atmosphere can pull out of the leaf through stomates that are open to pull in carbon dioxide for photosynthesis. Plants transpire more water as the vapor pressure deficit becomes greater, but only until a point. Under higher deficits, stomates first partially and then eventually close, limiting water loss but reducing photosynthesis. Although this general description applies across wine grape varieties, there are, interestingly, varietal differences in photosynthetic rates at given levels of vapor pressure deficit. These differences may be result of traits from both the rootstock and scion.
In addition to lower atmospheric humidity at a fixed temperature, greater vapor pressure deficits also can result from higher temperatures. Saturation vapor pressure, also thought of as the maximum amount of water vapor that air can hold, increases nonlinearly as temperature increases. If atmospheric humidity does not increase enough for actual vapor pressure to match this increase, vapor pressure deficits become greater.
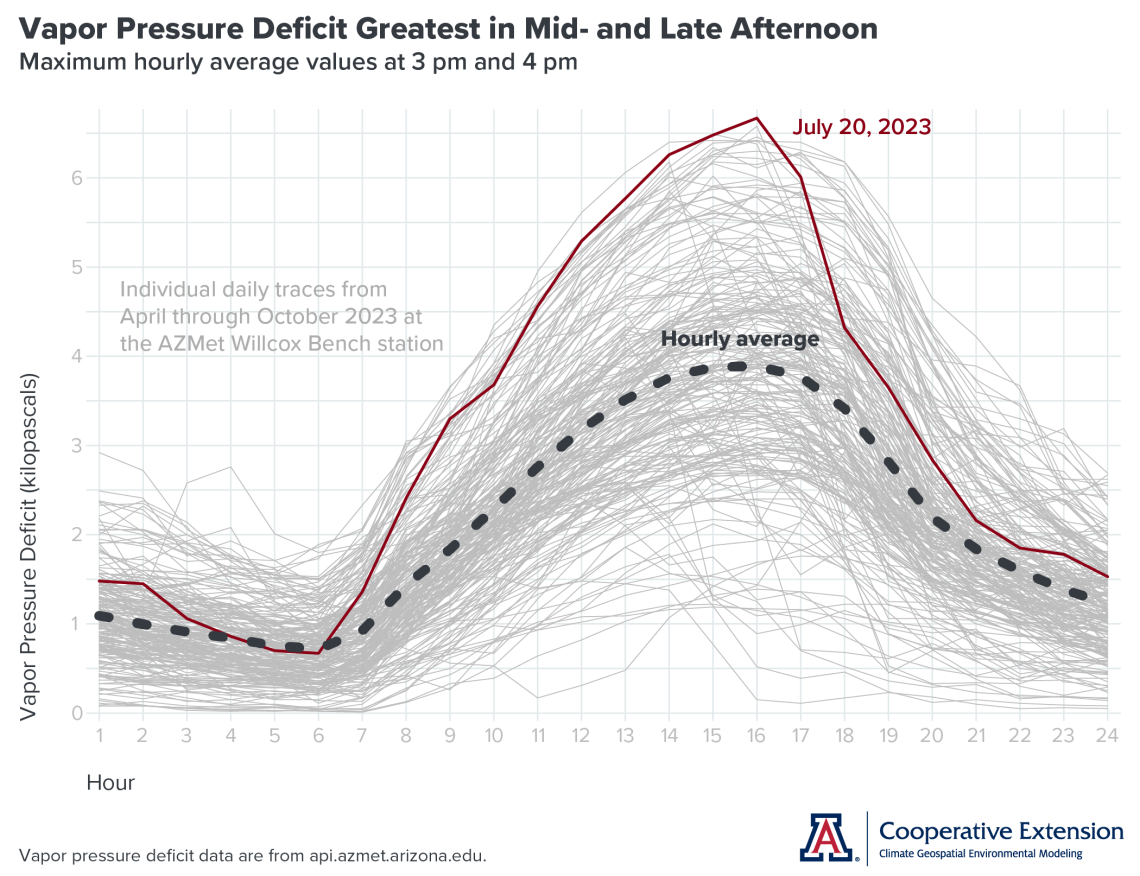
So, how does vapor pressure deficit vary during a day? As you likely expect, lower values occur during hours with cooler temperatures and higher relative humidity, typically overnight and early morning, while higher values occur during hours with warmer temperatures and lower relative humidity, typically from late morning through late afternoon. This is shown in the figure by the traces of hourly average vapor pressure deficit for individual days (thin gray lines on graph) during the 2023 growing season from April through October at the AZMet Willcox Bench station in the south-central part of the Willcox AVA, the average of all traces (dashed, thick gray line on graph), and the trace from July 20, 2023 (red line on graph), when the hottest hourly average temperature, 104.7 °F, and coincidently the highest hourly average vapor pressure deficit, 6.67 kilopascals, were recorded at 4:00 pm.
Based on this, you also likely expect that vapor pressure deficits are higher during the hotter months of the growing season. You’re right, and we’ll look more into this in an upcoming issue as we’re curious about possible differences in vapor pressure deficit between vintages with a hot-and-dry monsoon and those with a rainy and relatively cooler one.
We thank Dr. Gene Giacomelli, Professor in Biosystems Engineering and Extension Specialist in Controlled Environment Agriculture at the University of Arizona, for providing information about vapor pressure deficit and photosynthesis.
cvn-vpd-202404.png
Extra Notes
The Water Resources Research Center at the University of Arizona recently published a Water Factsheet for Santa Cruz County, where almost all of the Sonoita AVA is located. The factsheet includes topics like water supply and demand, sustainable water management, and the significance of the Santa Cruz River.
The new AZMet (Arizona Meteorological Network) website recently moved from its staging area to its operational one, and now is at azmet.arizona.edu. So far, we've rebuilt and reorganized many pieces of the legacy website. Coming up, we'll continue its evolution with new features and tools. Please give it a look next time you're online for AZMet data and information.
Although rapidly weakening, the current El Niño event still affects regional weather through precipitation chances this month. There is a 83 % chance that it concludes during the April-through-June timeframe. Odds have increased to 62 % that La Niña conditions take hold across the tropical Pacific Ocean during the June-through-August period.
It’s once again wildland fire season in the Southwest. Given recent and current conditions, there is a normal potential for significant wildland fires across Arizona this month.
For those of you in southeastern Arizona, including the Sonoita and Willcox AVAs, Cooperative Extension manages an email listserv in coordination with the Tucson forecast office of the National Weather Service to provide information in the days leading up to agriculturally important events, like spring freezes and high-wind days. Please contact us if you'd like to sign up.
And for those of you in north-central and northeastern Arizona, including the Verde Valley AVA, Cooperative Extension also now manages an email listserv in coordination with the Flagstaff forecast office of the National Weather Service to provide similar information for this part of the state. Please contact us if you'd like to sign up.
Undergraduate students in the College of Agriculture and Life Sciences at the University of Arizona are looking for internships with businesses and companies in the viticulture and winery industries. Please contact Danielle Buhrow, Senior Academic Advisor and Graduate Program Coordinator in the Department of Agricultural and Resource Economics, for more information.
Please feel free to give us feedback on this issue of the Climate Viticulture Newsletter, suggestions on what to include more or less often, and ideas for new topics.
Did someone forward you this newsletter? Please contact us to subscribe.
Have a wonderful April!
With current and past support from:

