
Climate Viticulture Newsletter - 2024 February
< Back to Climate Viticulture Newsletter
Hello, everyone!
This is the February 2024 issue of the Climate Viticulture Newsletter – a quick look at some timely climate topics relevant to wine grape growing in Arizona.
IN THIS ISSUE
- A Recap of January Temperature and Precipitation
- The Outlook for February Temperature and Precipitation
- A Review of 2023 Growing Season Precipitation
- Q & A from the Winter Viticulture Symposium
- Extra Notes
A Recap of January Temperature and Precipitation
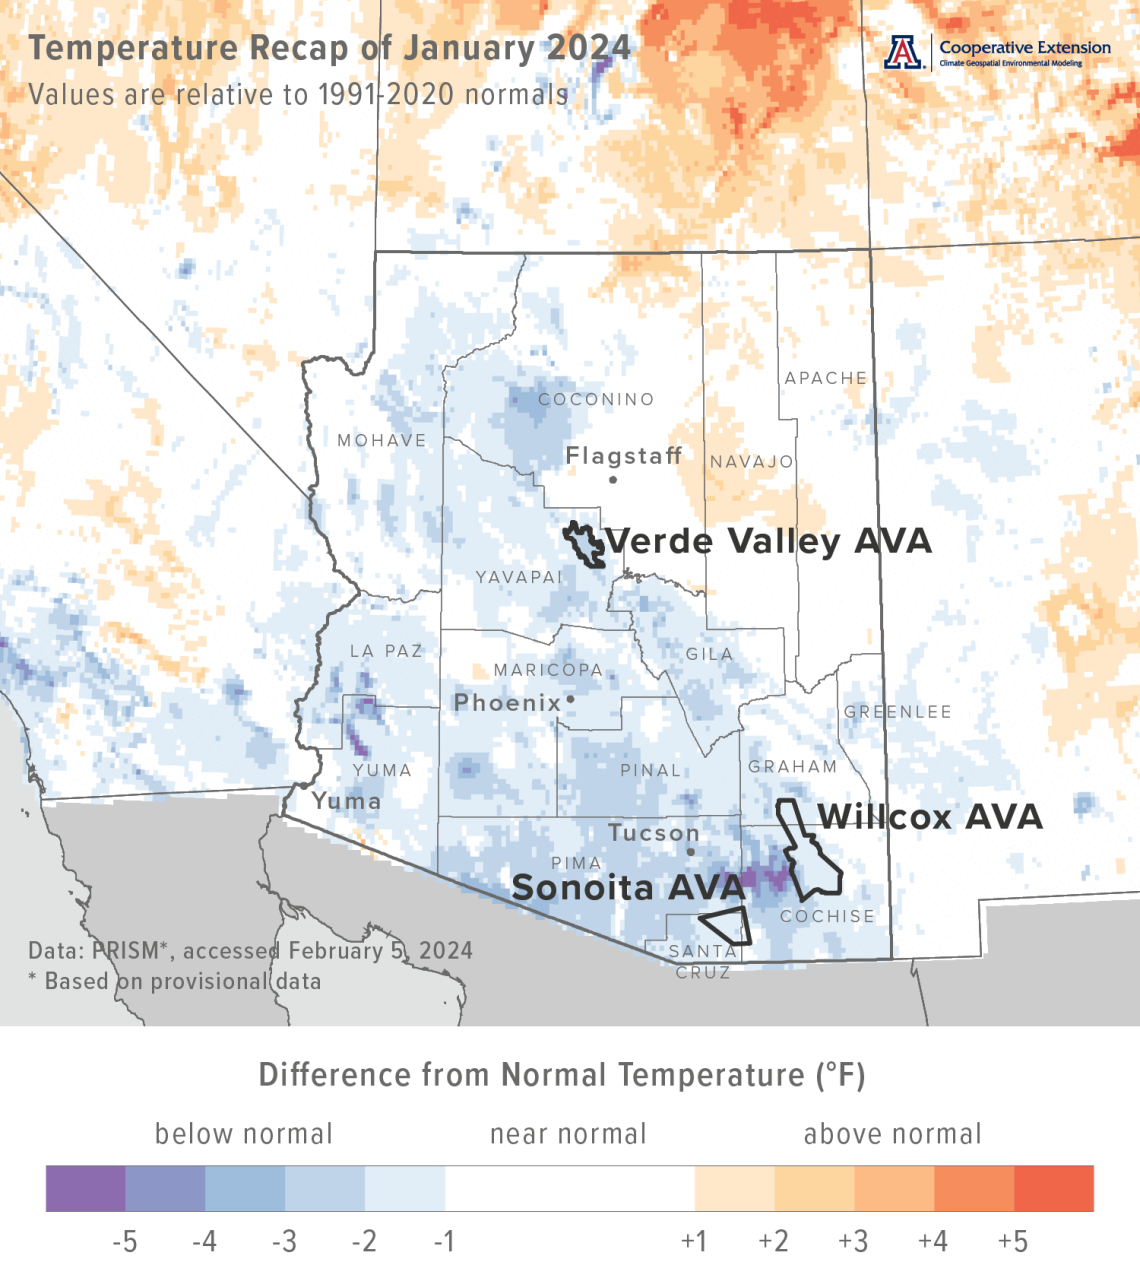
Monthly average temperatures were 1 to 3 °F below the 1991-2020 normal for much of southern, central, and western Arizona (light blue and blue areas on map), including all three of the Arizona AVAs. Much of the rest of the state measured near-normal temperatures (white areas on map). For reference, monthly temperatures in January last year were 1 to 4 °F below normal for much of the state, including all three of the Arizona AVAs.
Area-average maximum and minimum temperatures during January 2023 were 56.4 and 30.6 °F for the Sonoita AVA, 54.4 and 30.1 °F for the Verde Valley AVA, and 56.4 and 30.1 °F for the Willcox AVA. Respective January normals are 58.7 and 31.2 °F, 58.1 and 30.6 °F, and 59.6 and 30.2 °F.
Temperature last month ranged between 69.1 and 18.7 °F at the AZMet Bonita station and between 69.8 and 17.8 °F at the AZMet Willcox Bench station.
cvn-recap-202402-tmeanDepartureNormal.png
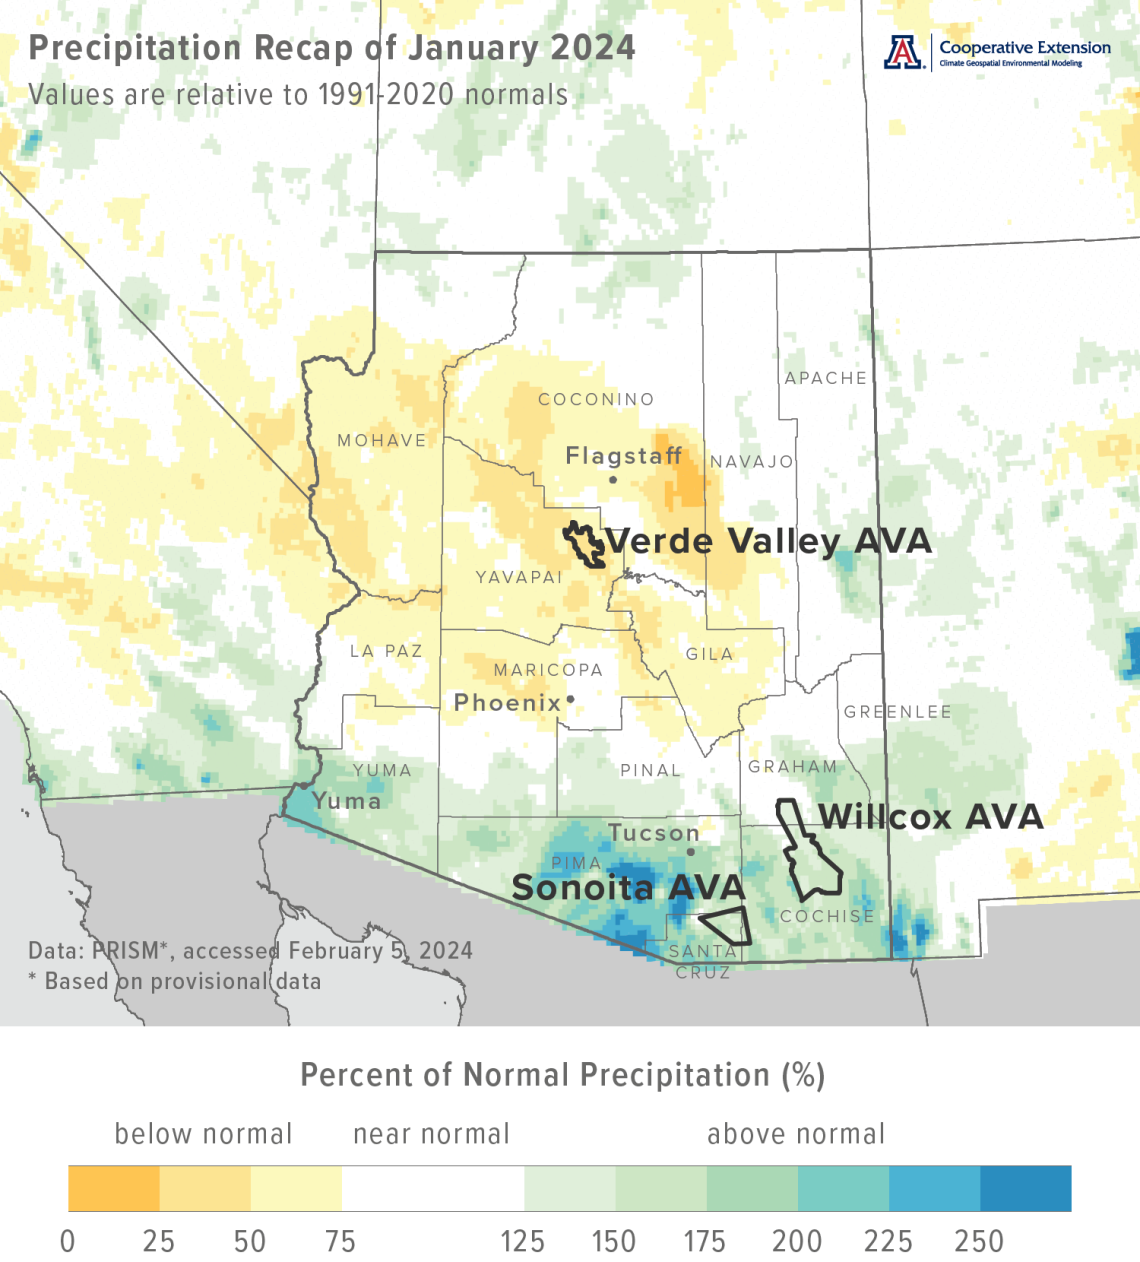
Monthly precipitation totals were more than 150 % of normal for the southern tier of the state (aqua, dark aqua, and blue areas on map), including the Sonoita and Willcox AVAs. For much of central and west-central Arizona, totals were less than 75 % of normal, including the Verde Valley AVA (light yellow and yellow areas on map). Otherwise across the state, amounts were near normal (white areas on map). Precipitation during January 2023 was more than 150 % of normal for much of the northern and eastern halves of the state, including the Sonoita and Verde Valley AVAs and part of the Willcox AVA.
Area-average total precipitation in January 2024 was 1.92 inches for the Sonoita AVA, 0.61 inches for the Verde Valley AVA, and 1.58 inches for the Willcox AVA. Respective January normals are 1.24, 1.45, and 1.07 inches.
Total precipitation last month was 0.78 and 1.08 inches at the AZMet Bonita and Willcox Bench stations, respectively.
Dig further into daily weather summaries for the AZMet Bonita and Willcox Bench stations in the Willcox AVA
Learn more about PRISM climate data
cvn-recap-202402-pptPercentNormal.png
The Outlook for February Temperature and Precipitation
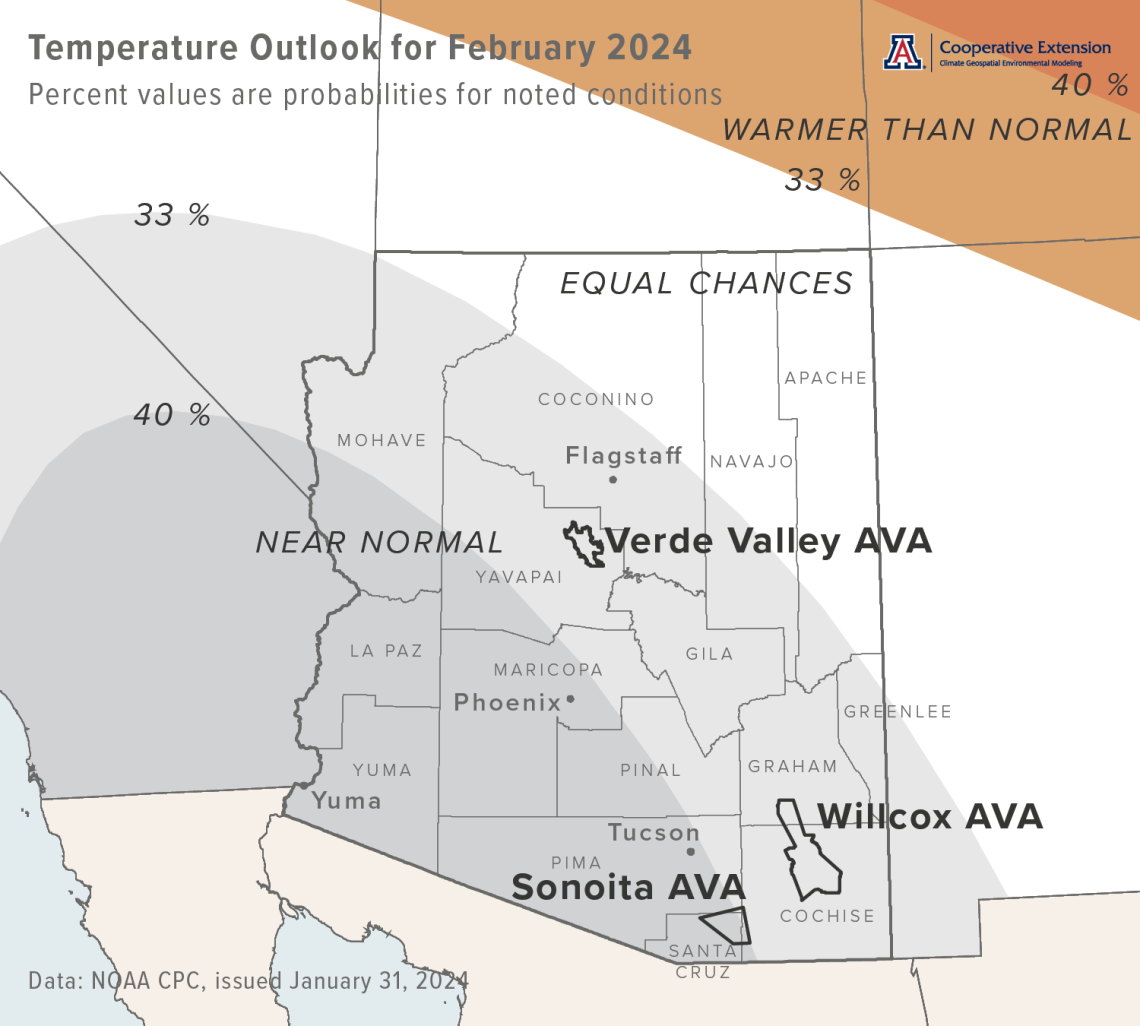
Temperatures over the course of this month have a slight increase in chances for being near the 1991-2020 normal across all but the northeastern corner of Arizona (light gray and gray areas on map). For the northeastern corner, there are equal chances for below-, near-, or above-normal temperatures (white area on map). Monthly temperatures in February last year were 3 to 5 °F below normal for much of the southern half of the state, and more than 5 °F below normal for much of the northern half.
Area-average maximum and minimum temperatures during February 2023 were 56.5 and 28.5 °F for the Sonoita AVA, 58.1 and 29.5 °F for the Verde Valley AVA, and 59.0 and 29.4 °F for the Willcox AVA. Respective February normals are 61.2 and 33.2 °F, 61.6 and 32.9 °F, and 63.1 and 32.7 °F.
Temperature in February last year ranged between 75.0 and 14.9 °F at the AZMet Bonita station and between 76.6 and 14.4 °F at the AZMet Willcox Bench station.
cvn-outlook-202402-temp.png
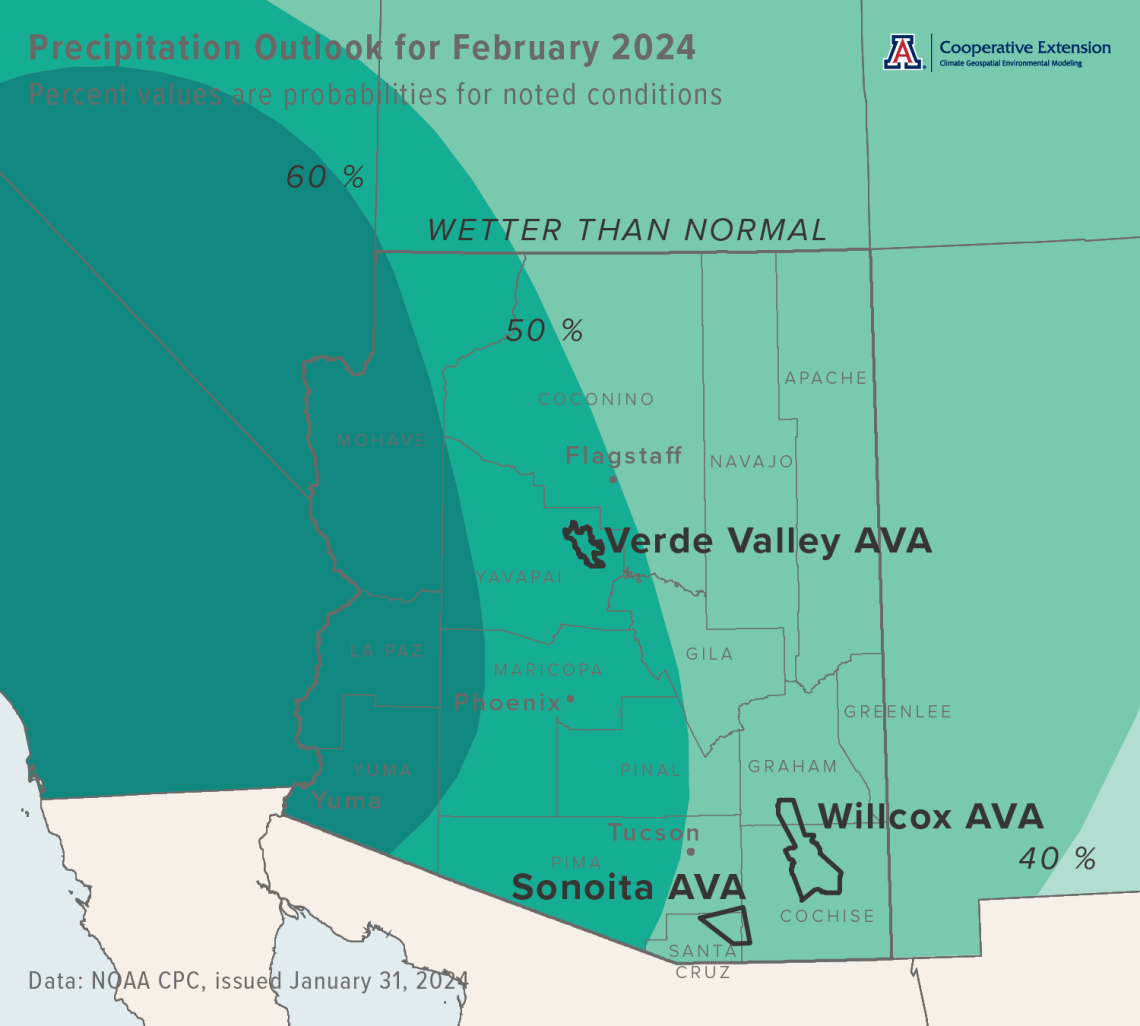
Precipitation totals for this month have a moderate increase in chances to be above normal across the western half of the state (dark aqua and aqua areas on map). For the eastern half, there is a slight increase in chances for totals to be above normal (light aqua area on map). Precipitation during February 2023 was less than 75 % of normal for most of the western half of Arizona, and near normal for most of the eastern half.
Area-average precipitation totals in February 2023 were 1.27 inches for the Sonoita AVA, 0.95 inches for the Verde Valley AVA, and 0.80 inches for the Willcox AVA. Respective February normals are 1.12, 1.43, and 0.93 inches.
Total precipitation in February last year was 0.68 and 0.58 inches at the AZMet Bonita and Willcox Bench stations, respectively.
To stay informed of long-range temperature and precipitation possibilities beyond the coverage of a standard weather forecast, check in, too, with the six-to-ten-day outlook and eight-to-fourteen-day outlook issued daily by NOAA’s Climate Prediction Center.
cvn-outlook-202402-prcp.png
A Review of 2023 Growing Season Precipitation
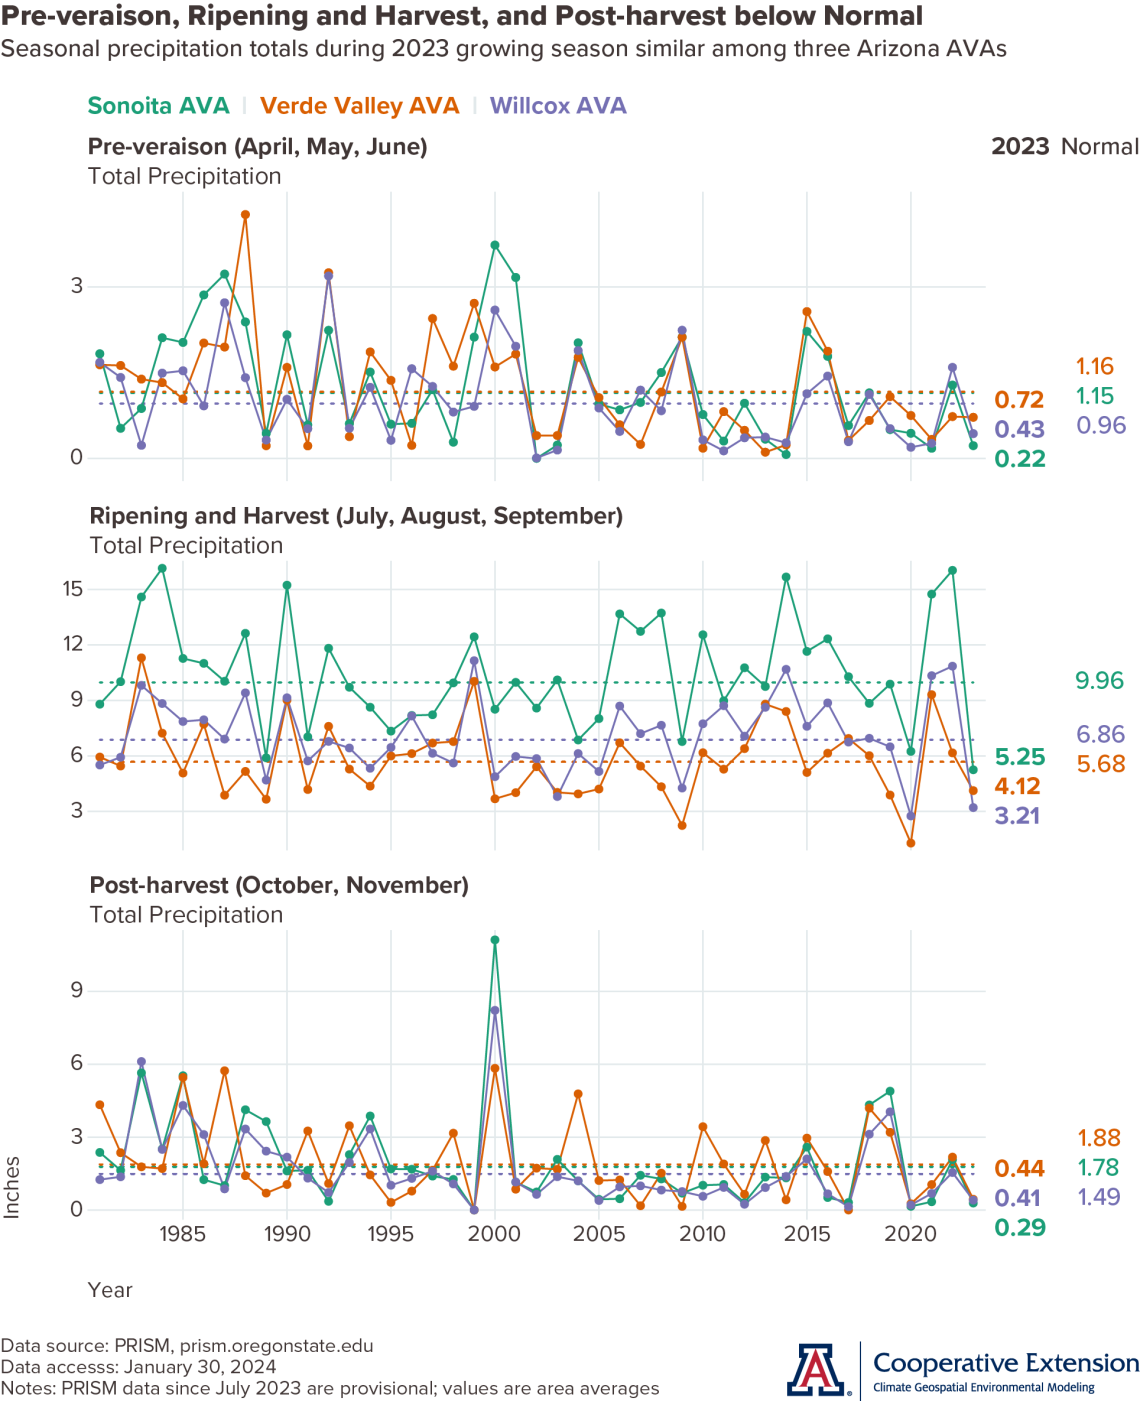
As the second part of our review of this past growing season, we focus on precipitation in the three Arizona AVAs. We again organize the information by different periods. For simplicity, pre-veraison includes the months of April, May, and June (top graph), ripening and harvest the months of July, August, and September (middle graph), and post-harvest the months of October and November (bottom graph).
Pre-veraison precipitation totals were below the 1991-2020 normal (dotted horizontal lines on graphs) for all three AVAs. This came on the heels of relatively wet conditions during the dormant season from December through March, when the Sonoita, Verde Valley, and Willcox AVAs measured above-normal totals of 6.45, 8.19, and 4.23 inches, respectively. Although below normal in 2023, pre-veraison totals typically are only about one or two inches, helping define what is the dry and, as the case may be in June, hot foresummer that precedes the monsoon. The relatively low precipitation from April through June does little to counter the roughly 0.20 to 0.40 inches lost daily to evapotranspiration at this time of year, as estimated at the AZMet Bonita and Willcox Bench stations in the Willcox AVA. It does, however, help keep some disease pressure and related management needs relatively lower.
Precipitation totals during the ripening and harvest period were below normal for all three AVAs, perhaps most noticeably for the Sonoita and Willcox AVAs, where deficits were on the order of three to five inches. Deficits in the Verde Valley were only about one to two inches. Also more noticeable for the Sonoita and Willcox AVAs was having relatively dry conditions in 2023 follow two vintages with near-record to record rainfall during ripening and harvest. Identifying varieties that did a better job handling either, or both, the hot-and-dry and cool-and-wet conditions of the past few years at this time of the growing season could help with varietal selection and hedge against challenging monsoon conditions.
Post-harvest precipitation totals had all three Arizona AVAs below their normal amounts of about one-and-a-half to two inches. With the growing season winding down and wrapping up, rainfall at this time of the year nonetheless factors into some post-harvest activities like establishment of winter cover crops.
cvn-gsr-2024-01-30.png
Q & A from the Winter Viticulture Symposium
We continue this month with this section to answer attendee questions from the recent Winter Viticulture Symposium about Arizona climate and wine grape growing. There are two questions to address that we suspect point to a few slides towards the end of the “From AZMet to Anthocyanins” presentation, in particular to what might be next for better understanding climate and fruit composition. But, before we get to those questions, a quick recap of that presentation material.
Thus far in our work on the climate-composition issue, the approach has been to look for correlations between growing conditions during ripening and fruit composition at harvest. We expected to see patterns like higher minimum temperatures and higher pH or higher maximum temperatures and higher °Brix. To our surprise, we have seen more indication of effects of precipitation on pH, and wonder if they obscure those of temperature. Disentangling individual effects of temperature and precipitation on fruit composition is difficult, and due more to the correlation between those climate variables than to limited composition datasets. Temperatures during ripening generally are above normal when rainfall is below normal, and vice versa.
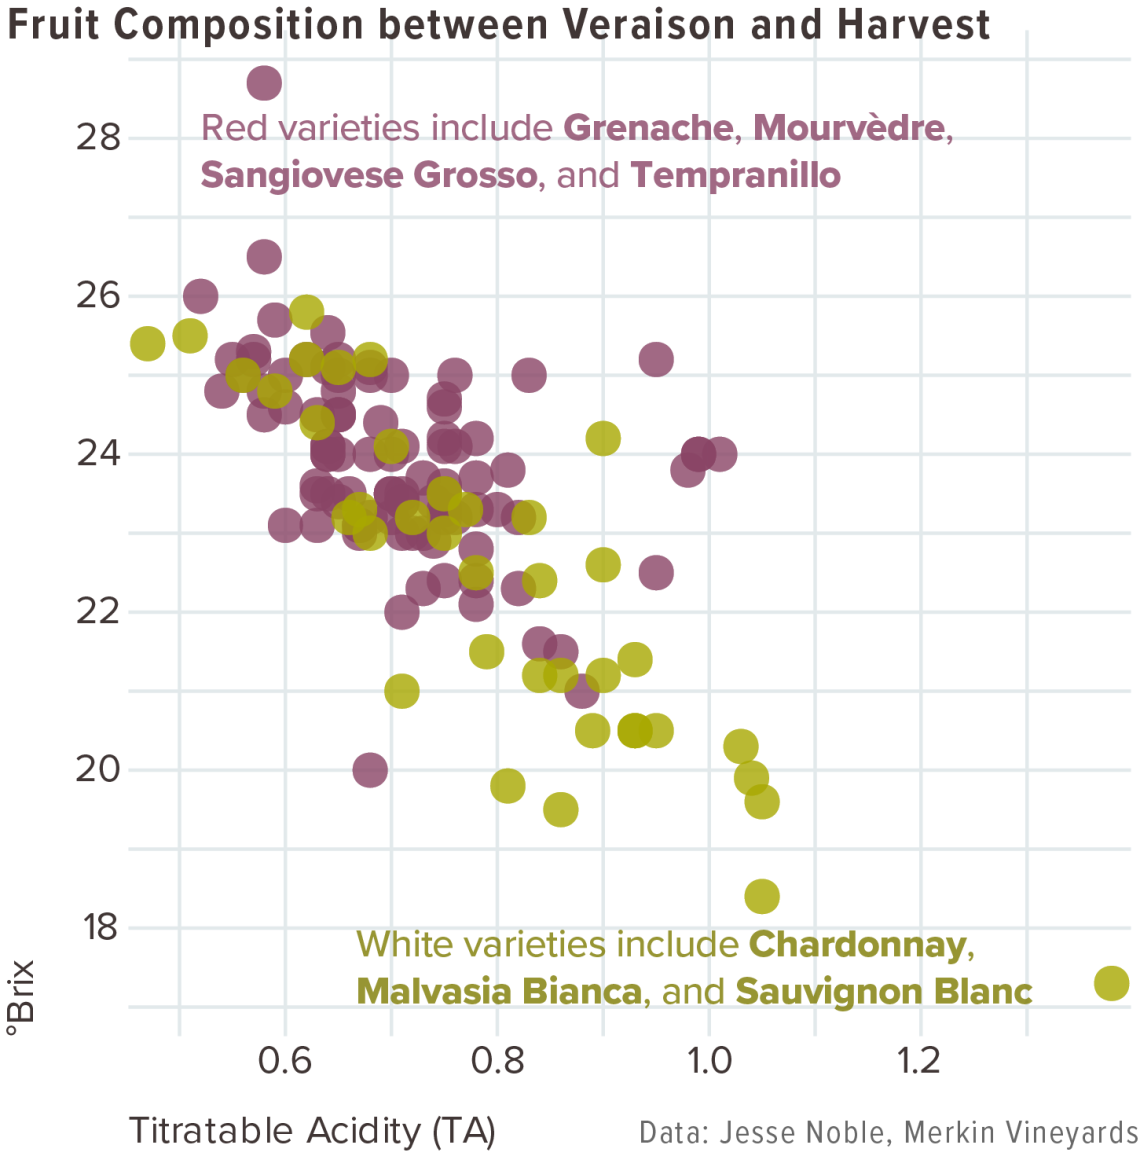
To make more progress on this, it might be best to turn the analysis approach on its head. That is, start with the composition data instead of the climate data. Using measurements of fruit composition like titratable acidity (TA), °Brix, and pH between veraison and harvest (yellow and purple data points on graph), growers and winemakers would identify preferred and less-preferred composition values. Based on measurement dates, one would then append corresponding temperature, precipitation, and other data that define the range of growing conditions leading up to preferred and less-preferred values. From this, one would build knowledge empirically of how different combinations of temperature and precipitation, or other variables, during ripening may affect fruit composition, within the context of vineyard and winery goals. This brings us to the symposium questions.
Is there an existing data program that binds this information together that is ready for input? Not yet, at least not outside of individual vineyards and wineries. But, as noted in our symposium presentation, there may be different pieces for putting together such a program, some related to collection of composition data and others to the analysis of it.
One piece could be services that measure fruit composition as a new capacity within an existing company, as a new business, or as a new University of Arizona Cooperative Extension effort. Another could be organization of composition data through state-level annual reporting such as an Arizona Vignerons Alliance-like database or as a part of a state crush report, should one be developed. Another could be data analysis, whether in-house at individual vineyards and wineries, or as a new service from an existing company, a new business, or a new University of Arizona Cooperative Extension effort. Options here certainly are not exhaustive and may be mixed and matched, depending on industry needs and interests.
You have likely noticed that some options would offer more standardized composition data for comparing across different vineyards, but take longer to establish a database for analysis as such an effort would be new. Others, like utilizing existing composition data, might offer insight more quickly, but with less vineyard-to-vineyard comparability.
Will studies be expanded to include more vineyards, due to diversity in terroir? We are trying to do so. Including more vineyards would allow us to more quickly define the range of ripening conditions in the state and the composition values to which they correspond. If you have existing composition data and would like to discuss its analysis in a climate context, please contact us.
bmv-fruit-composition-analysis.png
Extra Notes
ADWR (Arizona Department of Water Resources) recently released the first of its Supply and Demand Assessments, examining groundwater status in all 51 basins across the state. Results are available through a new web site and interactive dashboard.
Like last month, different influences look to be acting on where the winter storm track will track over North America – and if it will track over the Southwest – during February, including the current El Niño event and other global climate phenomena like the Madden-Julian Oscillation. Regarding the former, there is a greater than 90 % chance that it continues through the February through April timeframe, when its influence on regional temperature and precipitation could be significant.
The University of Arizona Controlled Environment Agriculture Center in Tucson, site of the Winter Viticulture Symposium last month, will soon host a three-day short-course on greenhouse crop production and engineering design. All experience levels are welcome.
For those of you in southeastern Arizona, including the Sonoita and Willcox AVAs, Cooperative Extension manages an email listserv in coordination with the Tucson forecast office of the National Weather Service to provide information in the days leading up to agriculturally important events, like cold-air outbreaks and the occasional winter storm. Please contact us if you'd like to sign up.
And for those of you in north-central and northeastern Arizona, including the Verde Valley AVA, Cooperative Extension also now manages an email listserv in coordination with the Flagstaff forecast office of the National Weather Service to provide similar information for this part of the state. Please contact us if you'd like to sign up.
Undergraduate students in the College of Agriculture and Life Sciences at the University of Arizona are looking for internships with businesses and companies in the viticulture and winery industries. Please contact Danielle Buhrow, Senior Academic Advisor and Graduate Program Coordinator in the Department of Agricultural and Resource Economics, for more information.
Please feel free to give us feedback on this issue of the Climate Viticulture Newsletter, suggestions on what to include more or less often, and ideas for new topics.
Did someone forward you this newsletter? Please contact us to subscribe.
Have a wonderful February!
With current and past support from:

