
Climate Viticulture Newsletter - 2024 January
< Back to Climate Viticulture Newsletter
Hello, everyone!
This is the January 2024 issue of the Climate Viticulture Newsletter – a quick look at some timely climate topics relevant to wine grape growing in Arizona.
IN THIS ISSUE
- A Recap of December Temperature and Precipitation
- The Outlook for January Temperature and Precipitation
- A Review of 2023 Growing Season Temperature
- Q & A from the Winter Viticulture Symposium
- Extra Notes
A Recap of December Temperature and Precipitation
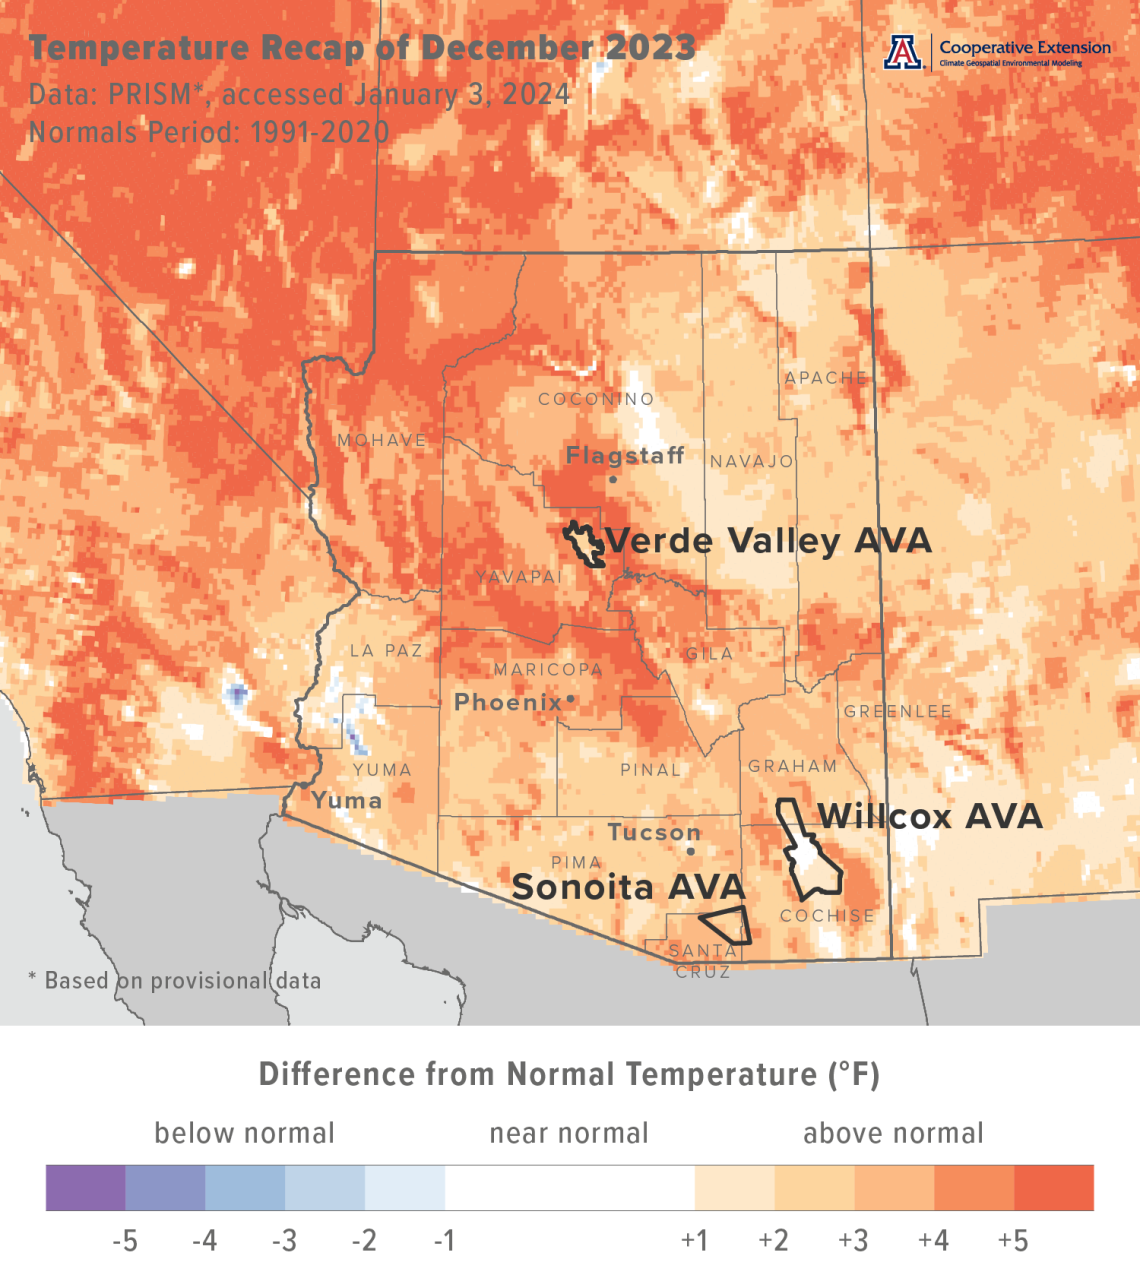
Monthly average temperatures were 1 to 4 °F above the 1991-2020 normal for much of the state (light orange and orange areas on map), including all of the Sonoita and Verde Valley AVAs and some of the Willcox AVA. Several areas in central and northwestern Arizona recorded temperatures more than 4 °F above normal (dark orange areas on map). For reference, monthly temperatures in December 2022 were 1 to 3 °F above normal for most of the eastern one-third of Arizona. Much of the rest of the state saw near-normal temperatures.
Area-average maximum and minimum temperatures during December 2023 were 61.8 and 34.2 °F for the Sonoita AVA, 60.6 and 32.8 °F for the Verde Valley AVA, and 61.3 and 31.3 °F for the Willcox AVA. Respective December normals are 58.3 and 31.5 °F, 57.2 and 30.0 °F, and 59.0 and 30.2 °F.
Temperatures last month ranged between 71.8 and 23.2 °F at the AZMet Bonita station in the Willcox AVA, and between 73.0 and 21.7 °F at the AZMet Willcox Bench station.
cvn-recap-202401-tmeanDepartureNormal.png
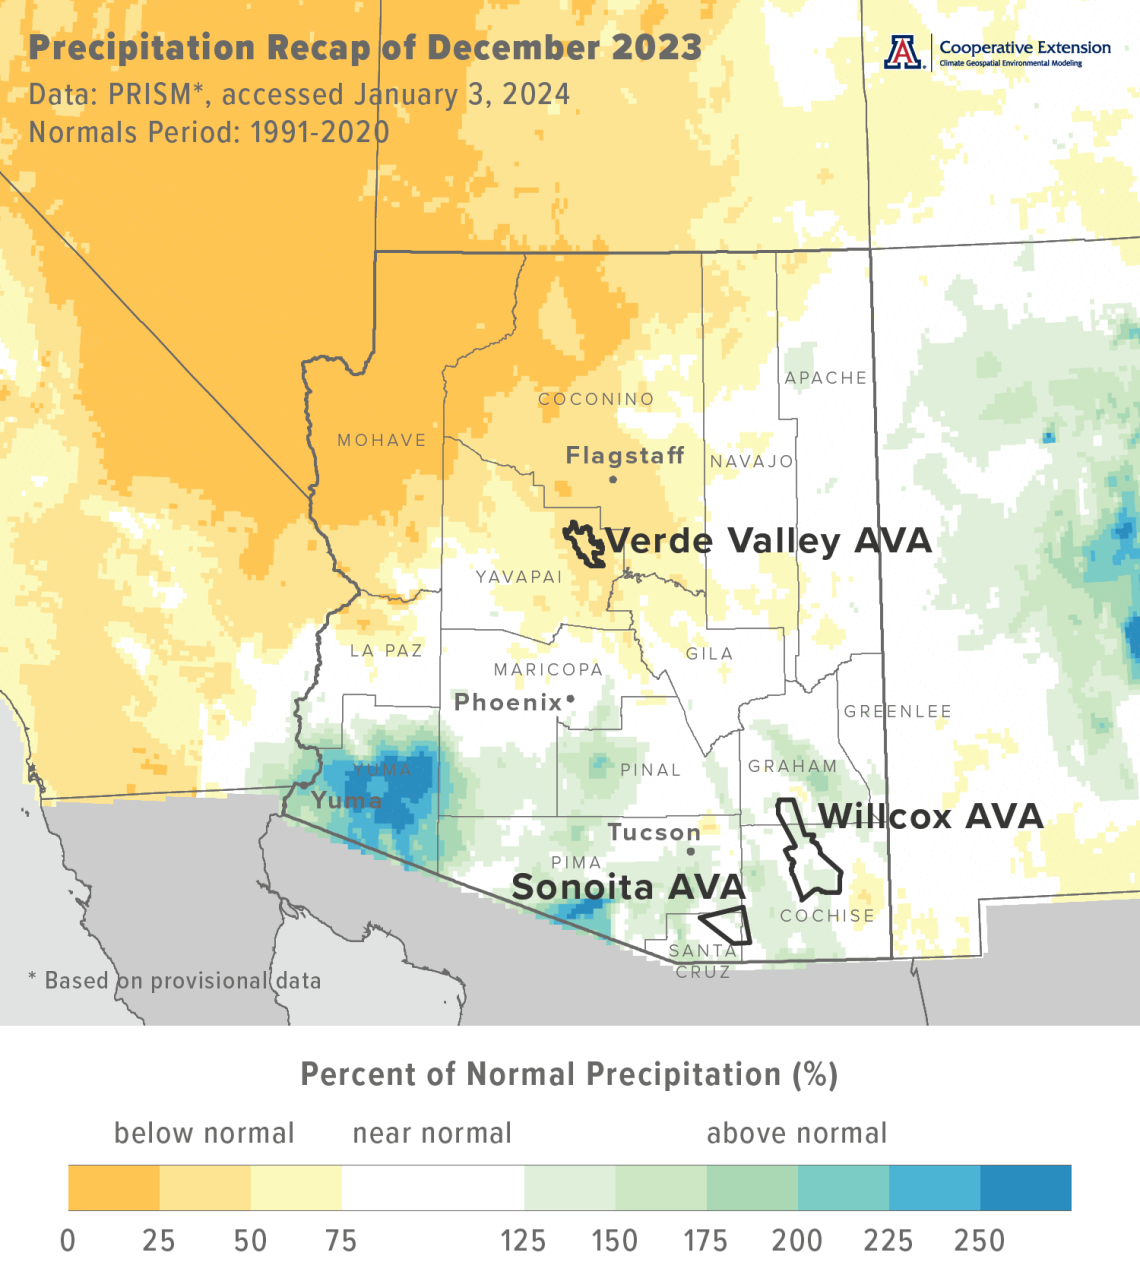
Monthly precipitation totals were less than 75 % of normal for much of northwestern Arizona (light yellow, yellow, and dark yellow areas on map), including the Verde Valley AVA. Otherwise, totals were near normal (white areas on map), with scattered areas along the southern tier of the state measuring more than 125 % of normal (light aqua, aqua, and blue areas on map), including parts of the Sonoita and Willcox AVAs. Precipitation during December 2022 was more than 125 % of normal for much of the south-central, east-central, and extreme northwestern parts of the state. Otherwise, totals for many locations were near normal.
Area-average total precipitation in December 2023 was 1.58 inches for the Sonoita AVA, 0.55 inches for the Verde Valley AVA, and 1.33 inches for the Willcox AVA. Respective December normals are 1.40, 1.37, and 1.08 inches.
Total precipitation last month was 1.52 and 1.08 inches at the AZMet Bonita and Willcox Bench stations, respectively.
Dig further into daily weather summaries for the AZMet Bonita and Willcox Bench stations in the Willcox AVA
Learn more about PRISM climate data
cvn-recap-202401-pptPercentNormal.png
The Outlook for January Temperature and Precipitation
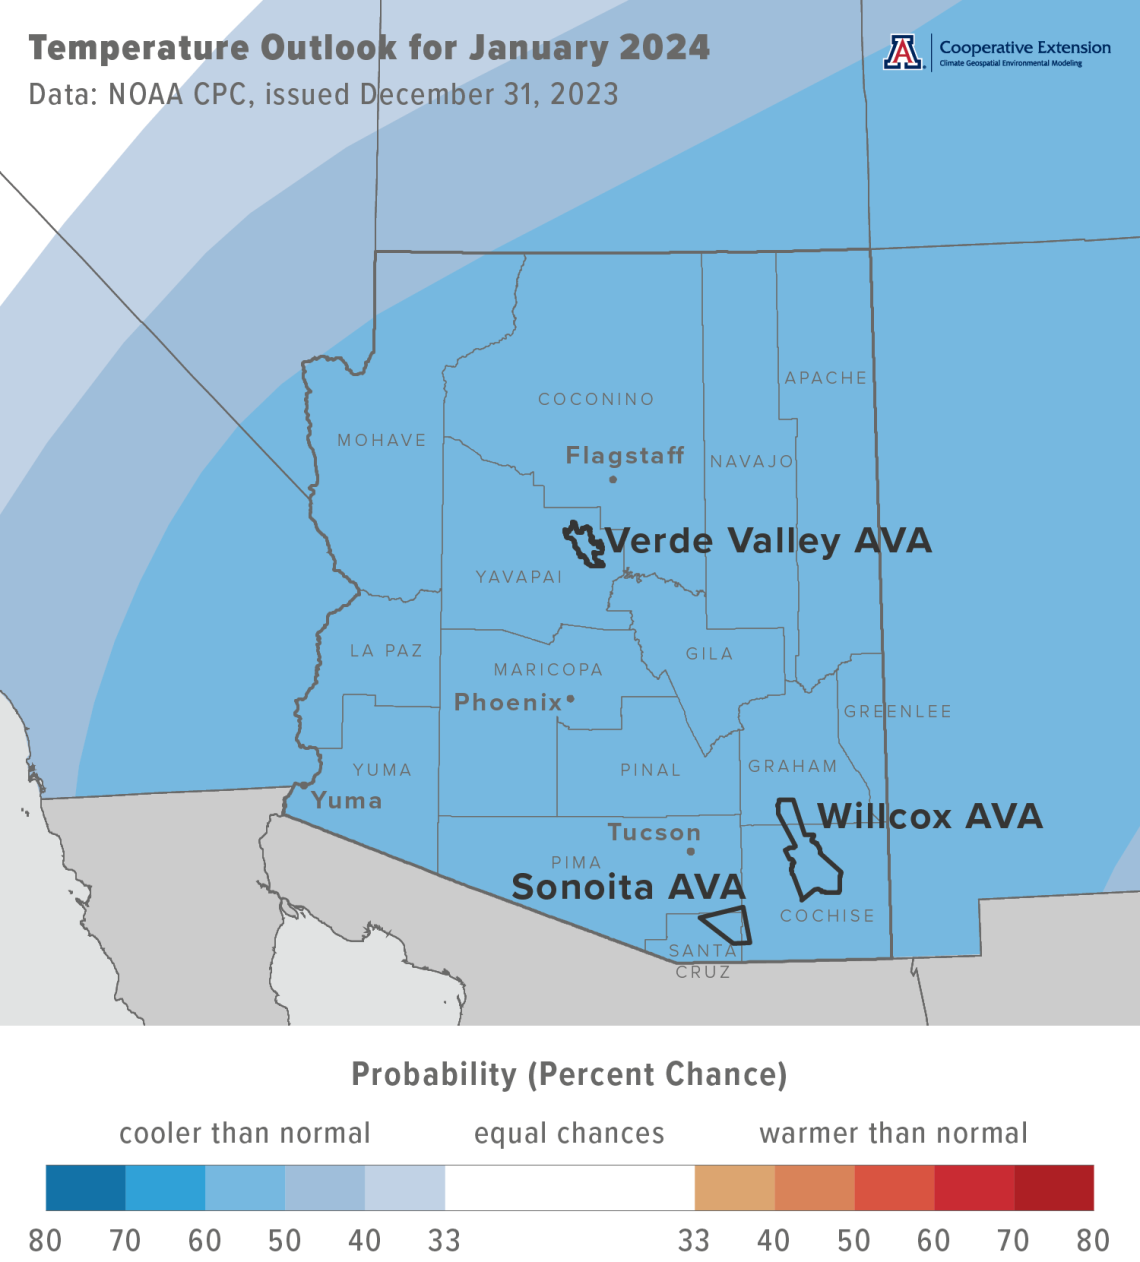
Temperatures over the course of this month have a moderate increase in chances for being below the 1991-2020 normal across almost all of Arizona (blue area on map). Monthly temperatures in January last year were 1 to 4 °F below normal for much of the state, including all three of the Arizona AVAs.
Area-average maximum and minimum temperatures during January 2023 were 56.3 and 29.7 °F for the Sonoita AVA, 52.1 and 30.6 °F for the Verde Valley AVA, and 57.4 and 28.0 °F for the Willcox AVA. Respective January normals are 58.7 and 31.2 °F, 58.1 and 30.6 °F, and 59.6 and 30.2 °F.
Temperatures in January last year ranged between 71.6 and 16.9 °F at the AZMet Bonita station and between 73.2 and 16.5 °F at the AZMet Willcox Bench station.
cvn-outlook-202401-temp.png
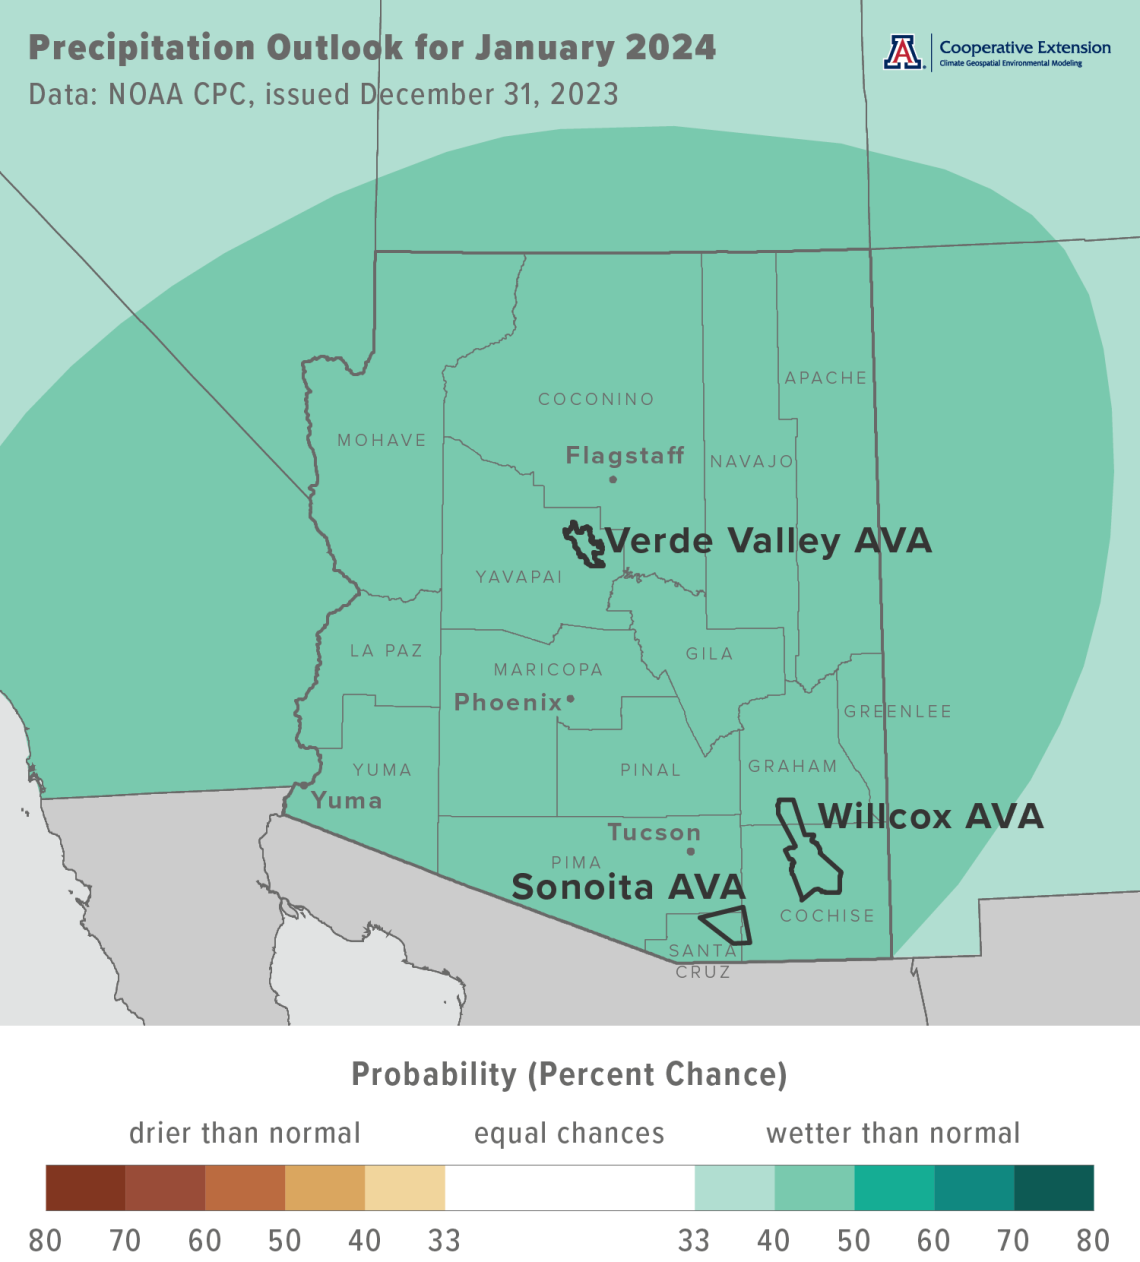
Precipitation totals for this month have a slight increase in chances for being above normal across all of the state (aqua area on map). Precipitation during January 2023 was more than 150 % of normal for much of the northern and eastern halves of the state, including the Sonoita and Verde Valley AVAs and part of the Willcox AVA.
Area-average precipitation totals in January 2023 were 2.17 inches for the Sonoita AVA, 3.00 inches for the Verde Valley AVA, and 1.44 inches for the Willcox AVA. Respective January normals are 1.24, 1.45, and 1.07 inches.
Total precipitation in January last year was 1.51 and 0.76 inches at the AZMet Bonita and Willcox Bench stations, respectively.
To stay informed of long-range temperature and precipitation possibilities beyond the coverage of a standard weather forecast, check in, too, with the six-to-ten-day outlook and eight-to-fourteen-day outlook issued daily by NOAA’s Climate Prediction Center.
cvn-outlook-202401-prcp.png
A Review of 2023 Growing Season Temperature
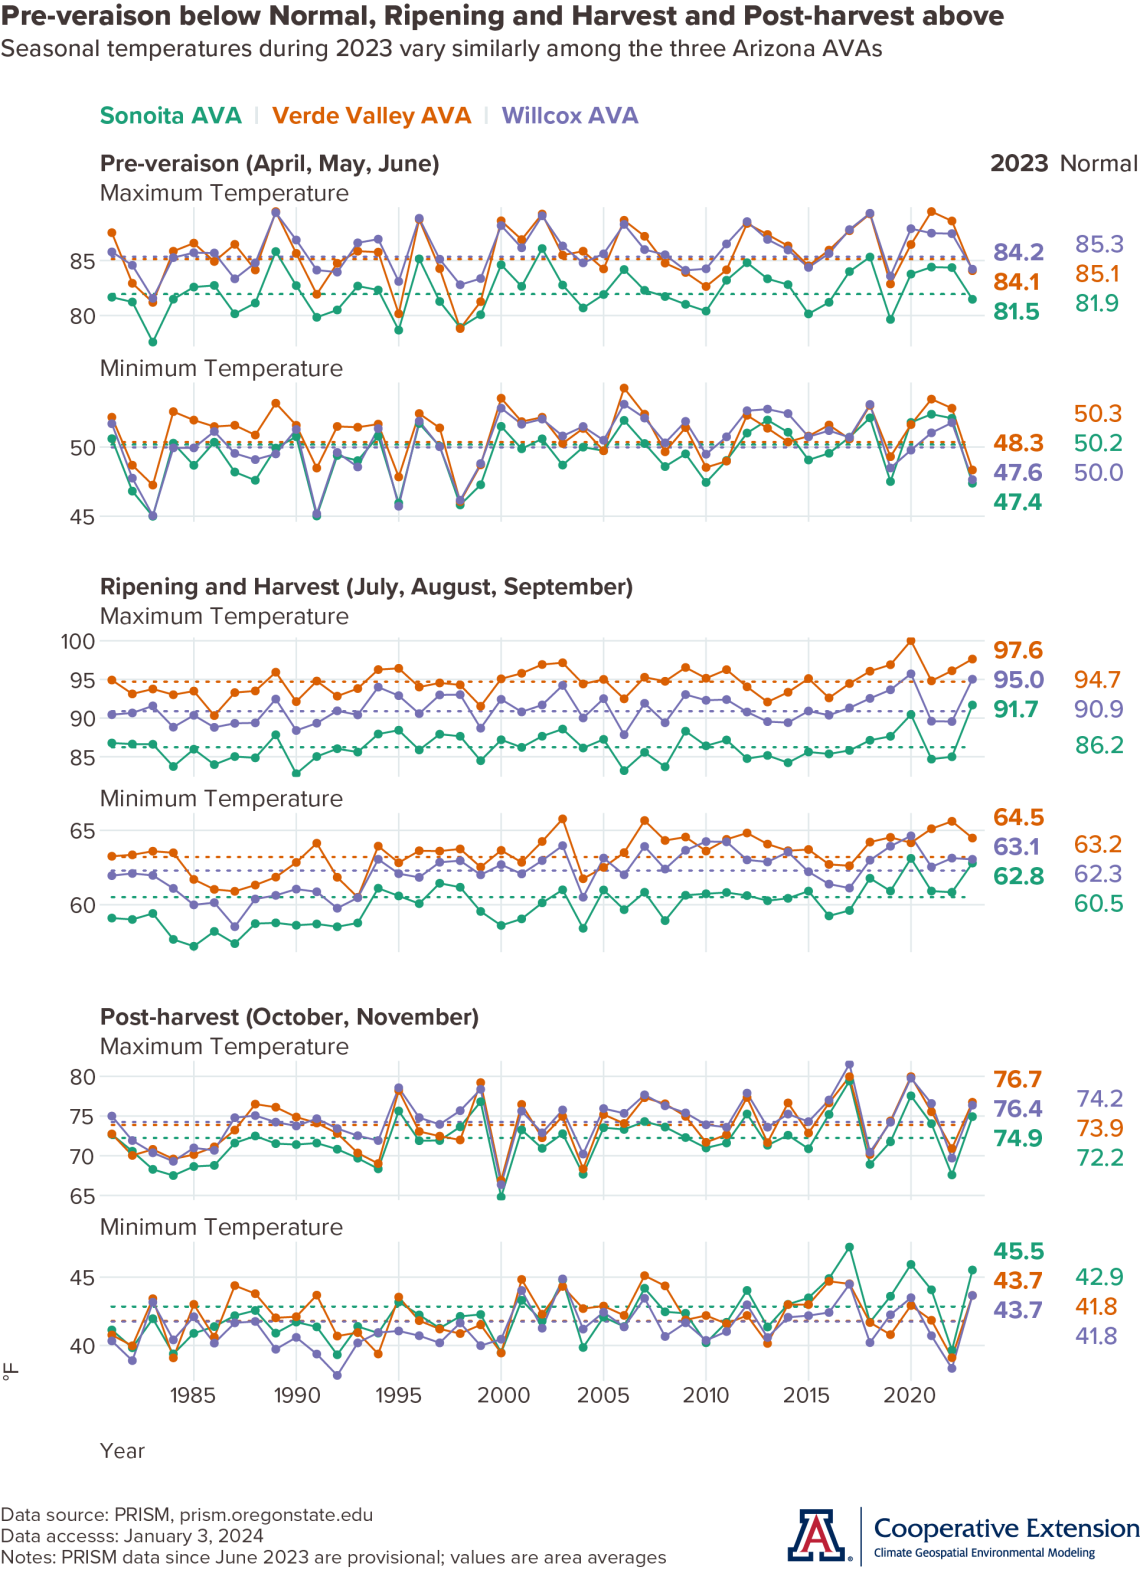
For the first part of our review of this past growing season, we focus on maximum and minimum temperatures in the three Arizona AVAs. We organize the data by different periods. For simplicity, pre-veraison includes the months of April, May, and June (top two graphs), ripening and harvest the months of July, August, and September (middle two graphs), and post-harvest the months of October and November (bottom two graphs).
In contrast to the previous three growing seasons, pre-veraison temperatures were below the 1991-2020 normal (dotted horizontal lines on graphs) for all three AVAs. Maximum temperatures averaged over this period were about 1 °F cooler, whereas minimum temperatures were 2 to 3 °F cooler. One of the effects of year-to-year variations in temperature during April, May, and June is on heat accumulation and the timing of growth stages between bud break and veraison. Generally, cooler conditions lengthen the time it takes for vines to go from the start of the growing season to the point when grapes start to ripen. As you can imagine, this has implications for when grapes ripen and the conditions under which they do so.
Like several recent growing seasons, temperatures during ripening and harvest were above normal for all three AVAs. Maximum temperatures averaged over this period were about 3 to 5 °F warmer, whereas minimum temperatures were 1 to 2 °F warmer. There’s little doubt that the lackluster monsoon this year had some say on these values, as less cloud cover and rain allow for more heat. There’s also little doubt that this part of the growing season is when climatic differences between the three Arizona AVAs show. Such differences might be a reason to suspect differences in fruit composition between the AVAs, to the extent that exposure to temperatures below 65 °F and above 95 °F affect aspects like balance between sugar levels and acidity as well as degradation of anthocyanins.
Also like several recent growing seasons, post-harvest temperatures were above normal for all three AVAs. Maximum temperatures averaged over this period were about 2 to 3 °F warmer, as were minimum temperatures. Year-to-year variations in post-harvest temperatures – in combination with first fall freeze dates and dormancy – influence carbon assimilation and storage that is important for the following growing season.
We’ll have a similar growing season review of precipitation in the issue next month.
cvn-gsr-2024-01-03.png
Q & A from the Winter Viticulture Symposium
For this and a few upcoming issues, we’ll have this section to answer attendee questions from the recent Winter Viticulture Symposium about Arizona climate and wine grape growing. This month, the general topic is weather stations.
Is there a potential to get other weather stations tied to the AVAs for different and more spread-out data across the area? Yes. One option is to purchase personal, non-network stations from one of several companies. Different station types are available, measuring different weather variables. Some of these companies, as well as others, provide web-based data displays of current and recent conditions from several such stations across an area. Another option is to join station networks like AZMet (Arizona Meteorological Network), which leads to the next question.
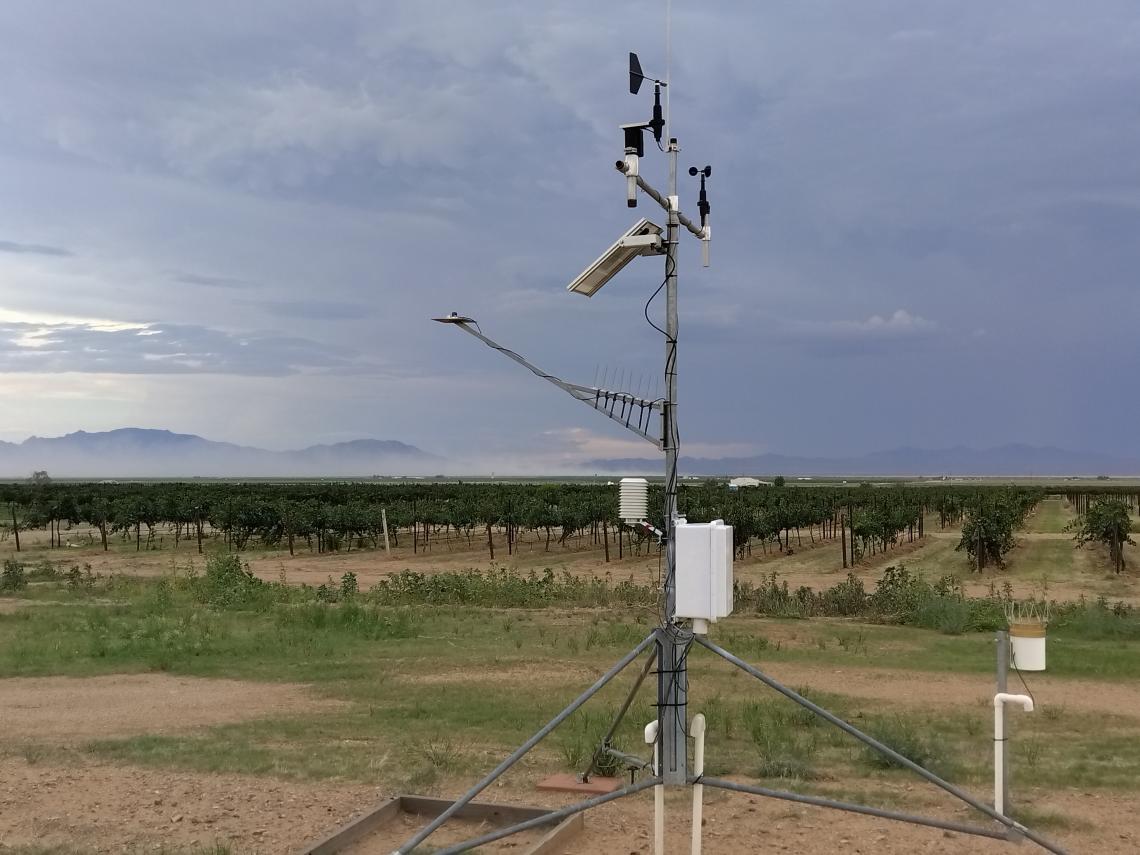
When and how do we get an AZMet station in other AVAs? With the help of local cooperators and sponsors, AZMet locates, maintains, and operates stations like the one at Willcox Bench (picture). Station construction, siting, installation, maintenance, and operation are standardized across AZMet, and follow best practices for such networks. Station cost and fees depend on support for AZMet from Cooperative Extension, other AZMet funding sources, travel and per diem rates, and cost of equipment and materials. For more information, please contact Jeremy Weiss, AZMet Program Manager. AZMet is a service provider of weather data and data applications, and part of University of Arizona Cooperative Extension.
Can AZMet benefit from information collected from individual vineyard stations, i.e., Davis-type equipment? Yes. With a new data system now in place, AZMet is building capacity to modernize its real-time system so that it can bring in both network and non-network data to a single web-based display of recent and current conditions.
az39-willcox-bench.JPG
Extra Notes
A variety of influences look to be acting on where the winter storm track will track over North America – and if it will track over the Southwest – during January, including the current El Niño event and other global climate phenomena like the Madden-Julian Oscillation and the Arctic Oscillation. Regarding the first, there is a greater than 95 % chance that it continues through the February through April timeframe, when its influence on regional temperature and precipitation could be significant. Although its current categorization is “strong”, please keep in mind that this does not imply that any related anomalies in our winter weather will be similarly characterized.
The American Journal of Enology and Viticulture recently published an article by Dr. Markus Keller, the keynote speaker at the Arizona Viticulture Summit last March, entitled, “Climate Change Impacts on Vineyards in Warm and Dry Areas: Challenges and Opportunities”. Topics include crop load, yield, fruit composition, and vine growth, physiology, and phenology.
The University of Arizona Controlled Environment Agriculture Center in Tucson, site of the Winter Viticulture Symposium last month, will soon host a three-day workshop on hydroponic vine crop production and a three-day short-course on greenhouse crop production and engineering design. All experience levels are welcome.
For those of you in southeastern Arizona, including the Sonoita and Willcox AVAs, Cooperative Extension manages an email listserv in coordination with the Tucson forecast office of the National Weather Service to provide information in the days leading up to agriculturally important events, like cold-air outbreaks and the occasional winter storm. Please contact us if you'd like to sign up.
And for those of you in north-central and northeastern Arizona, including the Verde Valley AVA, Cooperative Extension also now manages an email listserv in coordination with the Flagstaff forecast office of the National Weather Service to provide similar information for this part of the state. Please contact us if you'd like to sign up.
Undergraduate students in the College of Agriculture and Life Sciences at the University of Arizona are looking for internships with businesses and companies in the viticulture and winery industries. Please contact Danielle Buhrow, Senior Academic Advisor and Graduate Program Coordinator in the Department of Agricultural and Resource Economics, for more information.
Please feel free to give us feedback on this issue of the Climate Viticulture Newsletter, suggestions on what to include more or less often, and ideas for new topics.
Did someone forward you this newsletter? Please contact us to subscribe.
Have a wonderful January!
With current and past support from:

