
Climate Viticulture Newsletter - 2022 August
< Back to Climate Viticulture Newsletter
Hello, everyone!
This is the August 2022 issue of the Climate Viticulture Newsletter – a quick look at some timely climate topics relevant to wine grape growing in Arizona.
July Recap | August Outlook | AVA Seasonal Analogs | Temperature Ranges and Ripening | Extra Notes
A Recap of July Temperature and Precipitation
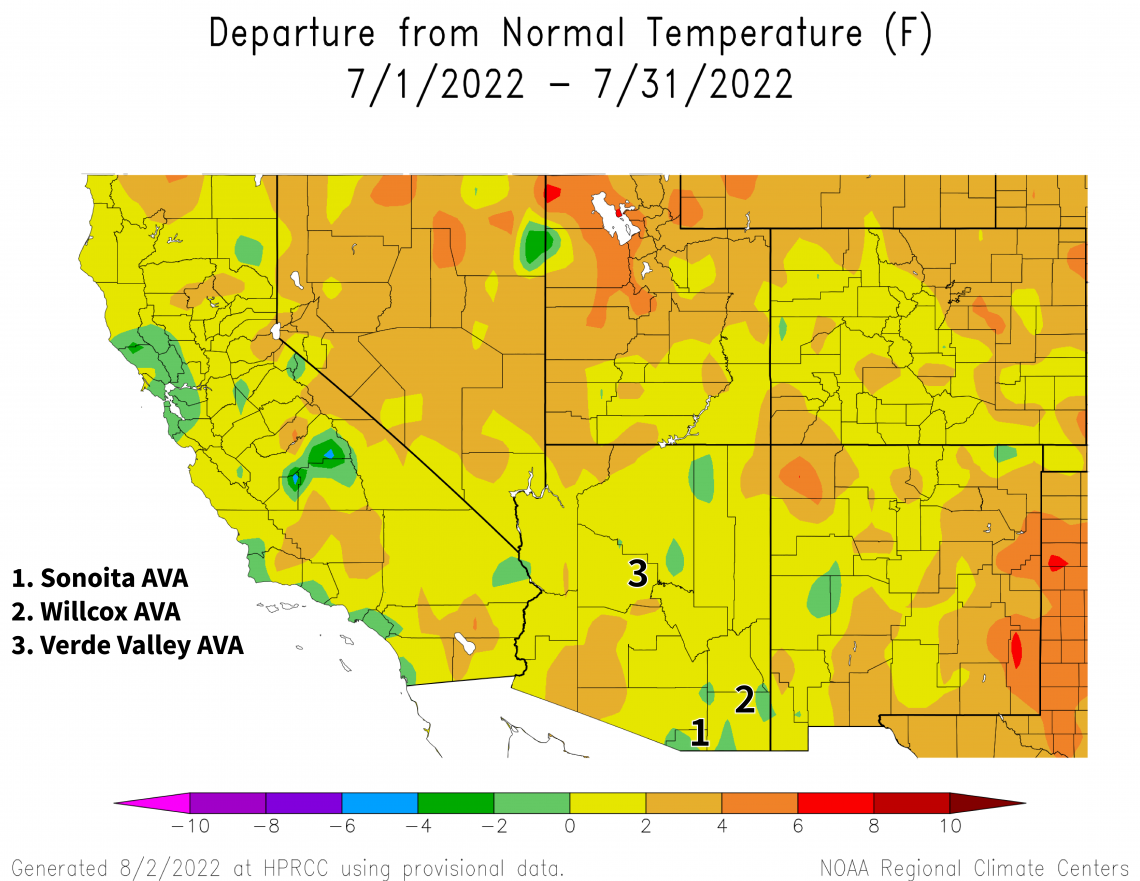
Monthly average temperatures were within 2 °F of the 1991-2020 normal for almost all of the state (light green and yellow areas on map), including the three Arizona AVAs. A few areas in the south-central part and the northern corners of the state were 2 to 4 °F above normal (orange areas on map). For reference, monthly temperatures in July last year were within 2 °F of normal for Arizona, except for the western and northern parts of the state where temperatures were 2 to 4 °F above normal.
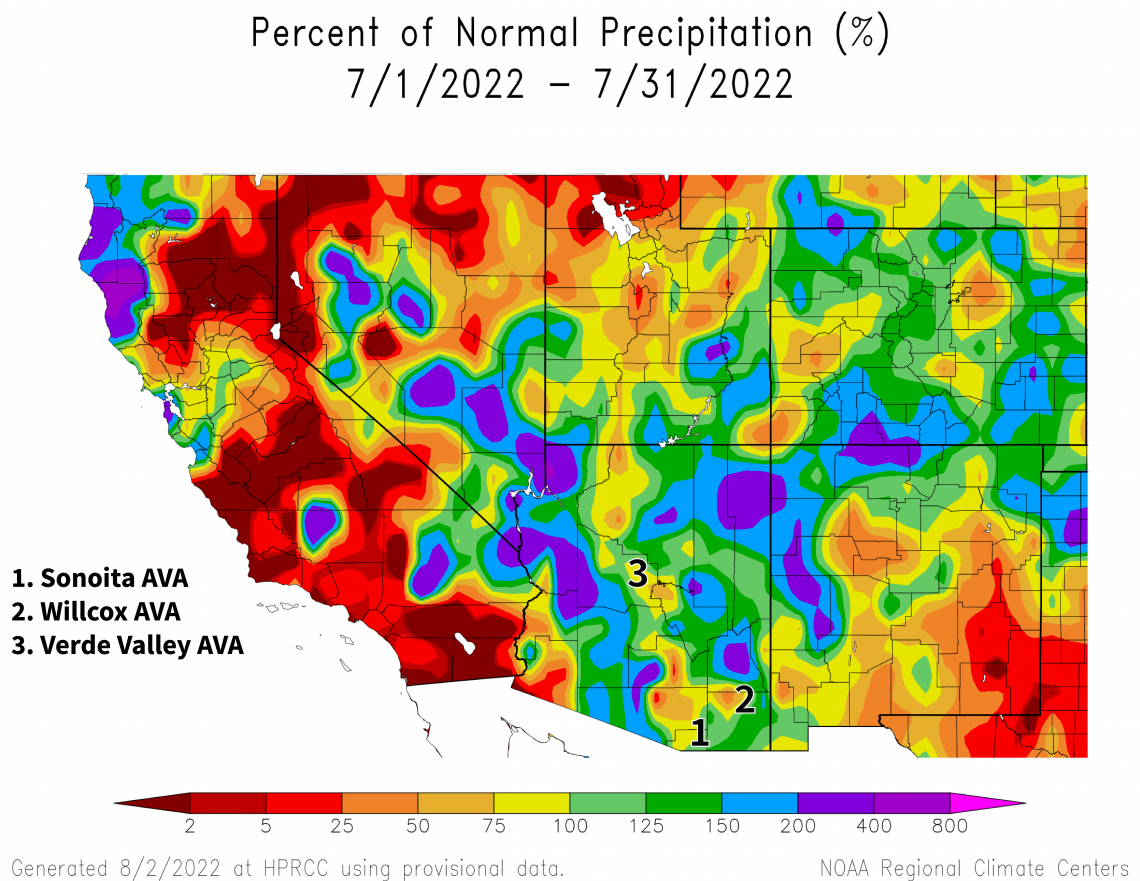
With a solid monsoon so far this year, monthly precipitation totals were near (yellow, light-green, and green areas on map) or above (blue and purple areas on map) the 1991-2020 normal for almost all of the state. As the three Arizona AVAs mostly fell in the former group, most amounts ranged from 1 to 3 inches in the Verde Valley AVA, 1 to 5 inches in the Willcox AVA, and 3 to 6 inches in the Sonoita AVA. Totals for July this year ran below those of July 2021 for most of Arizona, when a large part of the state received more than double – over 200 % of – the normal amount.
Up until July, the 2022 and 2021 growing seasons looked more similar than not, at least for the Willcox AVA. Chill and heat accumulation during dormancy suggested a relatively late bud break for both years. Also, pre-veraison temperatures were above normal and pre-veraison precipitation was near normal. With the start of the monsoon and the numbers from last month, could such similarity be fading away now that veraison and the ripening period are here? We’ll see how well this view holds as we dig into some more details a little later on.
View more NOAA ACIS climate maps
View more-detailed regional maps and station summaries of monsoon rainfall
The Outlook for August Temperature and Precipitation
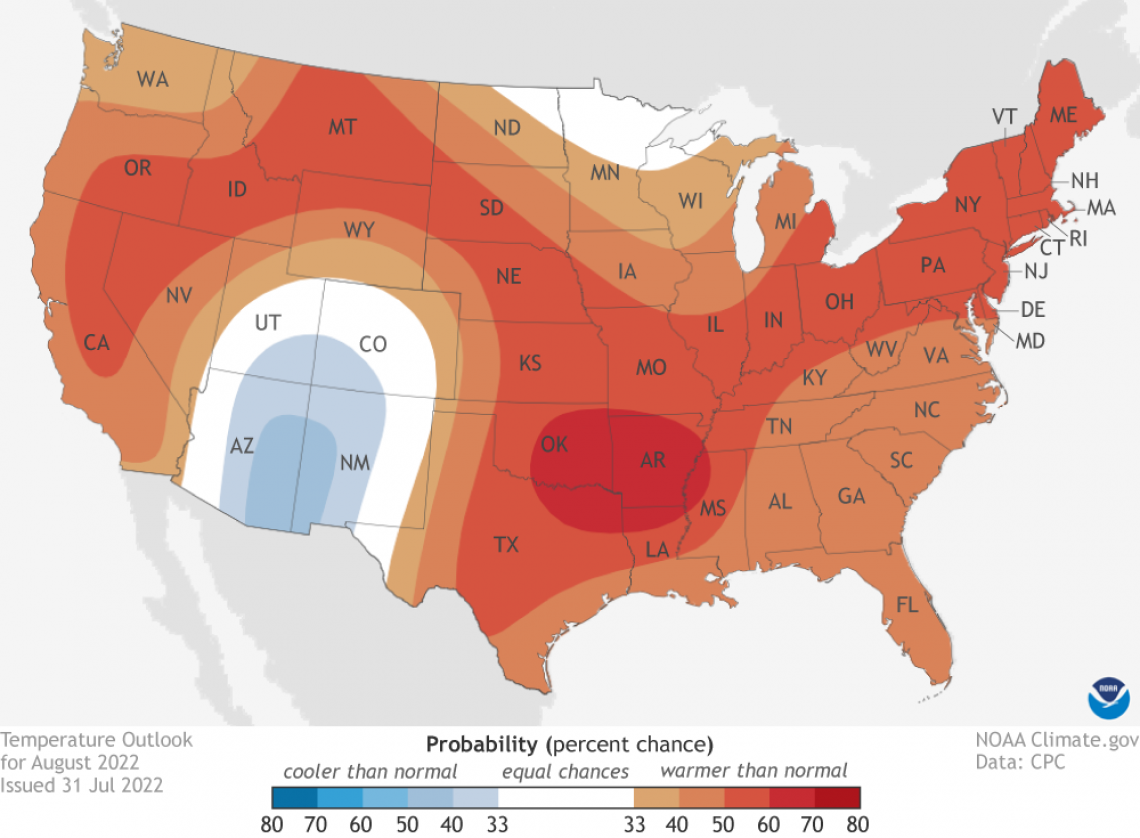
Temperatures over the course of this month have a slight increase in chances for being below – that’s right, below – the 1991-2020 normal across the eastern two-thirds of Arizona (light blue and blue areas on map). For the western one-third of the state, there are equal chances for below-, near-, or above-normal temperatures (white area on map). This break from the now rather typical anticipation for above-normal temperatures is related to our prospects for rain, which we’ll look at next. Monthly temperatures in August last year were near normal for almost all of the state.
2022-aug-temp-outlook-noaa-cpc.png
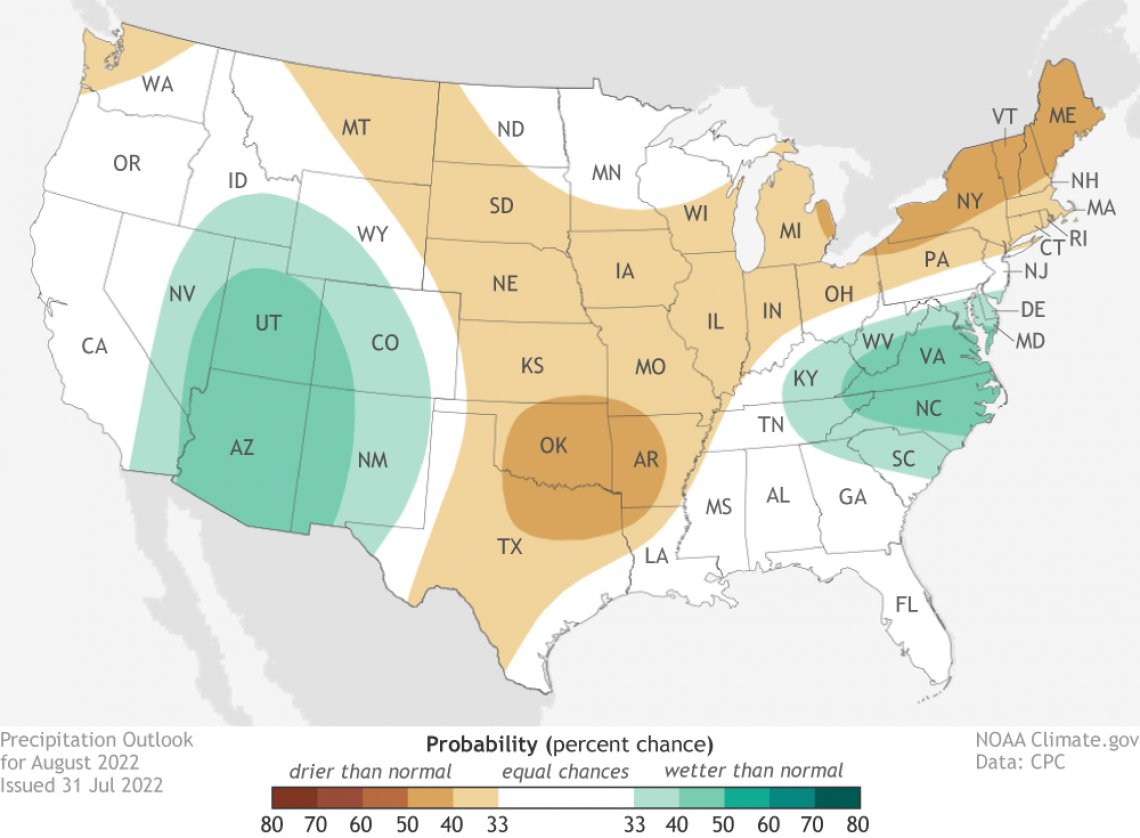
Precipitation totals for this month have a slight increase in chances for being above the 1991-2020 normal across all of Arizona (aqua area on map). Rainfall during August 2021 was more than 125 % of normal for much of the southern two-thirds of Arizona, including the Sonoita AVA. Amounts were near- or below-normal for the rest of the state, with the Verde Valley and Willcox AVAs falling in the former of these two groups.
Of course, the relative lack of expected heat has a lot to do with the humidity, cloudiness, and rainfall brought about in large part by the North American monsoon, which is expected to stay solid this month. Given this latter prospect, we’ll bring back what the Australian Wine Research Institute has for resources on flooding and wet vintages.
Read more about the August 2022 temperature and precipitation outlook
To stay informed of long-range temperature and precipitation possibilities beyond the coverage of a standard weather forecast, check in, too, with the six-to-ten-day outlook and eight-to-fourteen-day outlook issued daily by NOAA’s Climate Prediction Center.
2022-aug-prcp-outlook-noaa-cpc.png
Seasonal Analogs for Arizona AVAs
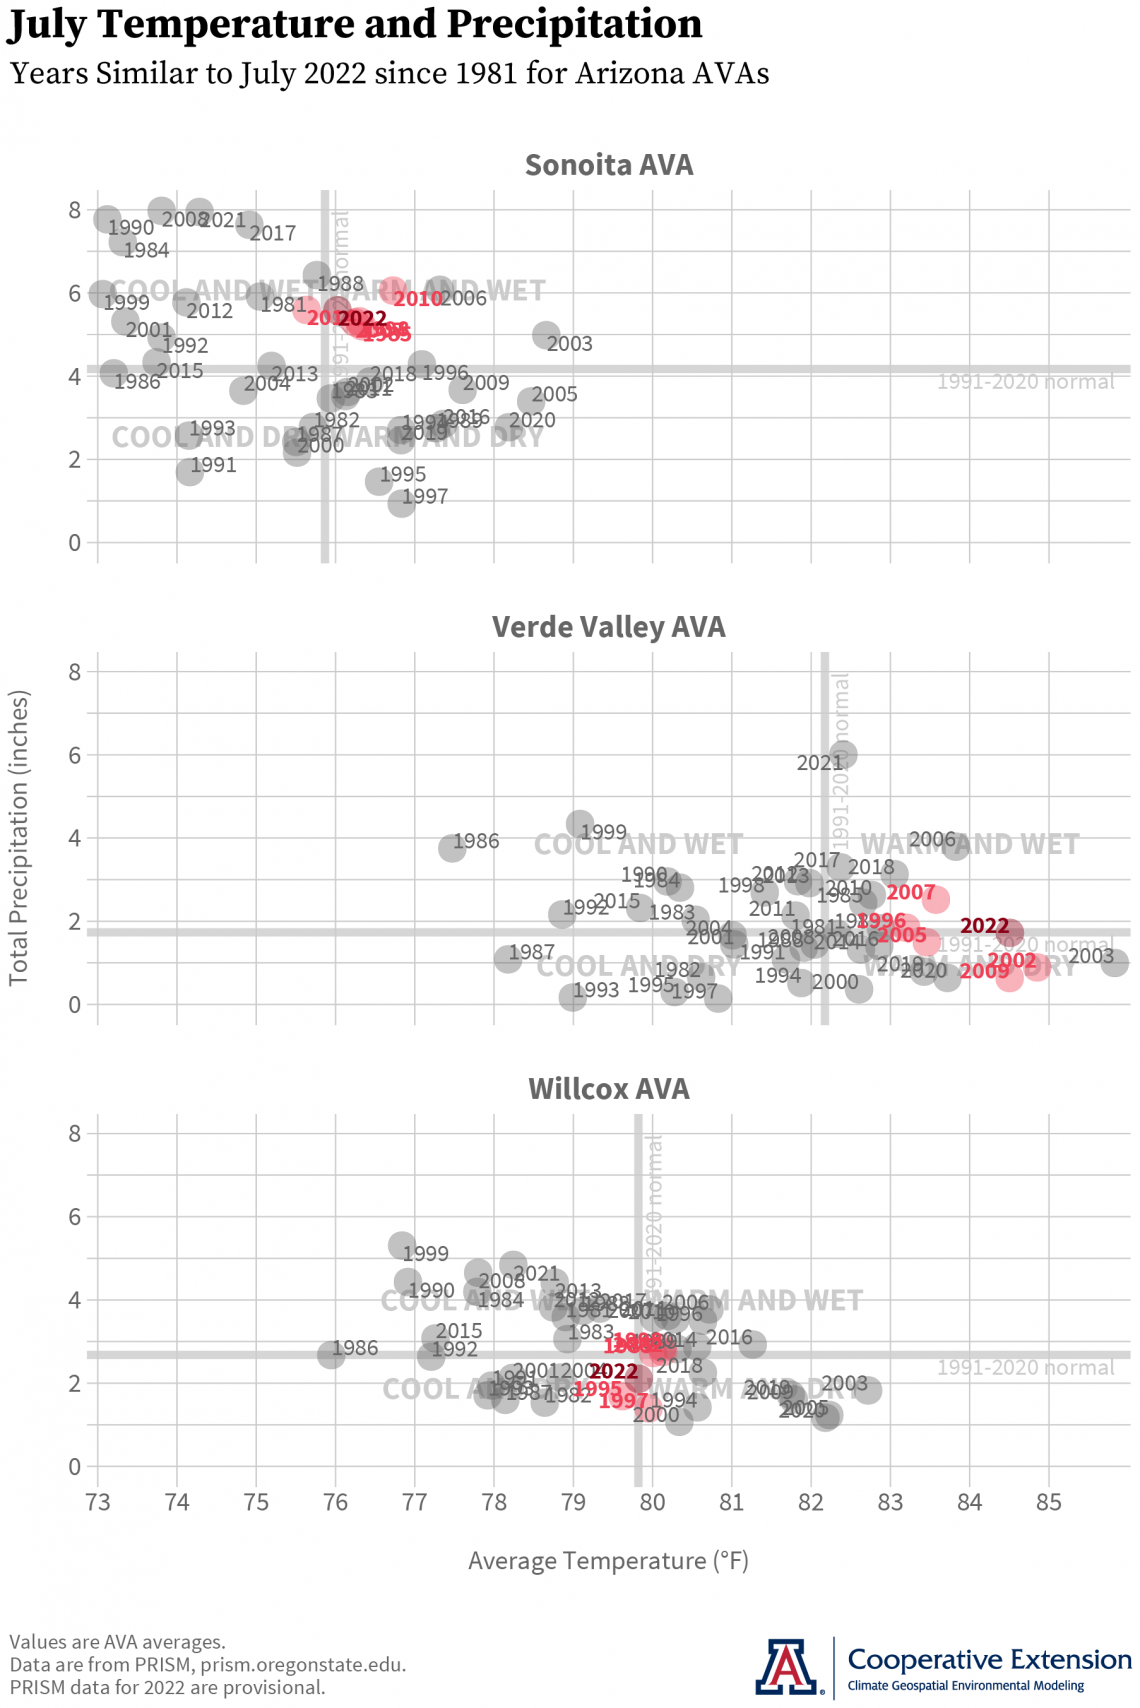
We switch the focus of this topic this month to the part of the growing season that generally includes the ripening, harvest, and post-harvest periods. Granted, it’s still early in the July-through-October time frame, but it’s this time of the year when the climatic differences between the three Arizona AVAs really start to show.
Last month, average temperature and total precipitation for both the Sonoita and Willcox AVAs were near the middle of their historical ranges (dark red dots near thick gray vertical and horizontal lines, respectively). Although rainfall also was close to the 1991-2020 normal for the Verde Valley AVA, average temperature was ranked among the warmest of the past 40 years, and about 4 °F warmer than the Willcox AVA and 8 °F warmer than the Sonoita AVA. Given these conditions, the closest analog years for July 2022 are:
2007, 1998, 2014, 1985, and 2010 for the Sonoita AVA
2002, 2005, 2009, 2007, and 1996 for the Verde Valley AVA
1995, 1985, 2002, 1997, and 1998 for the Willcox AVA
The lack of recent growing seasons in the above lists likely isn’t helpful for the many new wine grape growers in the state. To help with this, we’ll point out 2018 for the Sonoita and Willcox AVAs and both 2019 and 2020 for the Verde Valley AVA as far as July conditions from the past few years that were generally similar to those this past month.
cvn-202208-ava-analogs-2022-08-02.png
Temperature Ranges and the Ripening Period
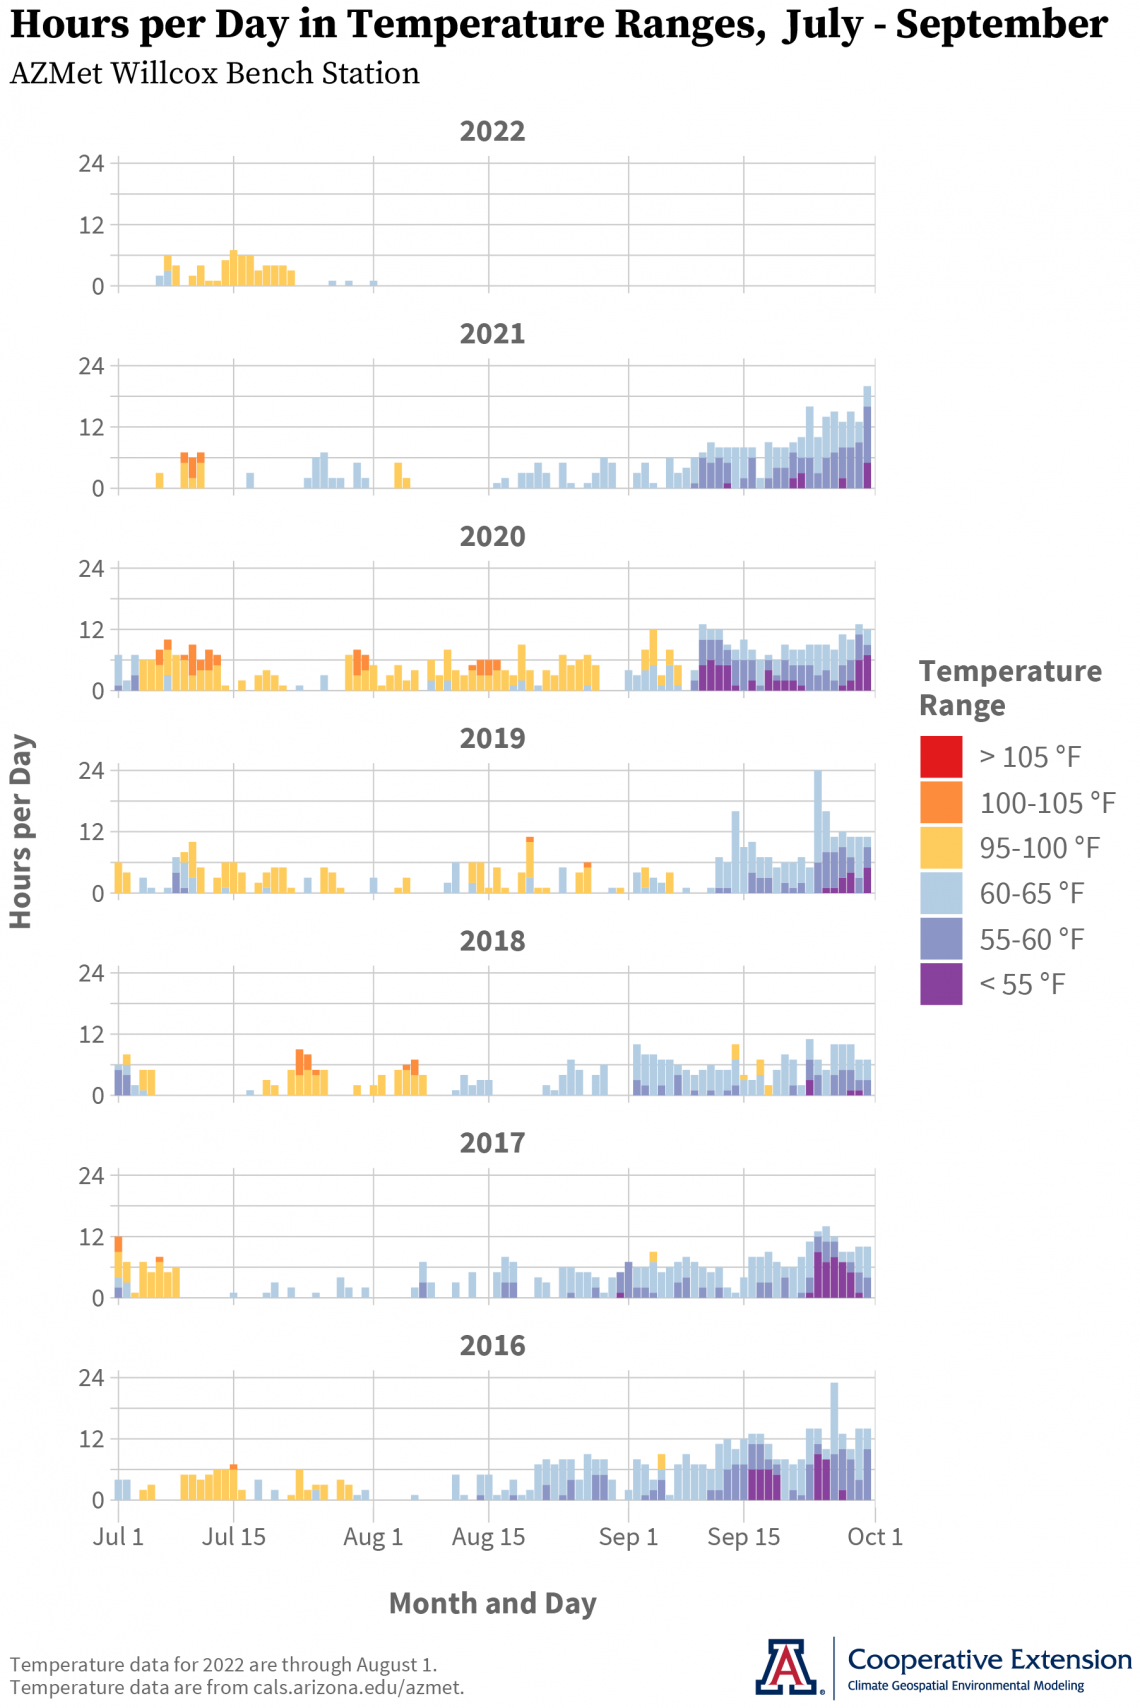
Now that the ripening period has started for many locations, we return to tracking hours of temperatures below 65 °F and above 95 °F. The reason why is that temperatures affect fruit quality through both early morning minimums and afternoon maximums as fruit ripens.
With temperature data from the AZMet Willcox Bench station in the Willcox AVA, there were just a few days with very few hours between 60 and 65 °F in early and late July (light blue bars in top graph). During the middle of last month, temperatures between 95 and 100 °F occurred three to six hours per day for several days (yellow bars in top graph). This temperature pattern coincides with the burst-break-burst monsoon pattern during last month.
In the previous section, we pointed out July 2018 as generally similar to July 2022 for the Willcox AVA in terms of monthly average temperature and total precipitation. Here, we see a difference between those two growing seasons. There were a few days in 2018 with a few hours per day between 55 and 60 °F (dark blue bars) at the beginning of the month and between 100 and 105 °F (orange bars) in the latter half. As noted above, temperatures didn’t hit these ranges in July 2022. To the extent that exposure to these temperature ranges influences fruit quality, 2016 and 2019 also may be comparable to this year so far.
Exposure to precipitation during the ripening period also may affect fruit quality, particularly when it comes to pH at harvest. Many of you may have noticed this with past vintages, and we have seen this in initial analyses of Arizona Vignerons Alliance data that we presented at the annual conference of the American Society for Enology and Viticulture (ASEV) this past June. With a subset of these data comparing the most common varieties from vintages between 2009 and 2018 for the three Arizona AVAs, greater precipitation appears to correlate with higher pH values. We’ll continue to work on this project funded by the Arizona Department of Agriculture and to discuss this information with you.
A rare La Niña three-peat this coming fall and winter continues to be possible. There now is a 60 % chance that still-current La Niña conditions will persist during the July-through-September period, and a 62 to 66 % chance that they continue through fall and into early winter 2022. This is the most recent official forecast for ENSO, or El Niño Southern Oscillation, parts of the atmosphere and ocean across the tropical Pacific Ocean that cause El Niño and La Niña events.
The solid monsoon so far this year has made slight improvements to regional drought conditions for some areas in Arizona and continues to curb wildland fire conditions in the state. There is a normal potential this month for significant wildland fires for all of Arizona.
For those of you in southeastern Arizona, including the Sonoita and Willcox AVAs, Cooperative Extension manages an email listserv in coordination with the Tucson forecast office of the National Weather Service to provide information in the days leading up to agriculturally important events, like monsoon bursts and breaks. Please contact us if you'd like to sign up.
And for those of you in north-central and northeastern Arizona, including the Verde Valley AVA, Cooperative Extension also now manages an email listserv in coordination with the Flagstaff forecast office of the National Weather Service to provide similar information for this part of the state. Please contact us if you'd like to sign up.
Undergraduate students in the College of Agriculture and Life Sciences at the University of Arizona are looking for internships with businesses and companies in the viticulture and winery industries during 2022. Please contact Danielle Buhrow, Senior Academic Advisor and Graduate Program Coordinator in the Department of Agricultural and Resource Economics, for more information.
Please feel free to give us feedback on this issue of the Climate Viticulture Newsletter, suggestions on what to include more or less often, and ideas for new topics.
Did someone forward you this newsletter? Please contact us to subscribe.
Have a wonderful August!
With current and past support from:

