
Climate Viticulture Newsletter - 2022 July
< Back to Climate Viticulture Newsletter
Hello, everyone!
This is the July 2022 issue of the Climate Viticulture Newsletter – a quick look at some timely climate topics relevant to wine grape growing in Arizona.
June Recap | July Outlook | AVA Seasonal Analogs | Growing Season Heat Accumulation | Extra Notes
A Recap of June Temperature and Precipitation
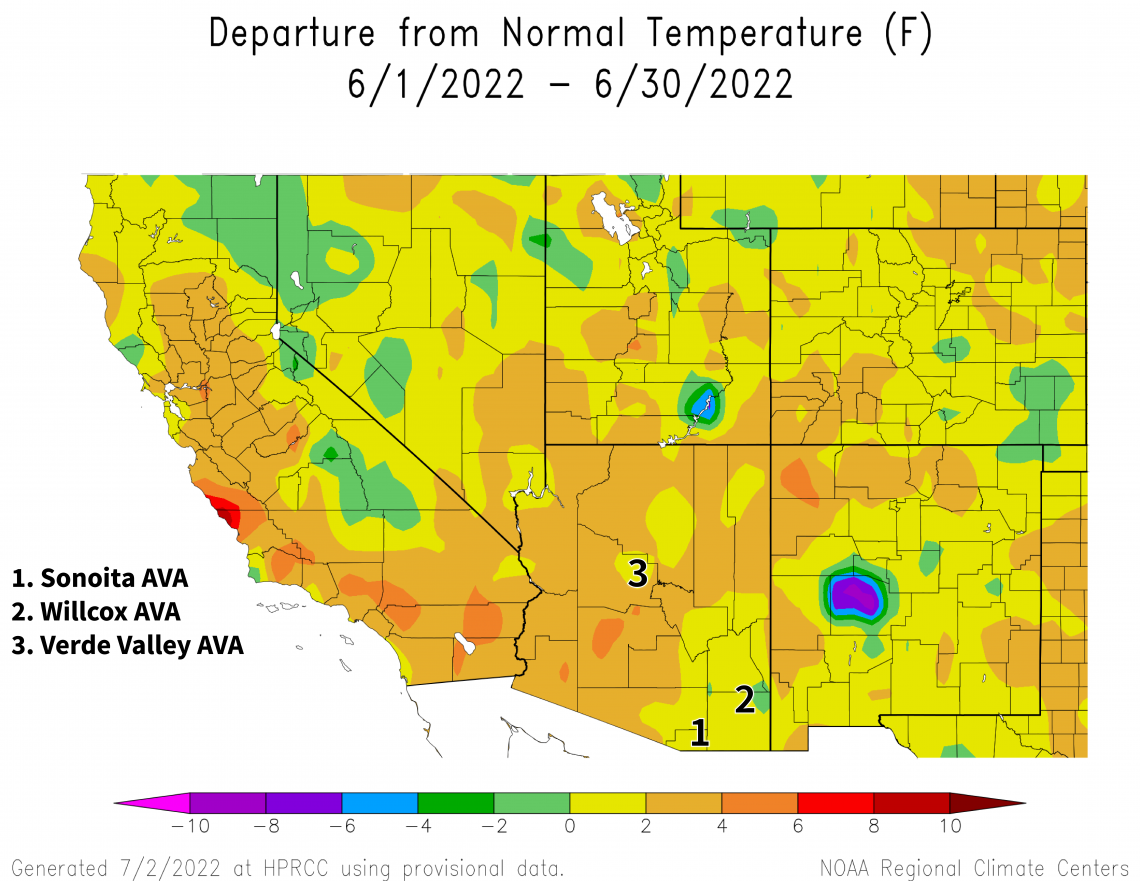
Monthly average temperatures were up to 2 °F warmer than the 1991-2020 normal for the southeastern corner and a few locations in the northern half of the state (yellow areas on map), including the three Arizona AVAs. Otherwise, temperatures were 2 to 4 °F above normal (light orange areas on map). For reference, monthly temperatures in June last year were 2 to 6 °F above normal for almost all of the state.
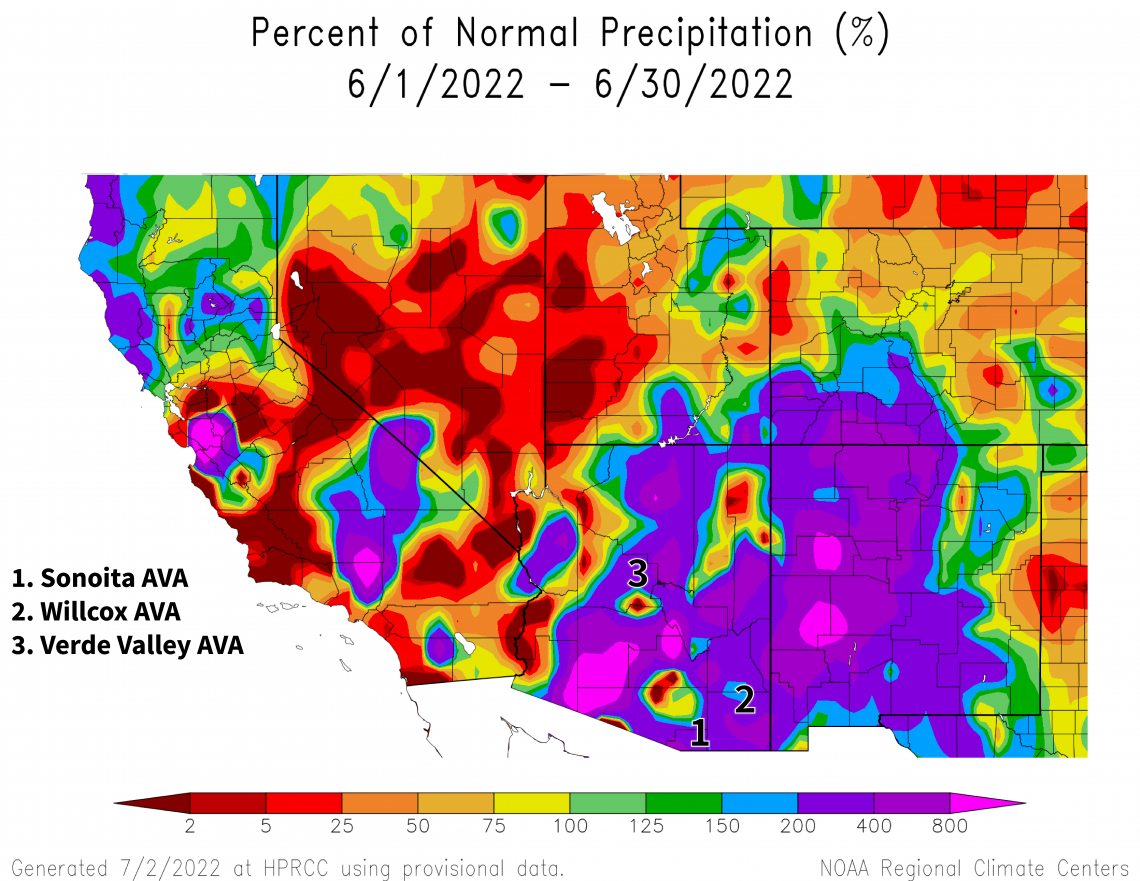
A relatively early start to the monsoon not only moderated temperatures last month, but also made for precipitation totals that were more than 200 % of the 1991-2020 normal for most of the state (dark purple, light purple, and magenta areas on map), including the three Arizona AVAs. Despite such eye-popping percentages, total amounts only topped out at 1.0 to 1.5 inches for many above-normal areas. June is, after all, a relatively dry month. In contrast, precipitation during June 2021 ranged from less than 50 % to more than 200 % of normal, with far fewer relatively wet locations.
Over the past few vintages, the typical pre-veraison climate problem has been vine stress due to heat waves, not greater pest pressure from atypical precipitation. Just how odd have temperature and precipitation been prior to the ripening season in 2022, compared to past years? We’ll take a couple looks at this issue below.
View more NOAA ACIS climate maps
View more-detailed regional maps and station summaries of monsoon rainfall
The Outlook for July Temperature and Precipitation
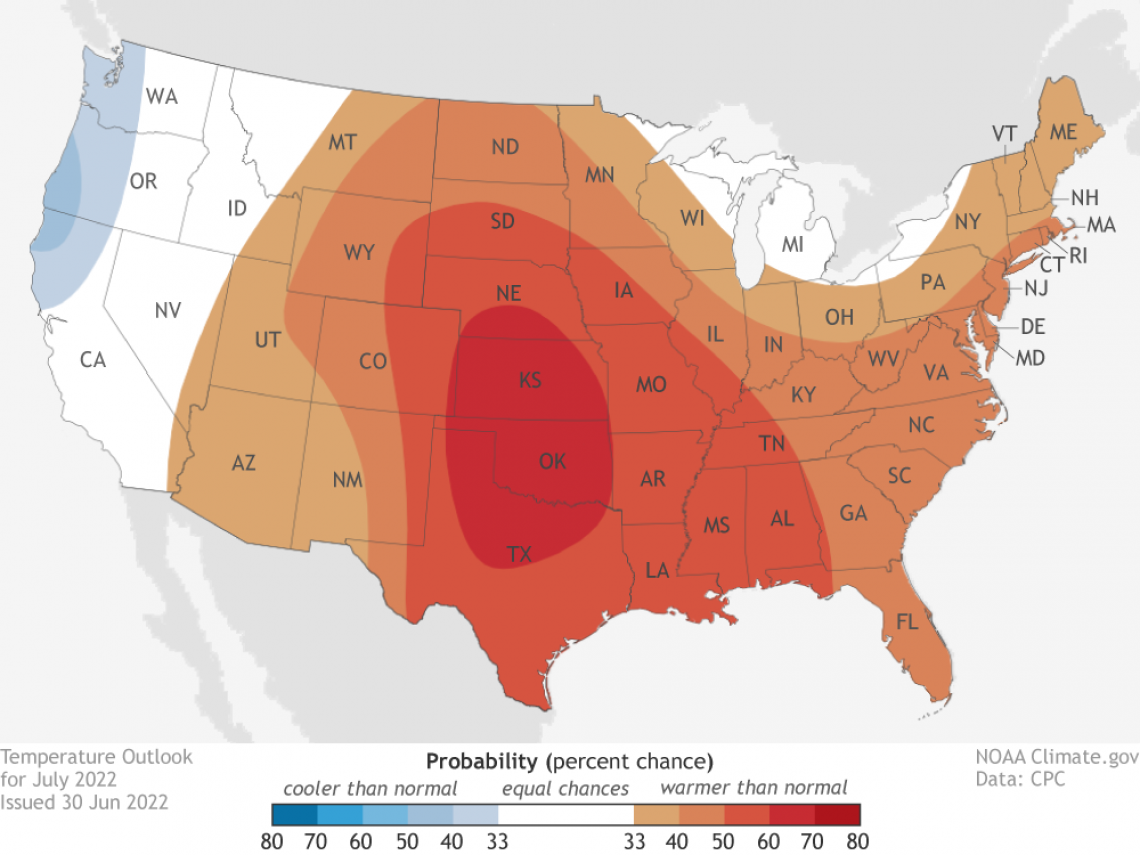
Temperatures over the course of this month have a slight increase in chances for being above the 1991-2020 normal across all of Arizona (light-orange area on map). For reference, monthly temperatures in July last year were within 2 °F of normal for Arizona, except for western and northern parts of the state where temperatures were 2 to 4 °F above normal.
2022-jul-temp-outlook-noaa-cpc.png
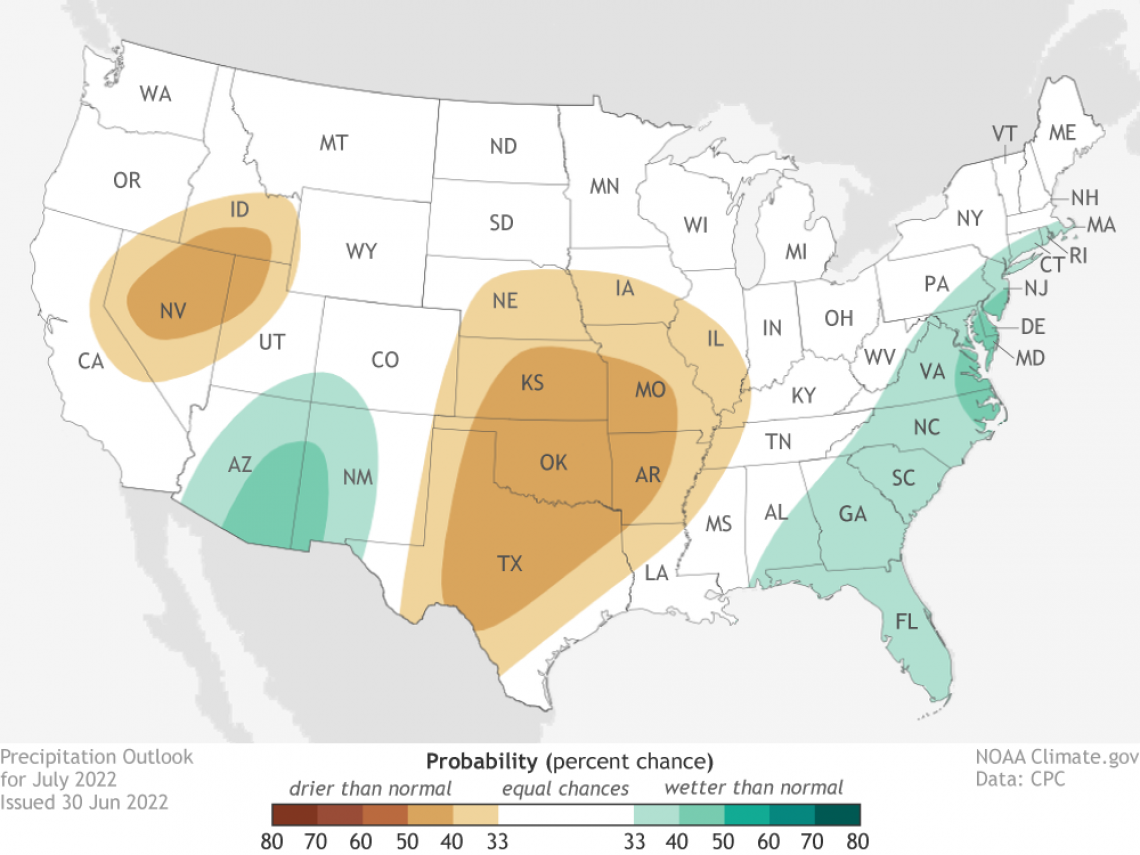
Precipitation totals for this month have a slight increase in chances for being above the 1991-2020 normal across Arizona (light-aqua and aqua areas on map), except for the extreme northwestern part of the state where there are equal chances for below-, near-, or above-normal totals (white area on map). Rainfall during July 2021 was more than 150 % of normal for almost all of Arizona.
With veraison perhaps just past at the warmest vineyards and for the earliest varieties, or soon approaching for many others, the interplay between temperature and precipitation over the coming weeks may have a say on fruit quality, particularly if warmer-than-normal temperatures appear through afternoon maximums or early morning minimums. Over the past several vintages, exposure of fruit to such conditions during July has taken a few different forms. We’ll be tracking hours per day in these key temperature ranges again this growing season with updates in upcoming issues.
Read more about the July 2022 temperature and precipitation outlook
To stay informed of long-range temperature and precipitation possibilities beyond the coverage of a standard weather forecast, check in, too, with the six-to-ten-day outlook and eight-to-fourteen-day outlook issued daily by NOAA’s Climate Prediction Center.
2022-jul-prcp-outlook-noaa-cpc.png
Seasonal Analogs for Arizona AVAs
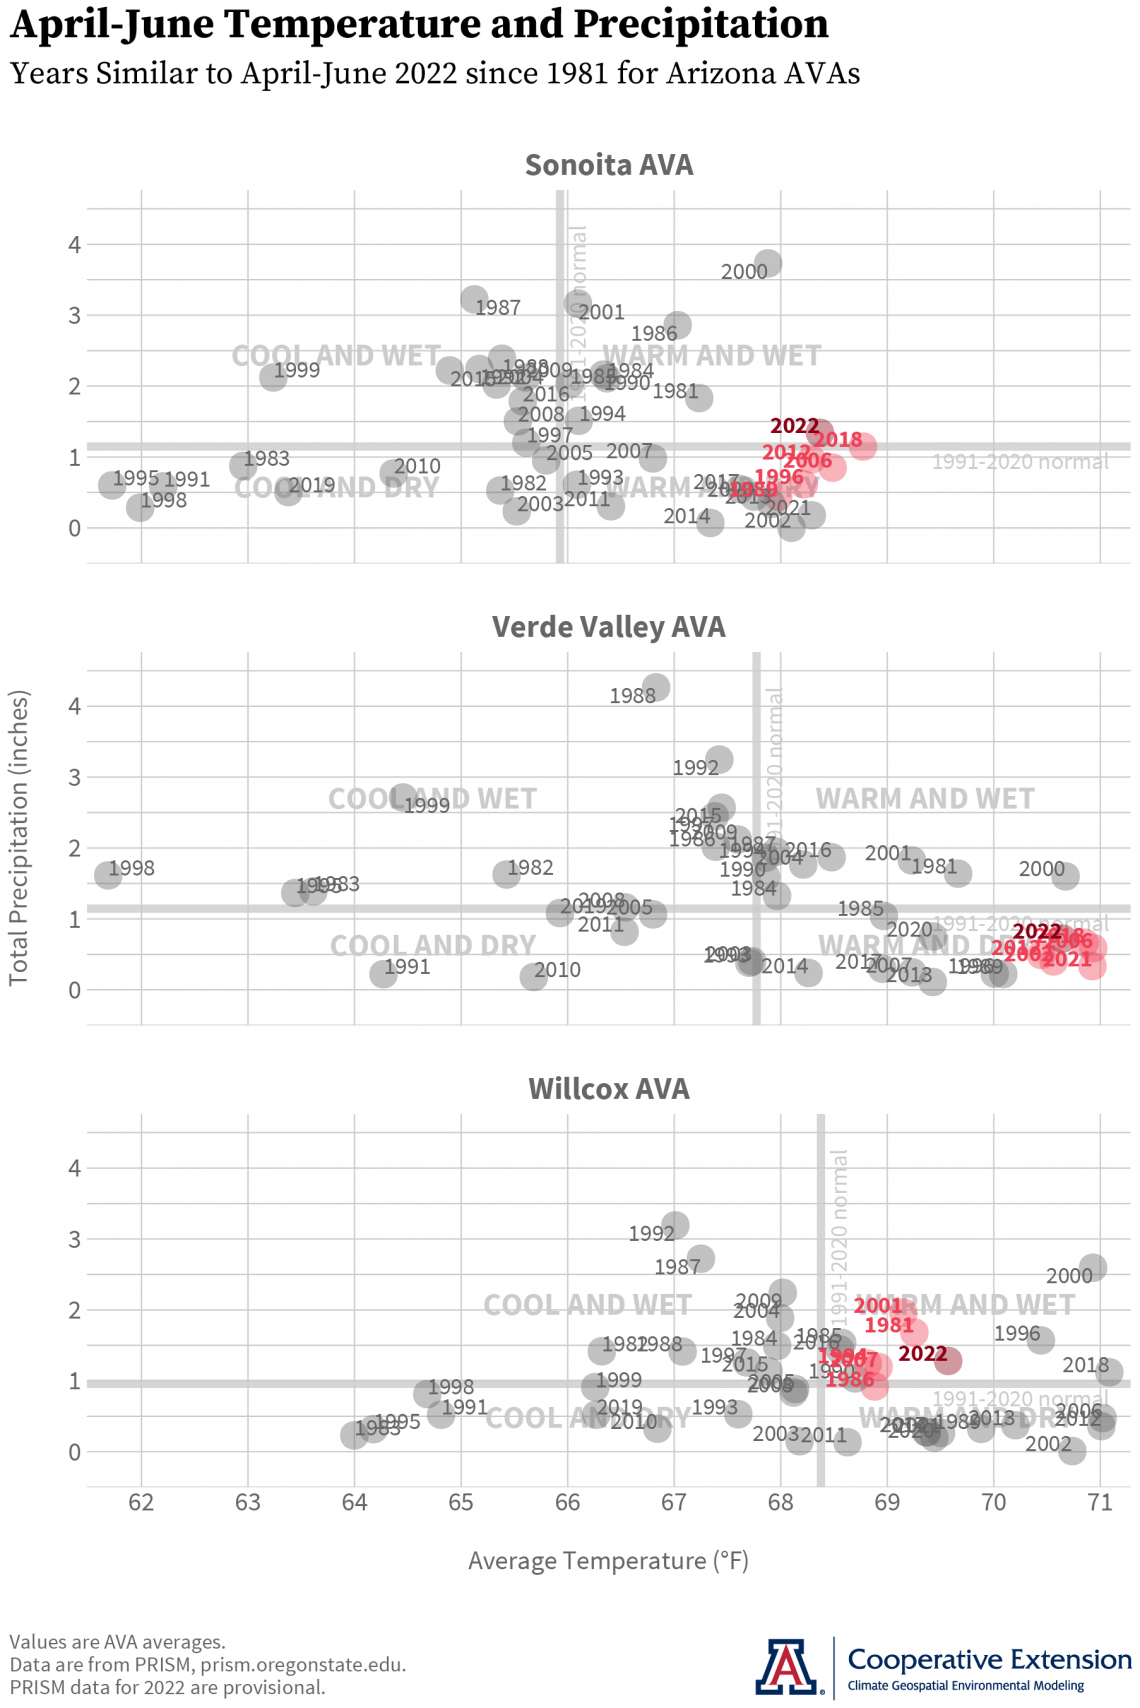
Even with above-normal rainfall last month, April-through-June precipitation totals ended up close to the 1991-2020 normals for the three Arizona AVAs (dark red dots near thick gray horizontal lines on graphs). Normal amounts are close to one inch for each of the areas. To note, one past and also relatively wet June happened in 2000. We suspect, however, that there were far fewer growers then that were able to lean on this experiential reference point over the past few weeks.
Near-normal precipitation, along with temperatures 1 to 3 °F above normal (dark red dots to the right of thick gray vertical lines on graphs), lead to the following analog years for the pre-veraison period during 2022 (light red dots on graphs).
2012, 2018, 2006, 1996, and 1989 for the Sonoita AVA
2018, 2012, 2006, 2002, and 2021 for the Verde Valley AVA
1981, 2007, 1994, 1986, and 2001 for the Willcox AVA
With this, we wouldn’t be surprised to hear if growers in the Verde Valley AVA made notes about the vineyard – general irrigation demands and vine growth rates – so far this year that are similar to those made last year. Nor would we be surprised to hear something similar from growers in the Sonoita and Willcox AVAs, where pre-veraison temperature and precipitation from 2021 are in the top ten of analog years.
What likely is different in vineyard notes at this point in 2022 is the lack of impacts from a June heat wave and the appearance of others from an early monsoon, topics addressed above.
Nonetheless, having notes from 2021 nearby as we head into the 2022 ripening season may be helpful. Among the shared aspects between these years are a relatively warm and dry dormant season, later bud break, analogous pre-veraison temperature and precipitation, and increased chances for July to be warmer and wetter than normal. Another feature to add to this list is pre-veraison heat accumulation, which we look at next.
cvn-202207-ava-analogs-2022-07-03.png
Heat Accumulation during the Growing Season
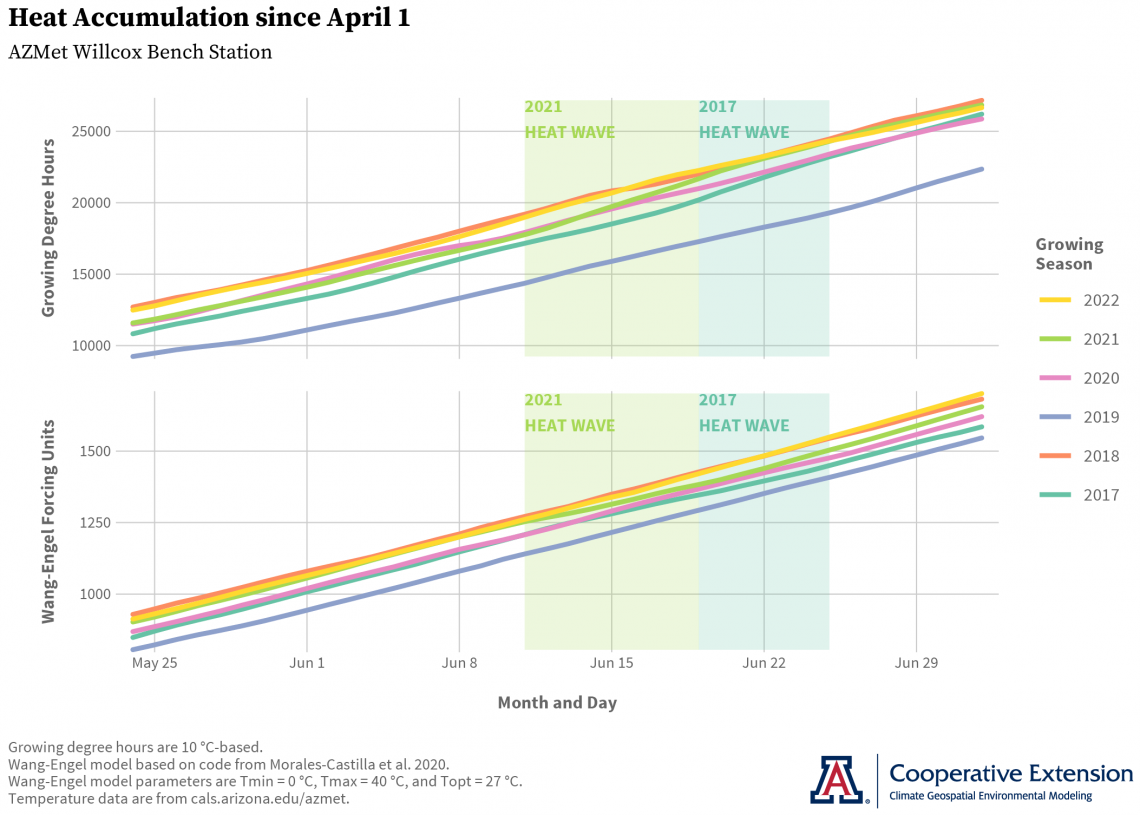
Heat accumulation from April through June this year (yellow lines on graph) is among the highest of the past several vintages. This suggests that vine growth rates and time between pre-veraison growth stages also may be among the fastest and shortest, respectively, since the 2017 growing season, at least near the AZMet Willcox Bench station in the Willcox AVA.
Like last month, we’re looking at two different heat-accumulation models. Growing degree hours (top graph), which does not account high temperatures above 95 °F (35 °C) and the corresponding slowdown or stoppage of vine photosynthesis and growth, and the Wang-Engel model (bottom graph), which does. In the case of the latter, the lack of a June heat wave this year likely contributed to relatively higher heat accumulation.
cvn-202207-heat-accumulation-2022-07-04.png
A rare La Niña three-peat this coming fall and winter remains possible, albeit with a bit less likelihood than a month ago. There now is a 52 % chance that still-current La Niña conditions will persist during the July-through-September period, and a 58-59 % chance that they continue through fall and into early winter 2022. This is the most recent official forecast for ENSO, or El Niño Southern Oscillation, parts of the atmosphere and ocean across the tropical Pacific Ocean that cause El Niño and La Niña events.
An early start to the monsoon may not have erased regional drought conditions, but it did ameliorate wildland fire conditions in the state. There is an normal potential this month for significant wildland fires for all of Arizona.
For those of you in southeastern Arizona, Cooperative Extension manages an email listserv in coordination with the Tucson forecast office of the National Weather Service to provide information in the days leading up to agriculturally important events, like heat waves and severe monsoon storms. Please contact us if you'd like to sign up.
And for those of you in north-central and northeastern Arizona, Cooperative Extension is starting to coordinate with the Flagstaff forecast office of the National Weather Service to soon provide a similar email listserv for those in agriculture in this part of the state. Please contact us if you'd like to sign up.
Undergraduate students in the College of Agriculture and Life Sciences at the University of Arizona are looking for internships with businesses and companies in the viticulture and winery industries during 2022. Please contact Danielle Buhrow, Senior Academic Advisor and Graduate Program Coordinator in the Department of Agricultural and Resource Economics, for more information.
Please feel free to give us feedback on this issue of the Climate Viticulture Newsletter, suggestions on what to include more or less often, and ideas for new topics.
Did someone forward you this newsletter? Please contact us to subscribe.
Have a wonderful July!
With current and past support from:

