
Climate Viticulture Newsletter - 2023 October
< Back to Climate Viticulture Newsletter
Hello, everyone!
This is the October 2023 issue of the Climate Viticulture Newsletter – a quick look at some timely climate topics relevant to wine grape growing in Arizona.
September Recap | October Outlook | Dew Point and Diurnal Temperature Range | Temperature Ranges and Ripening | Extra Notes
A Recap of September Temperature and Precipitation
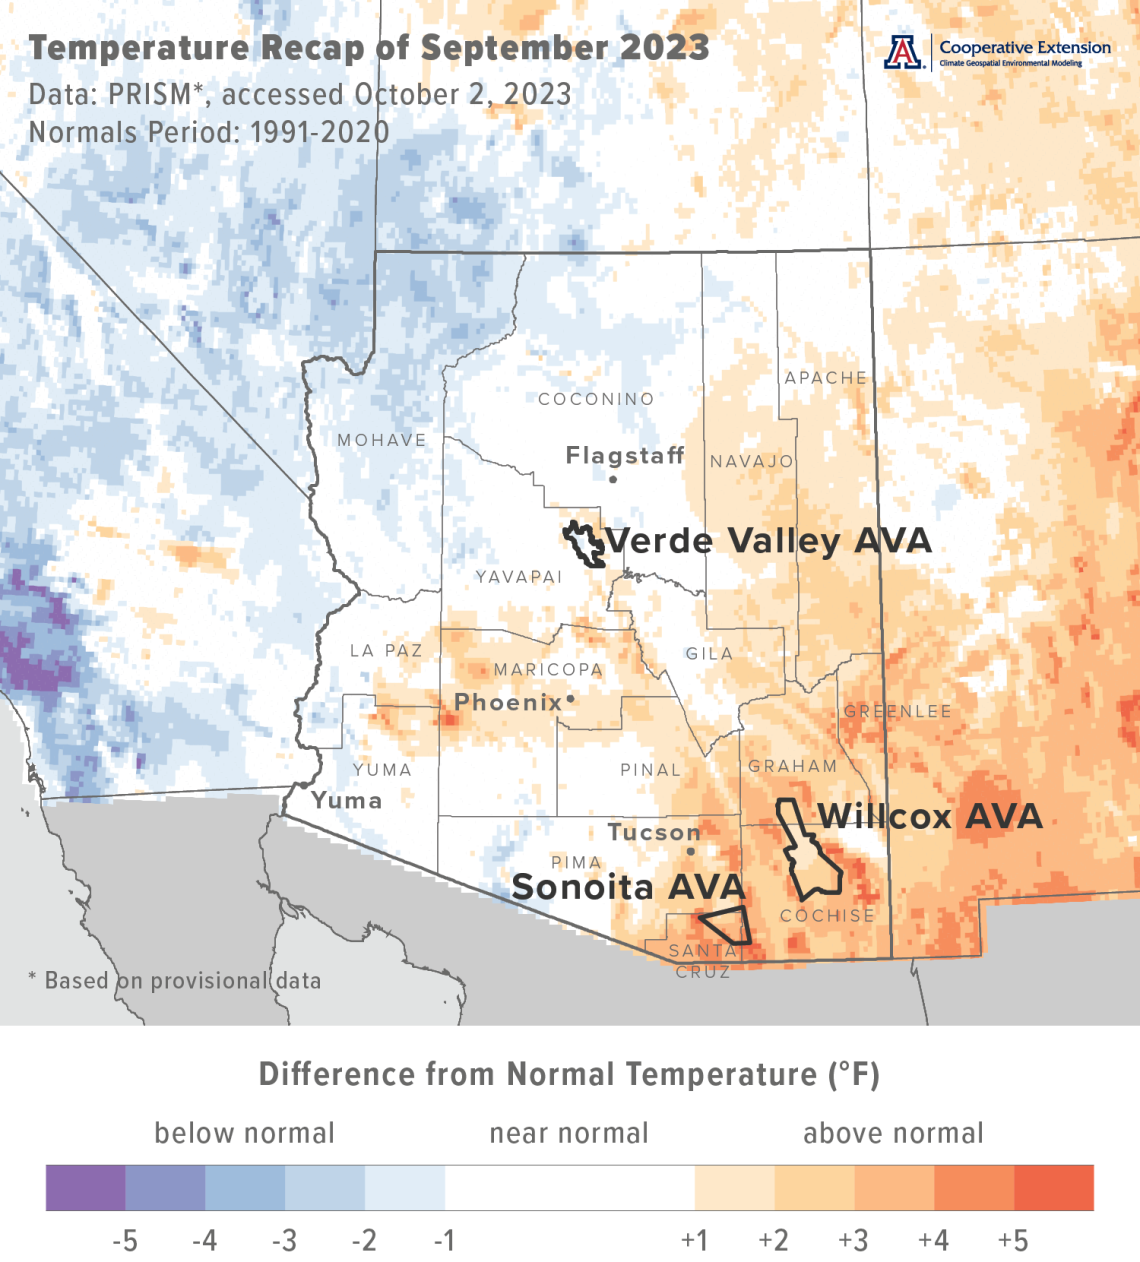
Monthly average temperatures were near the 1991-2020 normal for much of north-central and southwestern Arizona (white areas on map), including the Verde Valley AVA. Much of the northwestern part of the state measured temperatures 1 to 3 °F below normal (light blue and blue areas on map), whereas many locations in central, east-central, and southeastern Arizona, including the Sonoita and Willcox AVAs, measured temperatures 1 to 4 °F above normal (light orange and orange areas on map). For reference, monthly temperatures in September last year generally were within 2 °F of normal for much of the southern one-third of the state and 2 to 4 °F above normal for much of the northern two-thirds.
Area-average maximum and minimum temperatures during September 2023 were 88.8 and 59.2 °F for the Sonoita AVA, 90.2 and 58.0 °F for the Verde Valley AVA, and 92.1 and 58.8 °F for the Willcox AVA. Respective September normals are 83.9 and 57.0 °F, 90.4 and 58.4 °F, and 87.8 and 58.3 °F.
cvn-recap-202310-tmeanDepartureNormal.png
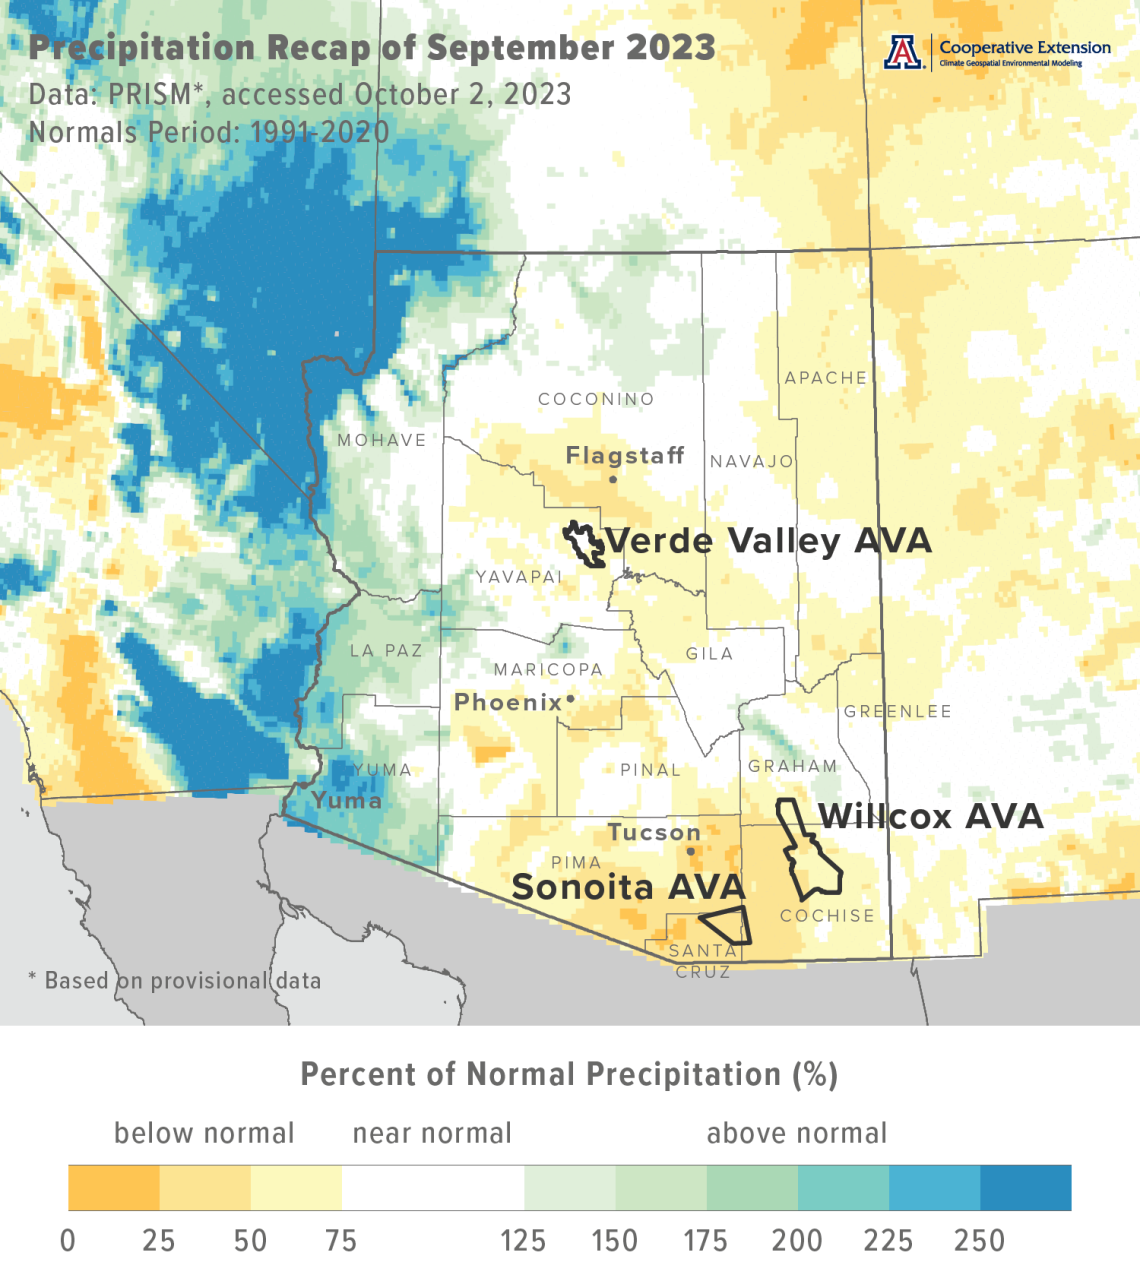
Monthly precipitation totals were more than 150 % of normal for much of the extreme western part of state (aqua and blue areas on map). Elsewhere in Arizona, it was a mix of areas with near-normal totals (white areas on map), including most of the Verde Valley AVA, and totals between 25 and 75 % of normal (light yellow and yellow areas on map), including the Sonoita and Willcox AVAs. Precipitation during September 2022 varied widely across the state, with amounts generally ranging from near to 150 % of normal.
Area-average total precipitation in September 2023 was 0.60 inches for the Sonoita AVA, 1.14 inches for the Verde Valley AVA, and 0.78 inches for the Willcox AVA. Respective September normals are 1.95, 1.53, and 1.40 inches.
Relatively warm and dry conditions last month drove total reference evapotranspiration values for September to 5.8 and 6.3 inches for the AZMet Bonita and Willcox Bench stations, respectively, in the Willcox AVA. Those values bring respective growing season totals to 44.2 and 47.1 inches. Total precipitation from April through September, in contrast, is 0.95 at Bonita and 1.62 inches at Willcox Bench.
Dig into daily weather summaries from 2023 for the AZMet Bonita and Willcox Bench stations in the Willcox AVA
Learn more about PRISM climate data
cvn-recap-202310-pptPercentNormal.png
The Outlook for October Temperature and Precipitation
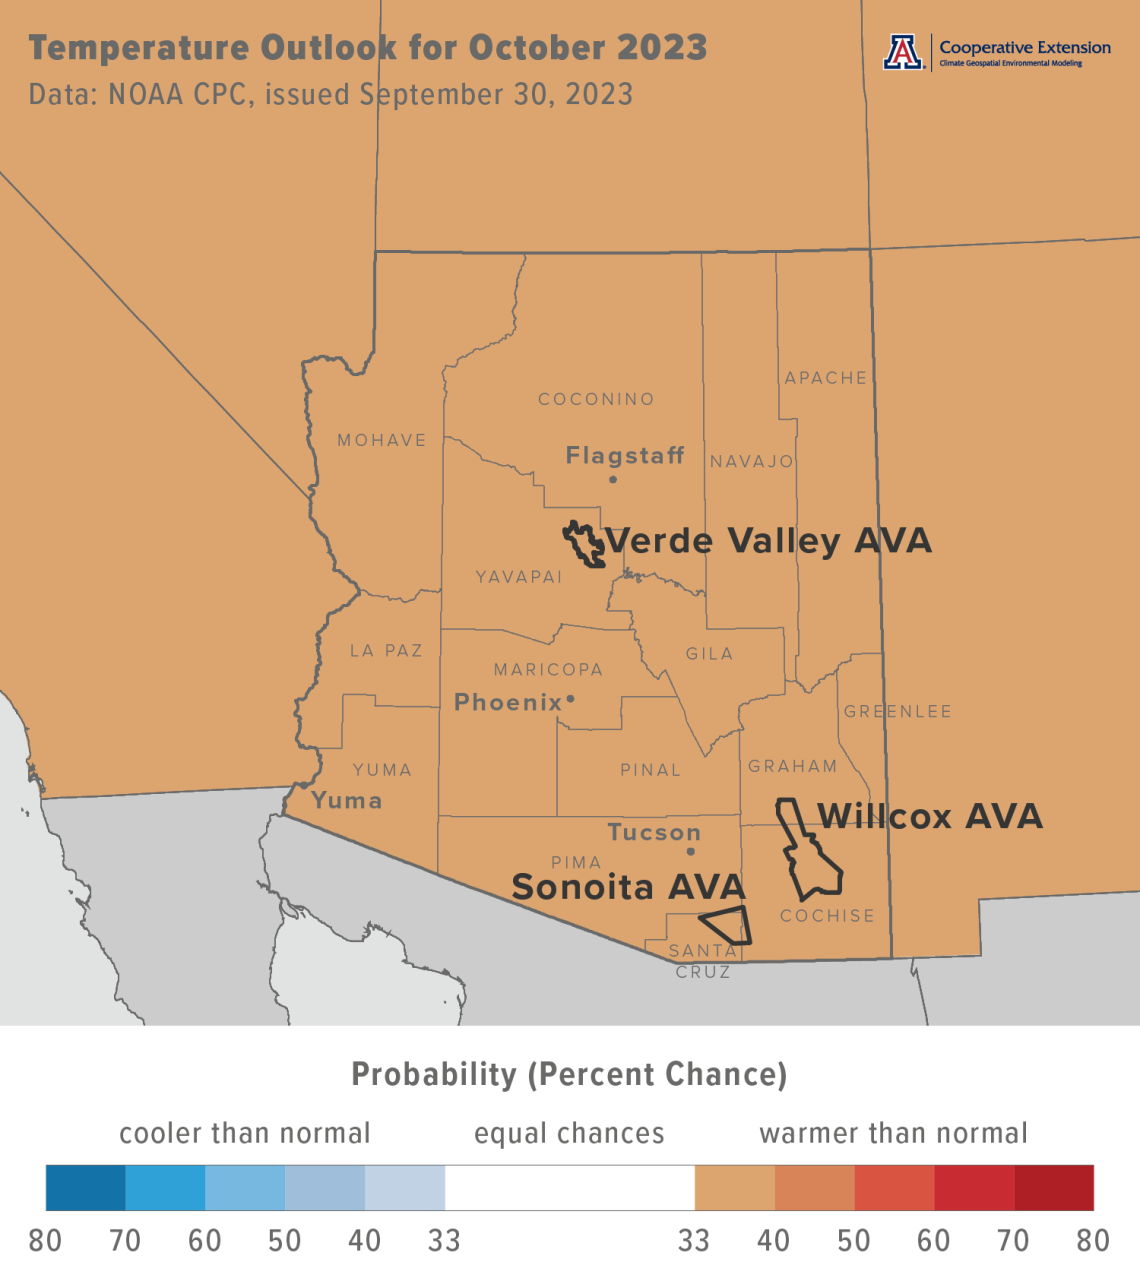
Temperatures over the course of this month have a slight increase in chances for being above the 1991-2020 normal across all of Arizona (light orange area on map). Monthly temperatures in October last year were 1 to 4 °F below normal for much of the southeastern and east-central parts of Arizona, and near normal for much of the rest of the state.
Area-average maximum and minimum temperatures during October 2022 were 72.7 and 46.2 °F for the Sonoita AVA, 79.1 and 47.2 °F for the Verde Valley AVA, and 74.5 and 45.6 °F for the Willcox AVA. Respective October normals are 77.3 and 47.5 °F, 80.2 and 47.0 °F, and 79.9 and 46.8 °F.
cvn-outlook-202310-temp.png
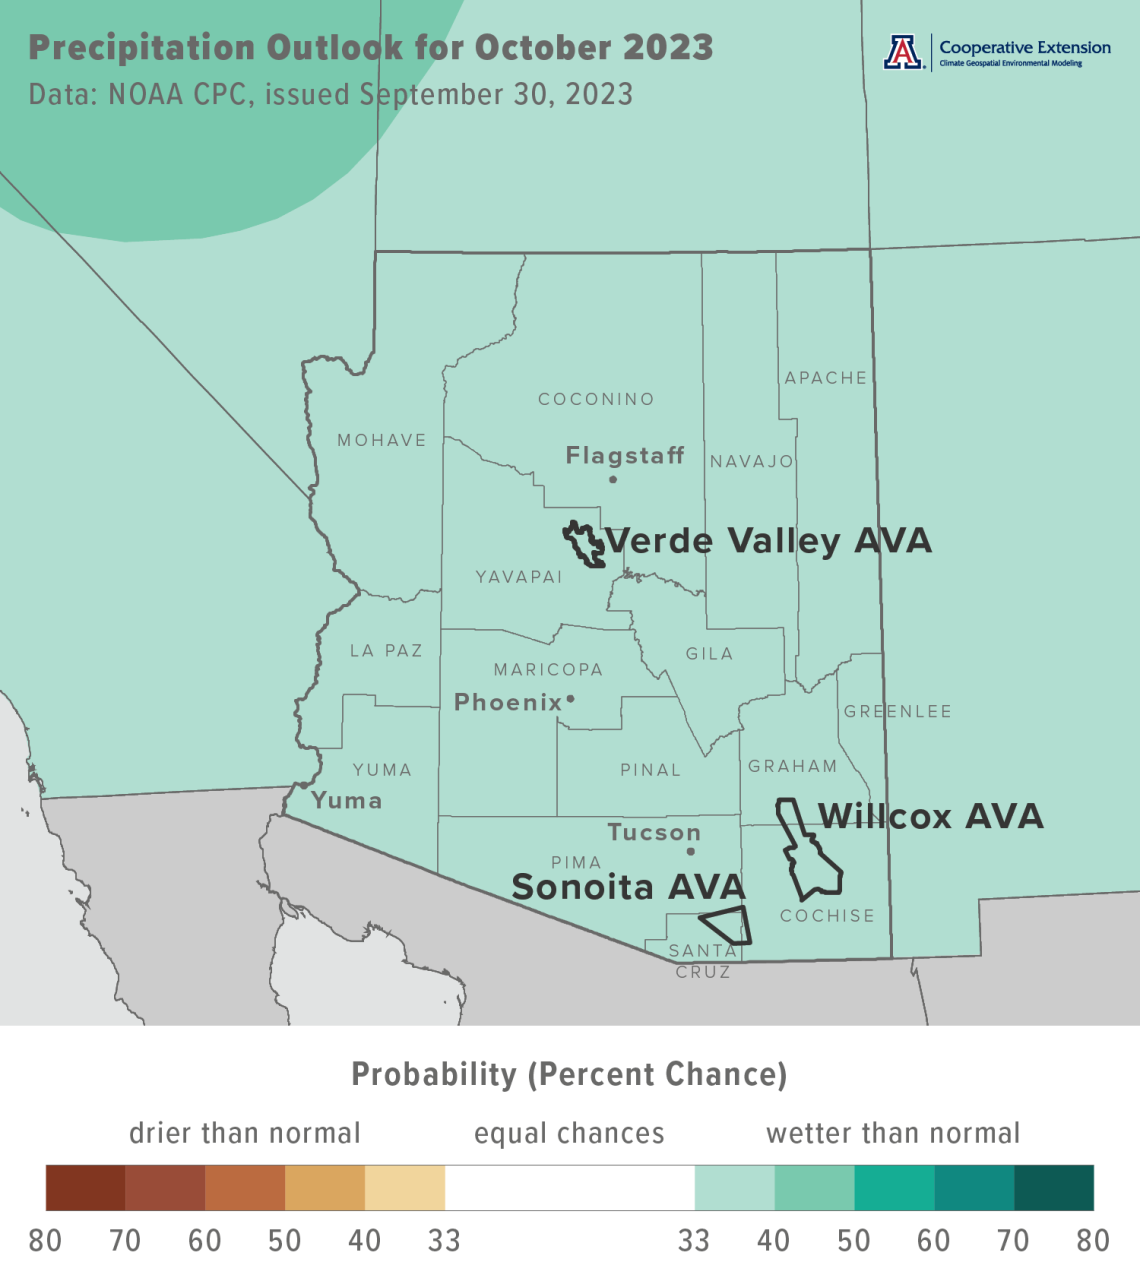
Precipitation totals for this month have a slight increase in chances for being above normal across all of Arizona (light aqua area on map). Precipitation during October 2022 was more than 125 % of normal for many parts of the state, with only locations in south-central and extreme northwestern Arizona recording below-normal amounts.
Area-average precipitation totals in October 2022 were 1.86 inches for the Sonoita AVA, 1.90 inches for the Verde Valley AVA, and 1.47 inches for the Willcox AVA. Respective October normals are 0.95, 1.05, and 0.76 inches.
To stay informed of long-range temperature and precipitation possibilities beyond the coverage of a standard weather forecast, check in, too, with the six-to-ten-day outlook and eight-to-fourteen-day outlook issued daily by NOAA’s Climate Prediction Center.
cvn-outlook-202310-prcp.png
Dew Point and Diurnal Temperature Range
With the monsoon comes a number of changes in growing conditions from June through September, and these changes often coincide with ripening and harvest. We’ve looked at this in a number of newsletter issues over the past few growing seasons, noting the effects of temperature or, more recently, precipitation on fruit quality and composition. Here, we take a different tack and compare the increase in humidity at this time of year and coincident temperatures to unpack what the monsoon does to diurnal temperature range.
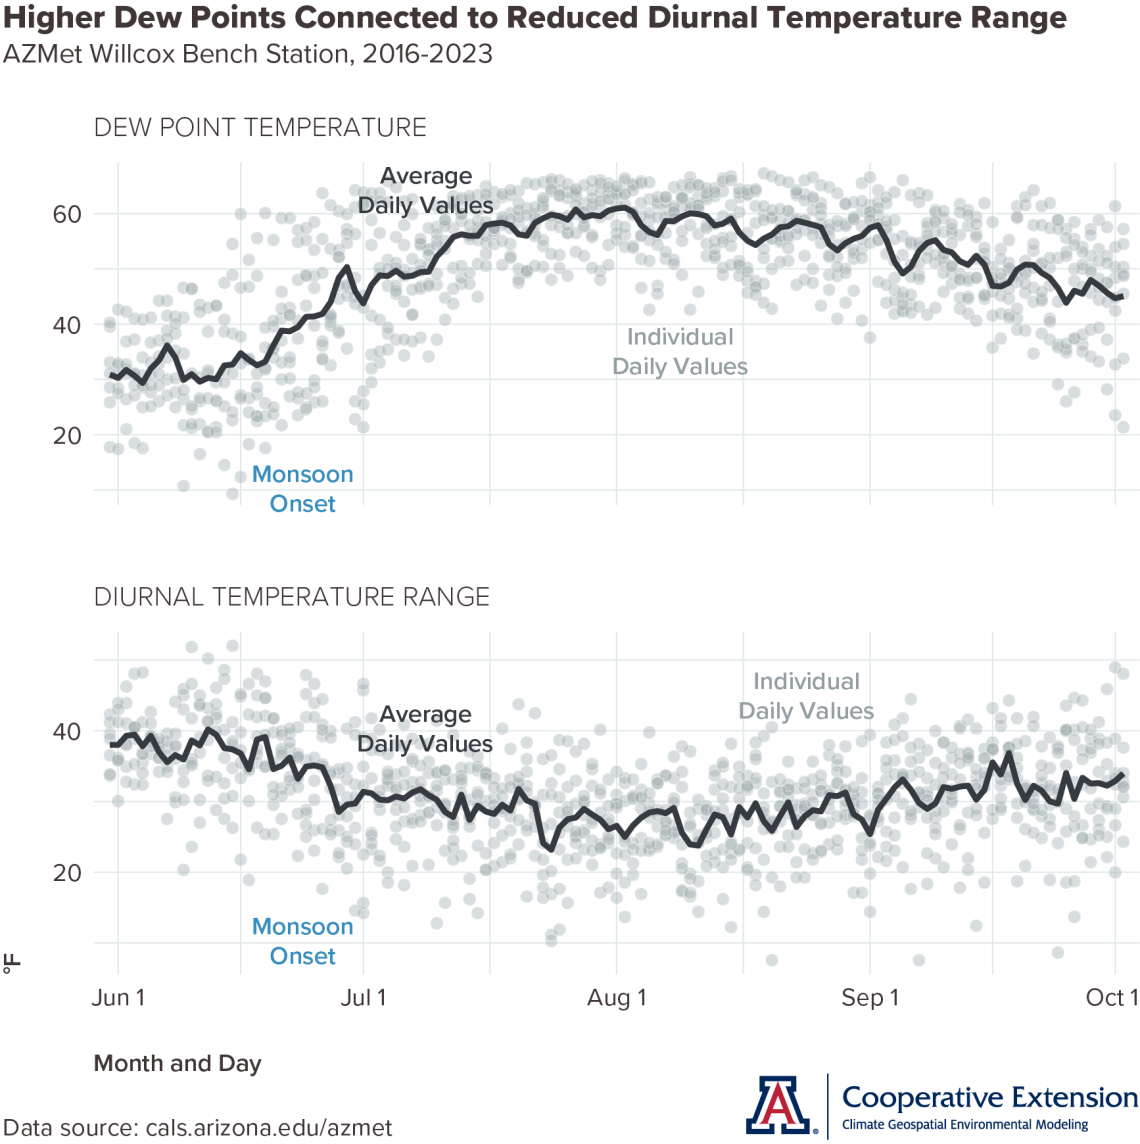
As we all have experienced at some point in late June or early July, a precursor of summer storms arrives in the form of higher humidity. This is evident in dew point temperature data from the AZMet Willcox Bench station in the Willcox AVA (top chart in figure). Average values for a given month and day (dark gray line in top chart) hover near 30 °F for the first part of June. After this, average dew points increase until mid-July, when they level off near 60 °F until mid-August. Average dew points then decline through September, to near 45 °F by the end of that month. Over this four-month period, dew point temperatures for individual days (semi-transparent gray points in top chart) range from near 10 °F in early June to near 70 °F during July and August. Station records begin on June 18, 2016, and we include all available data here.
Average daily values of diurnal temperature range, the difference between maximum and minimum temperatures on a given day, hover between 35 and 40 °F for the first part of June (dark gray line in bottom chart). After this, average diurnal temperature range decreases until mid-July, when it levels off between 25 and 30 °F until late August. It then increases through September, to near 35 °F by the end of that month. Over this four-month period, diurnal temperature range for individual days (semi-transparent gray points in bottom chart) ranges from near 50 °F in mid-June to near 10 °F from late July through September.
Of course, the connection between dew point and diurnal temperature range is not surprising. Higher atmospheric moisture, often accompanied by clouds at this time of the growing season, lowers daily maximum temperatures. This condition also keeps daily minimum temperatures higher, as less heat radiates away from the surface and into the upper levels of the atmosphere during the night. Lower maximum and higher minimum temperatures make for a lower diurnal temperature range.
Let’s bring this back to the vineyard. How might higher humidity and lower diurnal temperature range during ripening and harvest affect fruit quality and composition? We look at one possible answer to this in the next section.
cvn-202310-DPTmean-DTR.png
Temperature Ranges and the Ripening Period
Like many other questions, one answer to how higher humidity and lower diurnal temperature range during ripening and harvest affect fruit quality and composition is ‘it depends’. In this case, it depends on how the maximum and minimum temperatures that determine diurnal temperature range relate to temperature thresholds important to vine and fruit physiology and metabolism. As in previous newsletter issues, we focus here on 95 and 65 °F for maximum and minimum temperatures, respectively. The former, for example, relates to the upper temperature limit of photosynthesis as well as effects such as anthocyanin degradation, and the latter to respiration of malic acid and declines in fruit acidity.
We also again focus here on frequency, how often maximum and minimum temperatures respectively are above these thresholds. What’s new is that we present frequency as a count of how often these conditions occur for a given month and day over the course of the eight-year record from the AZMet Willcox Bench station in the Willcox AVA. Although a longer record would be better when it comes to statistics, patterns of how these conditions vary during the June-through-September period already may be apparent.
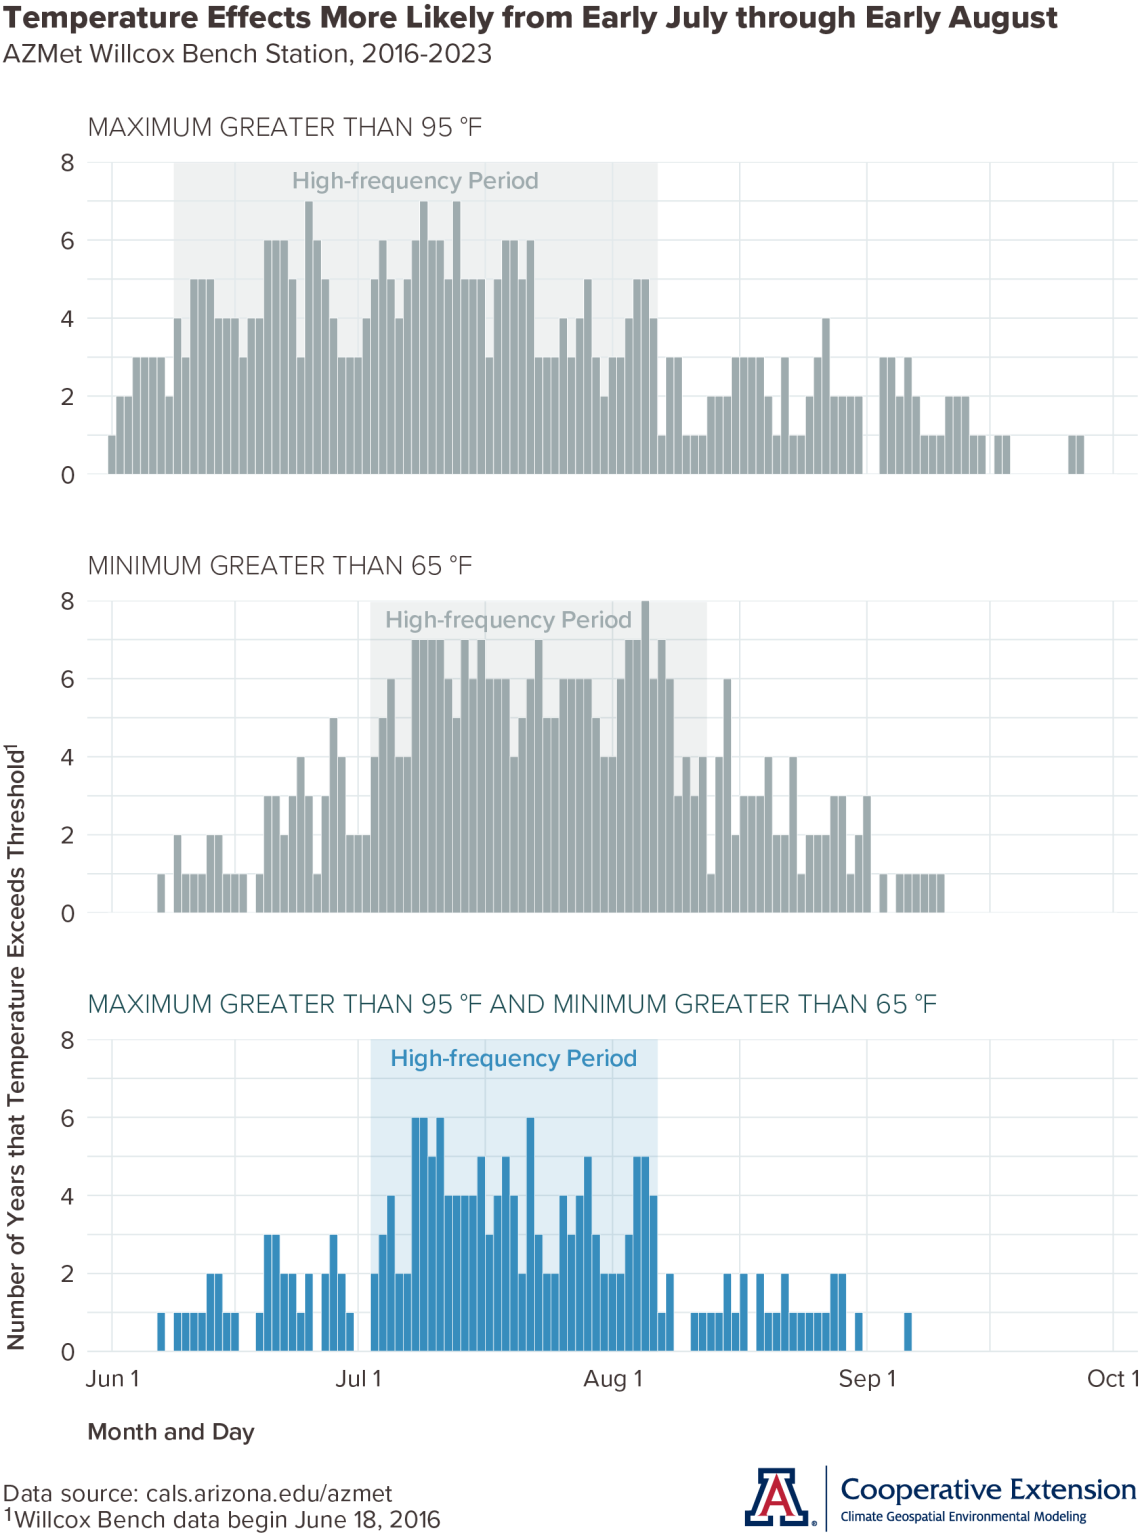
Daily maximum temperatures greater than 95 °F occur from early June through late September, and most often from mid-June through early August (gray bars in top chart). During this period of relatively higher frequency, measurements of maximum temperatures above 95 °F happen between two and seven years out of eight, or roughly between one quarter and nearly all the time. Prior to and after this high-frequency period, this condition occurs between zero and four years out of eight.
Daily minimum temperatures greater than 65 °F occur from mid-June through mid-September, and most often from early July through mid-August (gray bars in middle chart). During this period of relatively higher frequency, measurements of minimum temperatures above 65 °F happen between three and eight years out of eight, or roughly between half and all the time. Prior to and after this high-frequency period, this condition occurs between zero and five years out of eight. We’re certain that you already have connected this information to that about dew point temperatures in the previous section.
Combining both thresholds, daily maximum temperatures greater than 95 °F and minimum temperatures greater than 65 °F occur from mid-June through early September, and most often from early July through early August (blue bars in bottom chart). During this period of relatively higher frequency, measurements of maximum and minimum temperatures above 95 and 65 °F, respectively, happen between two and six years out of eight, or roughly between one quarter and three quarters of the time. Prior to and after this high-frequency period, this condition occurs between zero and four years out of eight.
In addition to how frequency of the individual conditions vary from June through September and despite a relatively short station record, a couple things catch our eye. One is that the high-frequency periods for maximum temperatures greater than 95 °F and minimum temperatures greater than 65 °F do not quite line up. The former looks to start a few weeks earlier than the latter, while both end close to the same time. The other is that the time when there is overlap between these two high-frequency periods (high-frequency period for blue bars in bottom chart) may represent one of the most challenging parts of the ripening and harvest season, as effects of temperature on vine and fruit physiology and metabolism appear to be more likely.
Finally, what are the implications from this analysis for monsoon hedging? For us, they include how varieties, whether early maturing or late, and wine styles, like sparkling or dry, line up with the high-frequency periods of the different conditions presented here. Are the grapes in question heat tolerant if they ripen when maximum temperatures above 95 °F are more likely? Can they maintain acidity if they ripen when minimum temperatures above 65 °F are more likely? Characteristics like these are just a few that might help when evaluating varieties for Arizona vineyards.
cvn-202310-temperature-ranges-and-ripening.png
Extra Notes
The current El Niño event has a greater than 95 % chance to continue through the January through March timeframe, when its influence on regional temperature and precipitation is potentially at its greatest. Furthermore, the odds that it becomes a “strong” event now are 71 %. Despite that possible categorization, please keep in mind that chances of any related anomalies in our winter weather often are lower than chances of the event itself. Before we get to winter, however, the current El Niño event can lead to conditions during autumn that favor above-normal hurricane activity in the eastern Pacific Ocean. As we saw in August, tropical cyclones that form to our south can lead to rain in the Southwest.
Please save December 6, 2023 for the Winter Viticulture Symposium presented by Cooperative Extension at the University of Arizona Controlled Environment Agriculture Center in Tucson. There will be presentations and discussions about vineyard irrigation, soil and soil fertility, entomology, pathology, weather and climate, and small-business development, a workshop-style review of the 2023 growing season, as well as lunch sponsored by the Arizona Wine Growers Association. Please contact Matt Halldorson with any questions.
The Arizona Pest Management Center with University of Arizona Cooperative Extension recently posted a brief summary on the western grapeleaf skeletonizer, including information on its description and identification, life stages, host plants, damage to grapevines, and management.
The Arizona Water Map Poster by the Water Resources Research Center at the University of Arizona is available both in print and as a PDF download. It provides a concise visual representation of Arizona’s water resources. In addition to the main map, there are multiple inset images around the edges of the poster displaying several different kinds of visual data to provide additional information and context. These include Arizona’s average annual water use, Colorado River apportionments, water use by groundwater basin, land ownership, annual precipitation by planning area, subsidence and storage, and water system connections. The land ownership inset, for example, is useful for illustrating how little Arizona land is privately held. The water map insets are now available on the WRRC website as PNG files for individual download and use.
For those of you in southeastern Arizona, including the Sonoita and Willcox AVAs, Cooperative Extension manages an email listserv in coordination with the Tucson forecast office of the National Weather Service to provide information in the days leading up to agriculturally important events, like heavy rainfall from tropical cyclone remnants and early fall freezes. Please contact us if you'd like to sign up.
And for those of you in north-central and northeastern Arizona, including the Verde Valley AVA, Cooperative Extension also now manages an email listserv in coordination with the Flagstaff forecast office of the National Weather Service to provide similar information for this part of the state. Please contact us if you'd like to sign up.
Undergraduate students in the College of Agriculture and Life Sciences at the University of Arizona are looking for internships with businesses and companies in the viticulture and winery industries. Please contact Danielle Buhrow, Senior Academic Advisor and Graduate Program Coordinator in the Department of Agricultural and Resource Economics, for more information.
Please feel free to give us feedback on this issue of the Climate Viticulture Newsletter, suggestions on what to include more or less often, and ideas for new topics.
Did someone forward you this newsletter? Please contact us to subscribe.
Have a wonderful October!
With current and past support from:

