
Climate Viticulture Newsletter - 2022 October
< Back to Climate Viticulture Newsletter
Hello, everyone!
This is the October 2022 issue of the Climate Viticulture Newsletter – a quick look at some timely climate topics relevant to wine grape growing in Arizona.
September Recap | October Outlook | AVA Seasonal Analogs | Temperature Ranges and Ripening | Extra Notes
A Recap of September Temperature and Precipitation
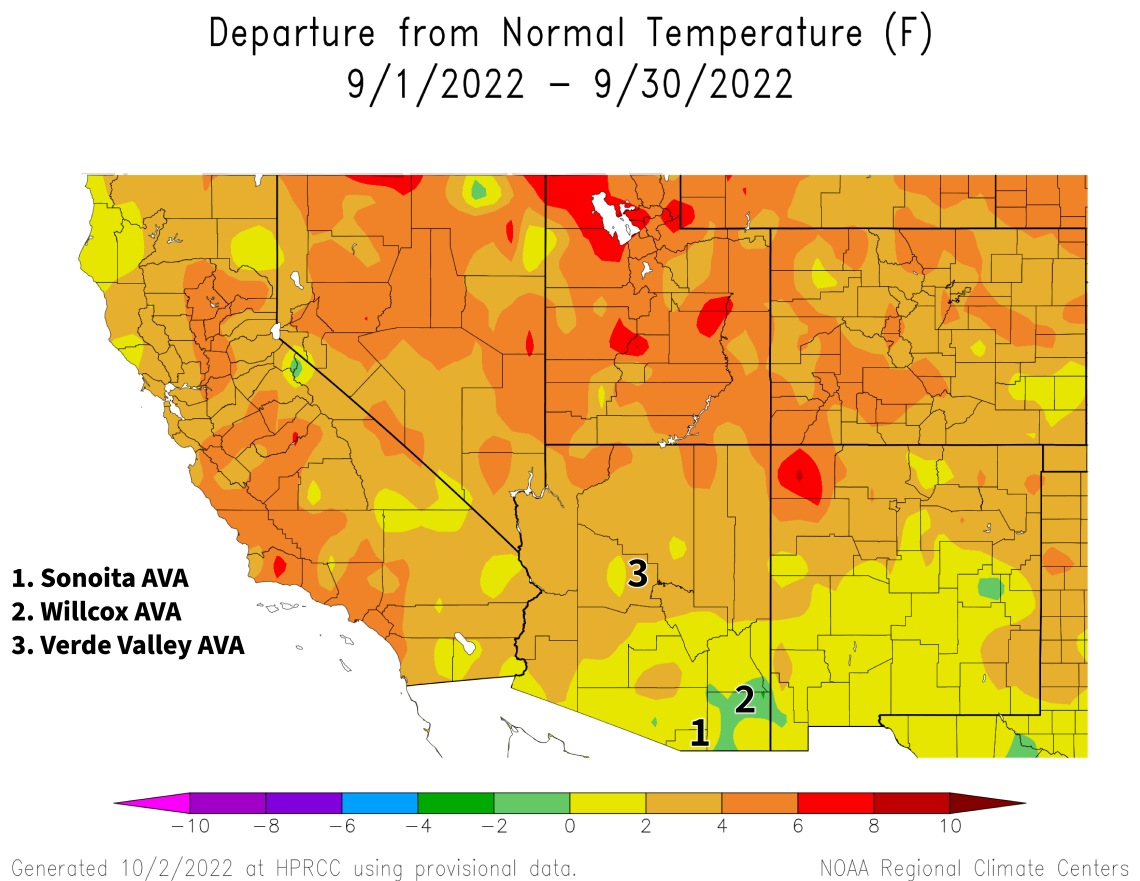
Monthly average temperatures were within 2 °F of the 1991-2020 normal for much of the southern third of the state (yellow and light green areas on map), including the Sonoita and Willcox AVAs. For much of the northern two-thirds, including the Verde Valley AVA, temperatures were 2 to 4 °F above normal (light orange area on map). This is similar to September last year, when monthly temperatures were within 2 °F of normal for the southern two-thirds of the state, and 2 to 4 °F above normal for the northern third.
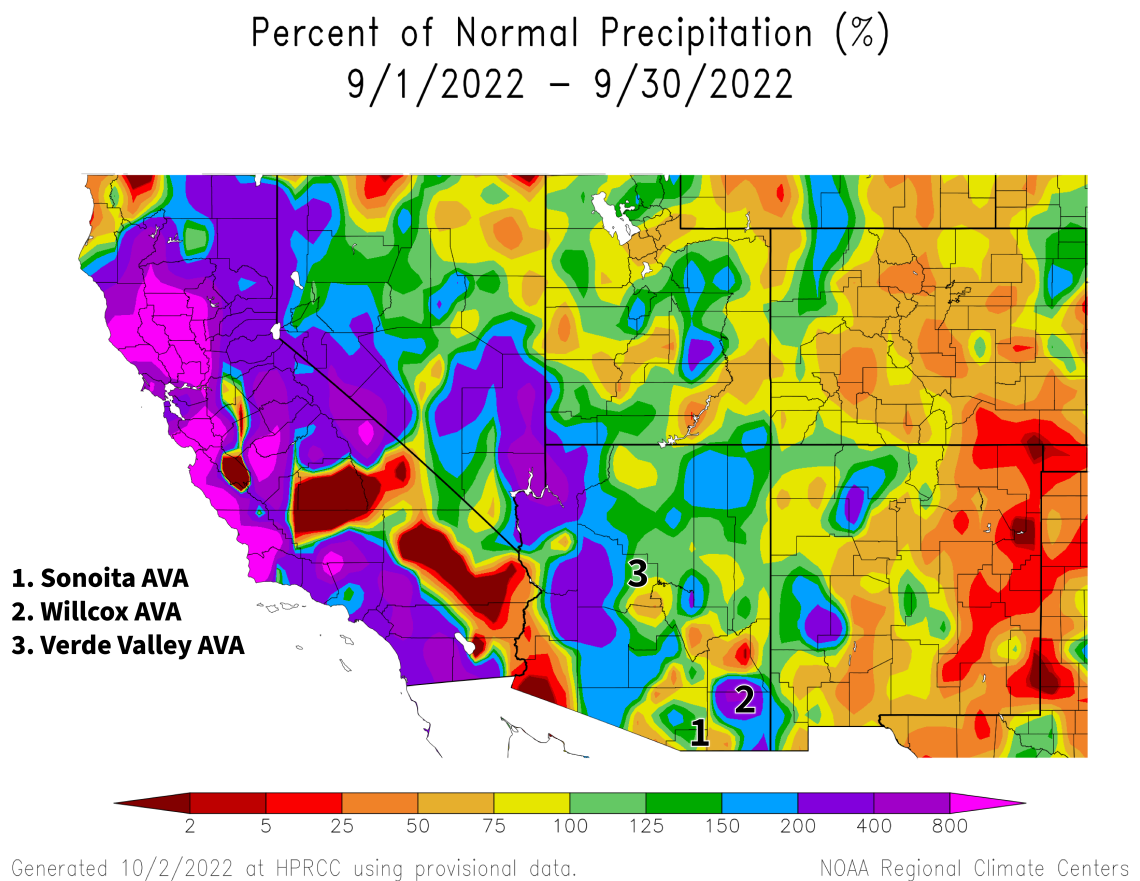
As is often typical with the monsoon, monthly precipitation totals last month varied widely across the state with some locations below normal (orange and red areas on map), some near normal (yellow and light green areas on map), and others above normal (dark green, blue, and purple areas on map). Generally, amounts for the Sonoita AVA were near 150 % of the 1991-2020 normal, above 150 % of normal for the Willcox AVA, and near normal for the Verde Valley AVA. This translates to totals between one and three inches for these areas. Precipitation during September 2021 generally was near normal for much of Arizona. There were, however, a few locations like the northern half of the Willcox AVA where totals were above 150 % of normal with amounts close to 2 inches.
Although rain during the ripening and harvest season is not rare for Arizona wine grape growers, packing both precipitation and record-high temperatures into this part of the growing season might be. Here’s an account of what such conditions recently led to for a vineyard in Paso Robles, California.
View more NOAA ACIS climate maps
View more-detailed regional maps and station summaries of monsoon rainfall
The Outlook for October Temperature and Precipitation
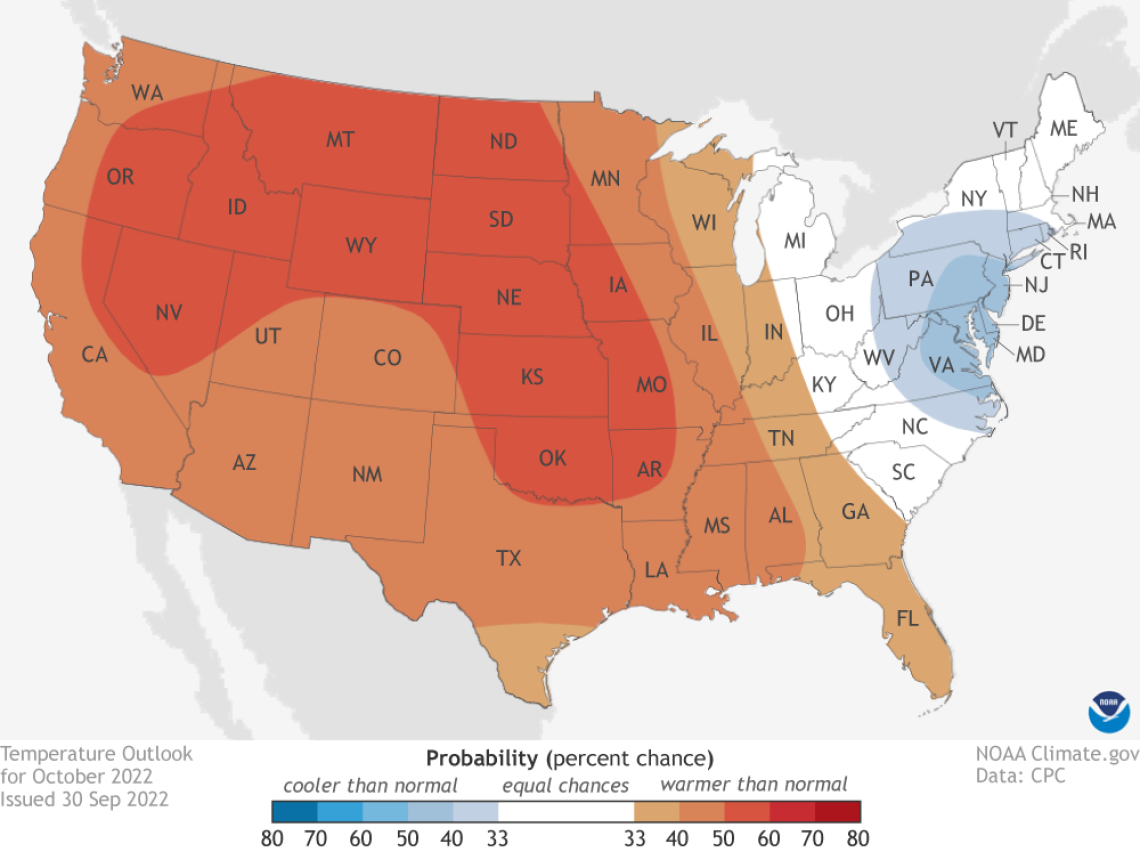
Temperatures over the course of this month have a slight increase in chances for being above the 1991-2020 normal across all of Arizona (orange area on map). For reference, monthly temperatures in October last year generally were within 2 °F of normal for the eastern third of the state and 2 to 4 °F below normal for the western two-thirds.
2022-oct-temp-outlook-noaa-cpc.png
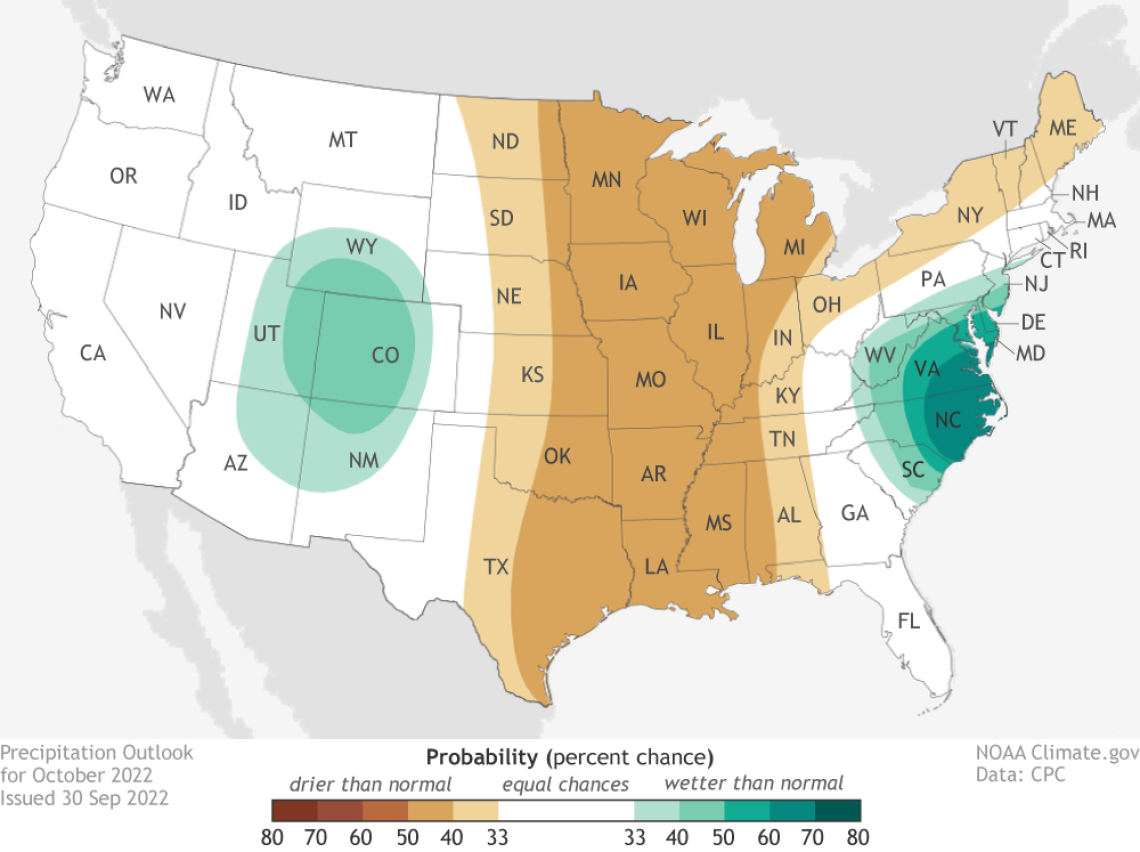
Precipitation totals for this month have a slight increase in chances for being above the 1991-2020 normal across the northwestern part of Arizona (light aqua area on map). Otherwise, there are equal chances for below-, near-, or above-normal amounts for the state (white area on map). Precipitation during October 2021 generally was less than 75 % of normal for much of the southern half of the state and near to more than 150 % of normal for much of the northern half.
Now that it is October, we would expect the first fall freeze to happen by the end of this month for relatively cooler growing areas in the state. Dates of the first fall freeze do not typically occur until the first half of November for relatively warmer growing areas, although cold spots with dates in the second half of October do appear in places like the Sonoita, Willcox, and Verde Valley AVAs due to the influence of topography. For vineyards that saw a relatively late start and harvest date this growing season, a relatively late first fall freeze would allow vines some extra time to photosynthesize and store more resources for growth next year.
Read more about the October 2022 temperature and precipitation outlook
To stay informed of long-range temperature and precipitation possibilities beyond the coverage of a standard weather forecast, check in, too, with the six-to-ten-day outlook and eight-to-fourteen-day outlook issued daily by NOAA’s Climate Prediction Center.
2022-oct-prcp-outlook-noaa-cpc.png
Seasonal Analogs for Arizona AVAs
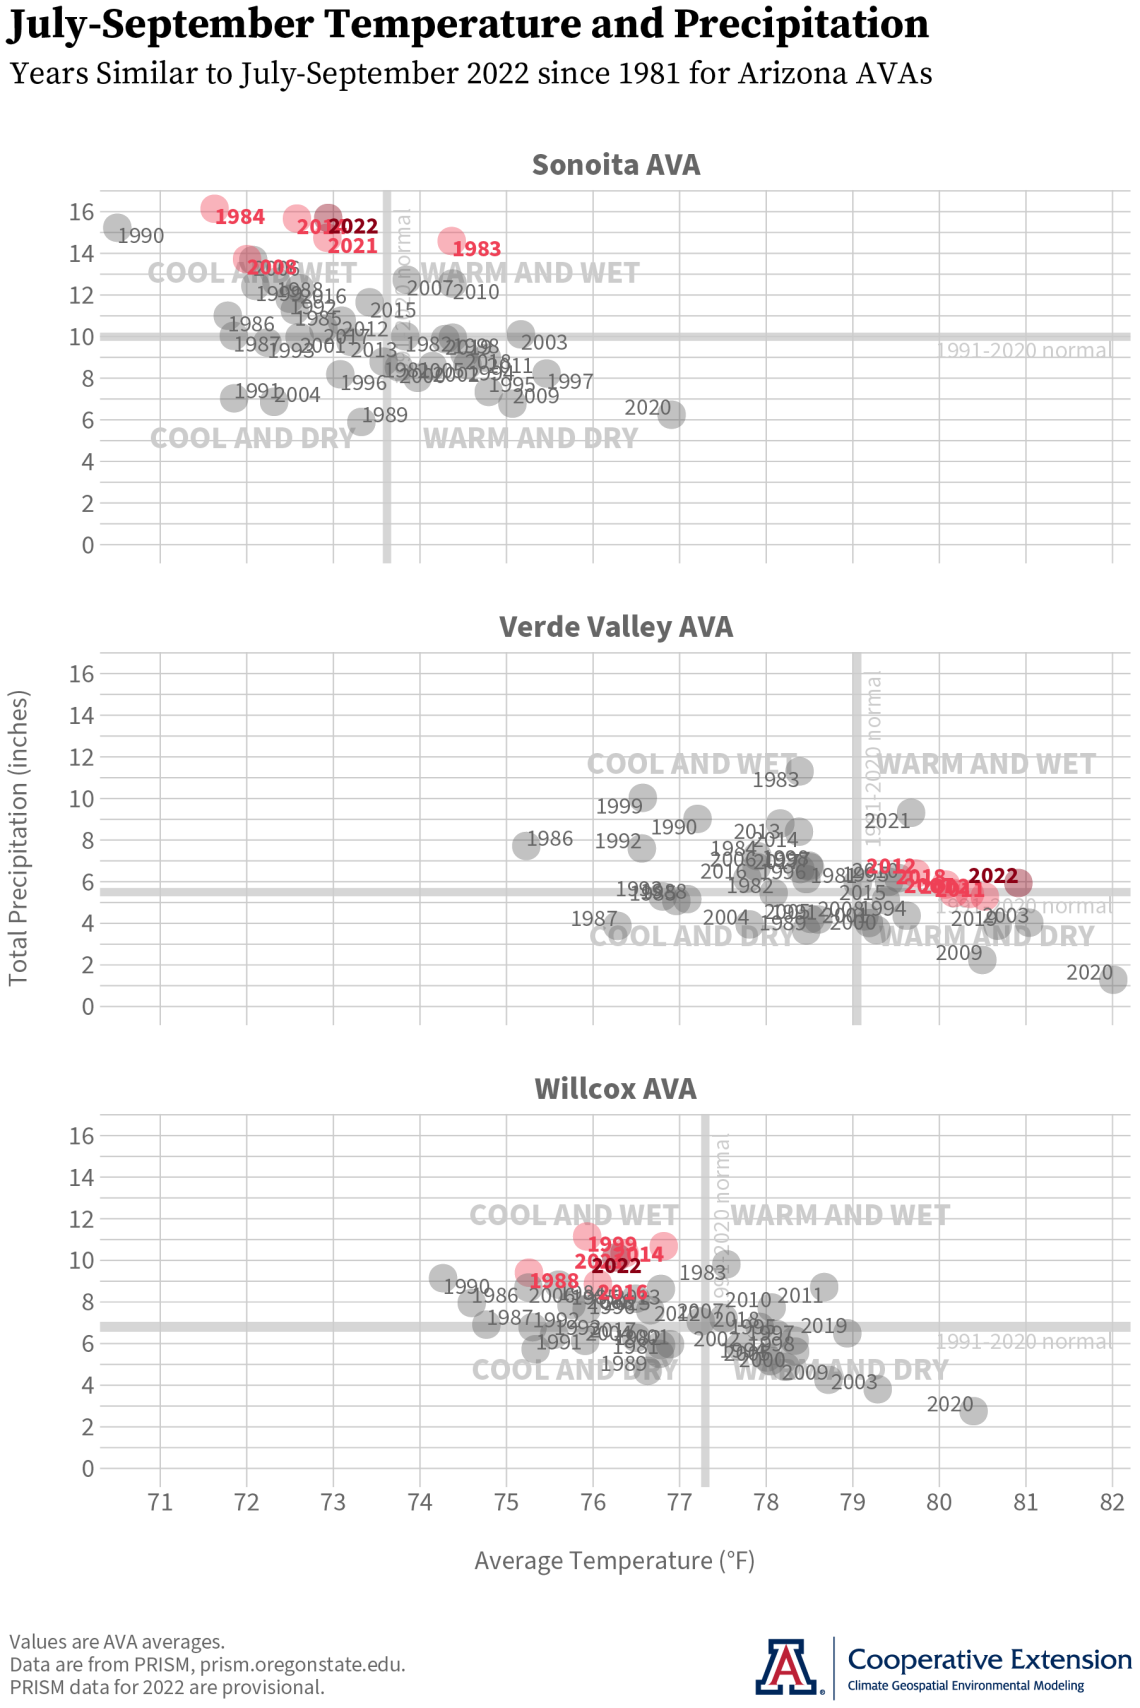
The focus of this topic at this time of the year is the July-through-October time frame, the part of the growing season when the climatic differences between the three Arizona AVAs really show. This month, we compare temperature and precipitation data from July, August, and September 2022 with that of previous years.
Average temperature and total precipitation during these three months this year place both the Sonoita and Willcox AVAs in the cooler- and wetter-than-normal part of their respective graphs (dark red dots in upper-left quadrants). Corresponding AVA-wide values for the Sonoita AVA are 72.9 °F and 15.7 inches, and 76.3 °F and 10.1 inches for the Willcox AVA. In contrast, average temperature and total precipitation for the Verde Valley AVA are warmer than and near normal, respectively, with corresponding values of 80.9 °F and 5.9 inches. As all three AVAs, particularly the Sonoita AVA, encompass areas of relatively higher elevation where temperature typically is lower and precipitation typically is higher, we wouldn’t be surprised if such values for vineyards at relatively lower elevations are warmer and drier than the numbers here.
Given these conditions, the closest analog years (light red dots) for the July-September period in 2022 are:
1983, 1984, 2008, 2014, and 2021 for the Sonoita AVA
2002, 2007, 2011, 2012, and 2018 for the Verde Valley AVA
1988, 1999, 2014, 2016, and 2021 for the Willcox AVA
One thing to note from these lists is that 2021 has appeared as an analog year for the Sonoita and Willcox AVAs in this analysis for the newsletter both this month and last. This might suggest that ripening conditions and the effects they have on fruit quality are generally similar for vintages both this year and last. We take a closer look at this topic in the following section.
cvn-202210-ava-analogs-2022-10-03.png
Temperature Ranges and the Ripening Period
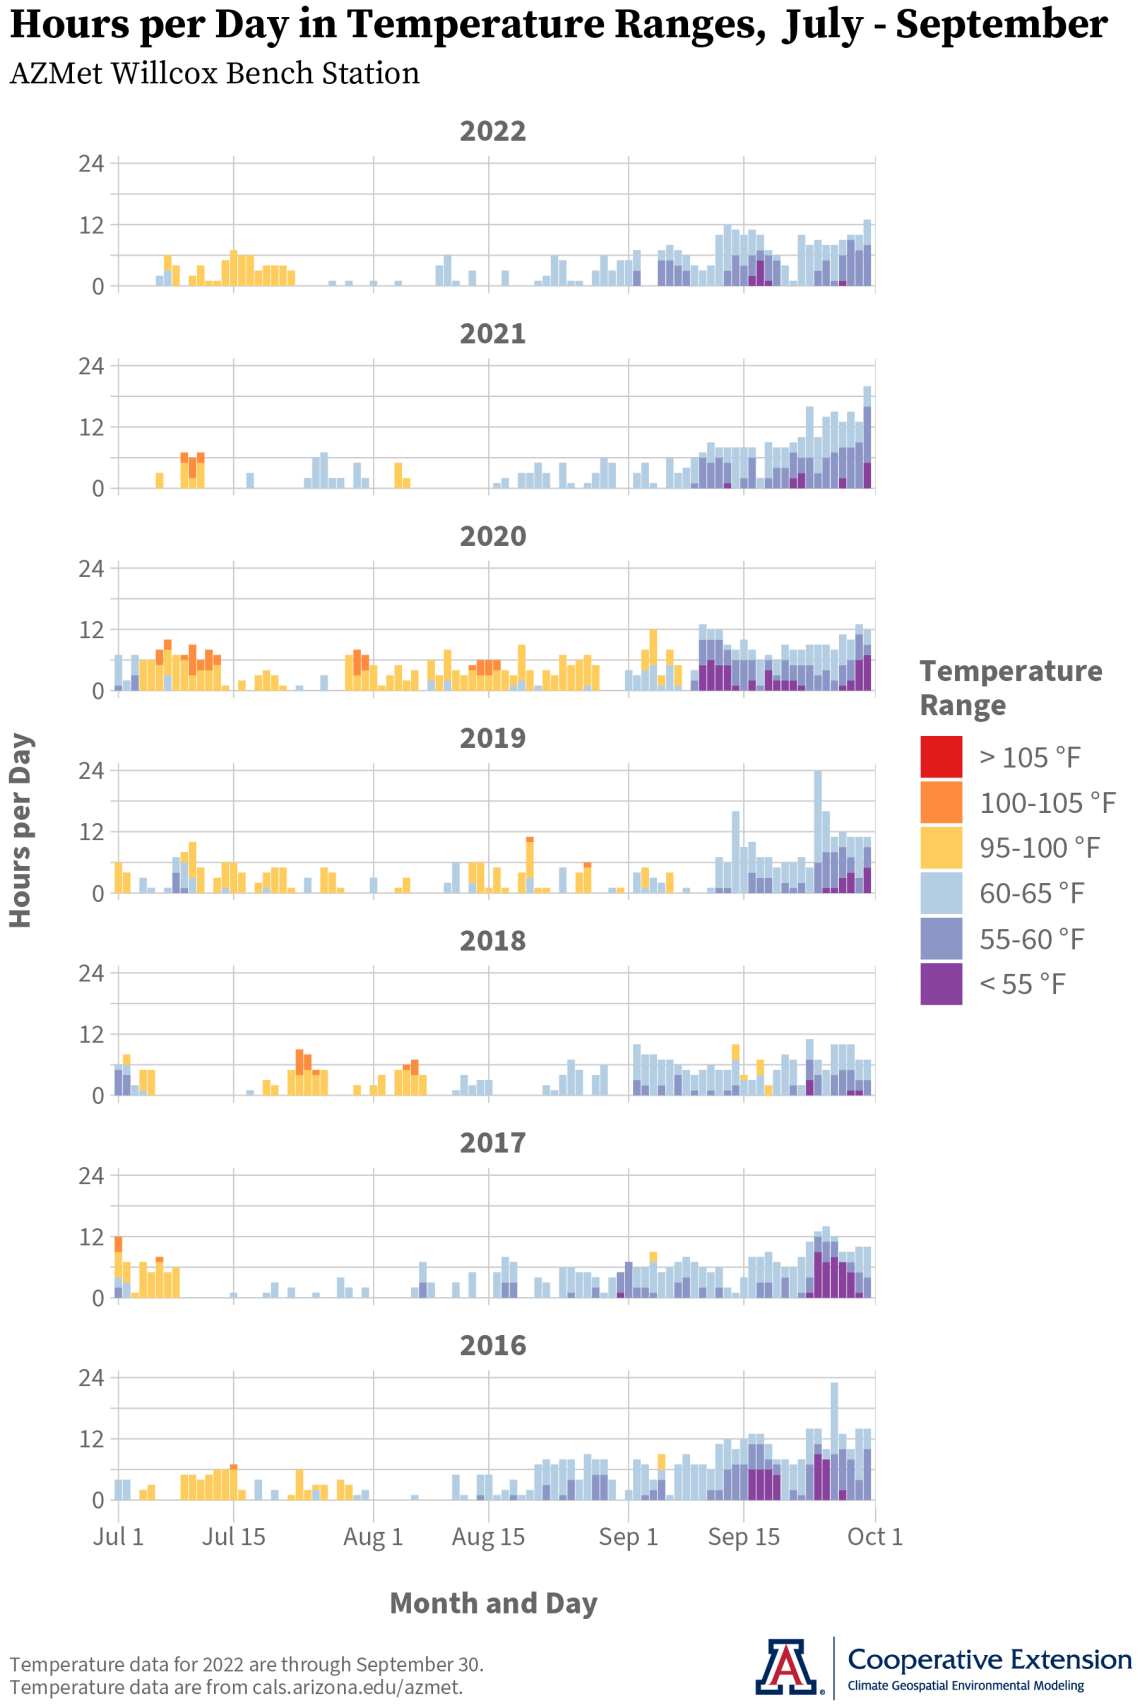
To the extent that exposure to temperatures below 65 °F and above 95 °F affect fruit quality, ripening conditions in 2022 have been like those during 2021. This is the case at least at the AZMet Willcox Bench station in the south-central Willcox AVA. Analysis of such conditions during July, August, and September in previous growing seasons also suggests 2017 and 2016 as similar years.
The general pattern these years share is that relatively high temperatures, whether afternoon maximums between 95 and 105 °F (yellow and orange bars on graph) or early morning minimums above 65 °F (lack of blue and purple bars on graph), were almost entirely confined to July and the first half of August. Potential effects of such conditions on fruit quality include a decrease of anthocyanins in red-berry varieties and an increase of malic acid metabolism, respectively. In the second half of August and throughout September during these years, afternoon maximums did not go above the 95 °F threshold, except for one day in both 2016 and 2017, but did go below the 65 °F threshold almost every day. This general pattern contrasts with the one in 2020, 2019, and 2018, in which relatively high maximum and minimum temperatures persisted throughout August.
For 2022, 2021, and 2016, the relative lack of heat had a lot to do with greater humidity, cloudiness, and rainfall brought about in large part by the North American monsoon. While the relatively cooler minimum temperatures during these years may have helped fruit retain acidity and have a lower pH as less malic acid is metabolized during respiration, the above-average rainfall may not have. As noted in a previous newsletter issue, our initial analyses of Arizona Vignerons Alliance data between 2009 and 2018 for the three Arizona AVAs suggest that greater precipitation correlates with higher pH values. We’ll continue to untangle these influences on fruit quality and discuss this information with you.
The Water Resources Research Center at the University of Arizona recently published a Water Factsheet for Cochise County, which is where about three-quarters of the Willcox AVA is located. The factsheet includes topics like supply and demand, as well as management challenges and opportunities.
The University of Arizona Cooperative Extension- and the Tucson forecast office of the National Weather Service-led workshop in early October on climate information for agriculture and natural resources management in southeastern part of the state has been cancelled. Look for this in-person and remote hybrid-format event to be rescheduled for late 2022 or early 2023.
A rare La Niña three-peat this coming fall and winter looks more likely than it did a month ago. There is a 91 % chance that still-current La Niña conditions will persist through November, and a 54 % chance that they continue through the January-March 2023 period. This is the most recent official forecast for ENSO, or El Niño Southern Oscillation, parts of the atmosphere and ocean across the tropical Pacific Ocean that cause El Niño and La Niña events.
The monsoon this year improved drought conditions for many areas in Arizona and has curbed wildland fire conditions in the state. There is a normal potential this month for significant wildland fires for all of Arizona.
For those of you in southeastern Arizona, including the Sonoita and Willcox AVAs, Cooperative Extension manages an email listserv in coordination with the Tucson forecast office of the National Weather Service to provide information in the days leading up to agriculturally important events, like heavy rainfall from remnants of tropical cyclones and early fall freezes. Please contact us if you'd like to sign up.
And for those of you in north-central and northeastern Arizona, including the Verde Valley AVA, Cooperative Extension also now manages an email listserv in coordination with the Flagstaff forecast office of the National Weather Service to provide similar information for this part of the state. Please contact us if you'd like to sign up.
Undergraduate students in the College of Agriculture and Life Sciences at the University of Arizona are looking for internships with businesses and companies in the viticulture and winery industries during 2022. Please contact Danielle Buhrow, Senior Academic Advisor and Graduate Program Coordinator in the Department of Agricultural and Resource Economics, for more information.
Please feel free to give us feedback on this issue of the Climate Viticulture Newsletter, suggestions on what to include more or less often, and ideas for new topics.
Did someone forward you this newsletter? Please contact us to subscribe.
Have a wonderful October!
With current and past support from:

