
Climate Viticulture Newsletter - 2023 August
< Back to Climate Viticulture Newsletter
Hello, everyone!
This is the August 2023 issue of the Climate Viticulture Newsletter – a quick look at some timely climate topics relevant to wine grape growing in Arizona.
July Recap | August Outlook | Temperature Ranges and Ripening | Extra Notes
A Recap of July Temperature and Precipitation
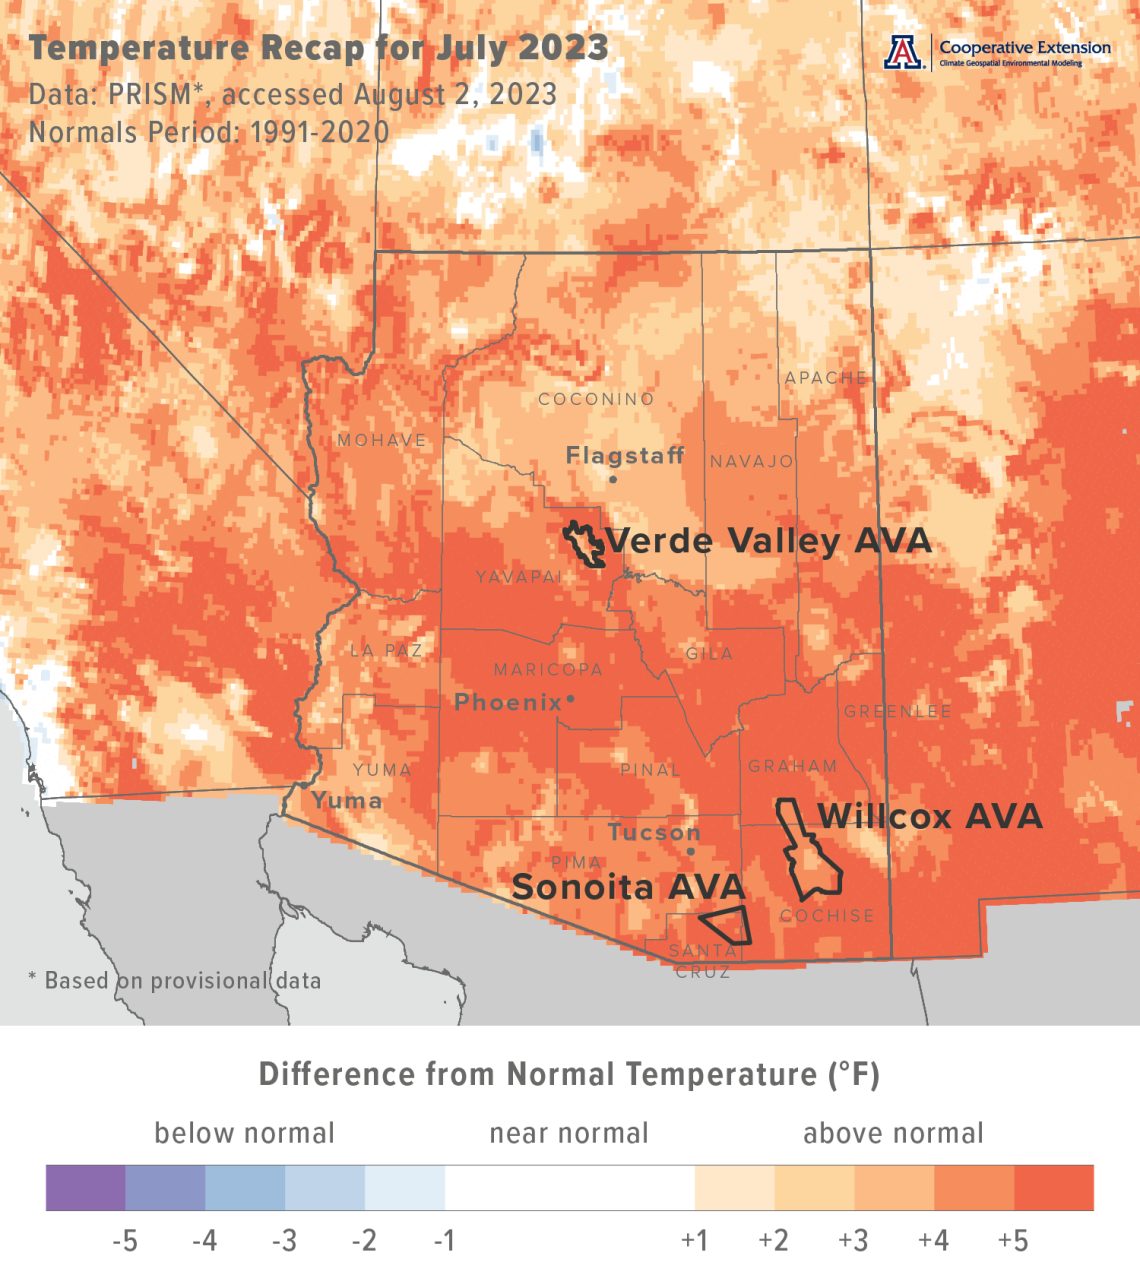
Monthly average temperatures were 3 to 5 °F above the 1991-2020 normal for much of the northern half and southwestern corner of Arizona, including the Verde Valley AVA, as well as scattered locations in other parts of the state, including the Willcox AVA (light burnt orange and burnt orange areas on map). Much of the southeastern and central parts of Arizona were more than 5 °F above normal, including most of the Sonoita AVA (dark burnt orange areas on map). For reference, monthly temperatures in July last year were within 2 °F of normal for much of the state.
Area-average maximum and minimum temperatures during July 2023 were 96.1 and 66.4 °F for the Sonoita AVA, 104.0 and 69.2 °F for the Verde Valley AVA, and 100.4 and 67.3 °F for the Willcox AVA. Respective July normals are 88.5 and 62.8 °F, 98.1 and 66.0 °F, and 93.6 and 64.9 °F.
The last time we experienced widespread and long-duration record heat during the summer was 2020. Area-average maximum and minimum temperatures during July that year were 91.2 and 65.1 °F for the Sonoita AVA, 100.9 and 66.7 °F for the Verde Valley AVA, and 97.2 and 66.7 °F for the Willcox AVA.
Please let us know if there have been impacts to your vineyard from the record heat so far this summer.
cvn-recap-202308-tmeanDepartureNormal.png
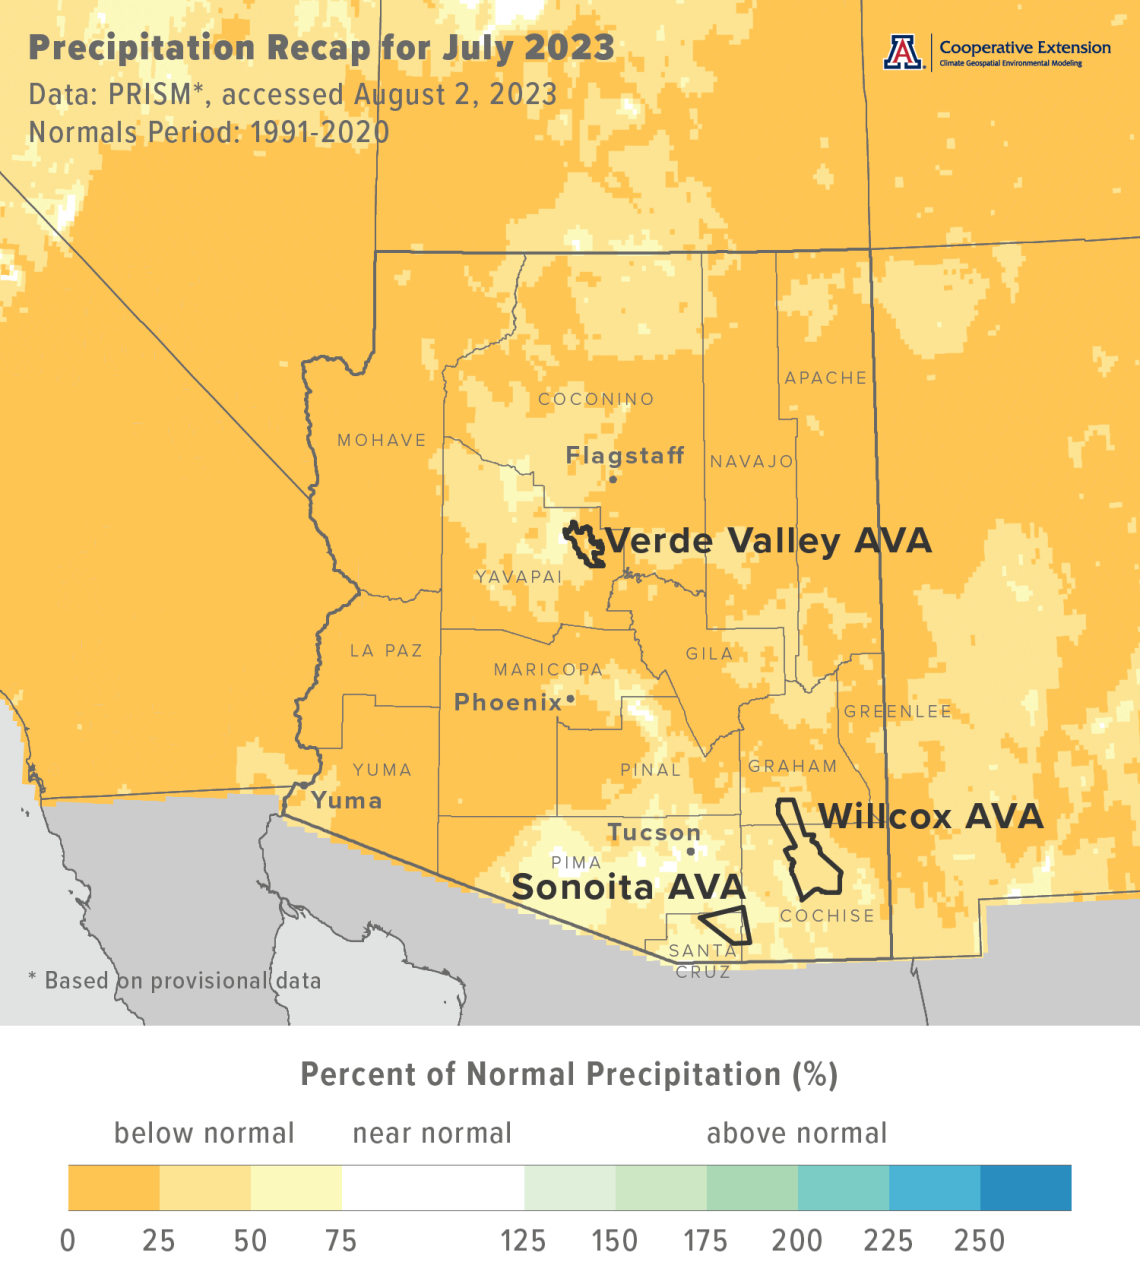
Monthly precipitation totals were between 25 and 75 % of normal for many locations in north-central, extreme south-central, and southeastern Arizona, including the Sonoita and Willcox AVAs (light yellow and yellow areas on map). Otherwise across the state, most locations measured less than 25 % of normal rainfall, including much of the Verde Valley AVA (dark yellow areas on map). Precipitation during July 2022 was near or above normal for almost all of the state.
Area-average total precipitation in July 2023 was 2.12 inches for the Sonoita AVA, 0.40 inches for the Verde Valley AVA, and 1.08 inches for the Willcox AVA. Respective July normals are 4.06, 1.75, and 2.67 inches.
The hotter- and drier-than-normal conditions last month drove total reference evapotranspiration values for July to 8.5 and 9.2 inches for the AZMet Bonita and Willcox Bench stations in the Willcox AVA, respectively. Those values bring respective growing season totals to 31.2 and 33.6 inches. Total precipitation from April through July, in contrast, is 0.13 at Bonita and 0.60 inches at Willcox Bench.
The relatively drier conditions last month also remind us of the 2020 growing season. Area-average total precipitation in July 2020 was 2.77 inches for the Sonoita AVA, 0.64 inches for the Verde Valley AVA, and 1.17 inches for the Willcox AVA.
Dig into daily weather summaries from 2023 for the AZMet Bonita and Willcox Bench stations in the Willcox AVA
View seasonal summaries of monsoon rainfall through maps and weather station summaries
Learn more about PRISM climate data
cvn-recap-202308-pptPercentNormal.png
The Outlook for August Temperature and Precipitation
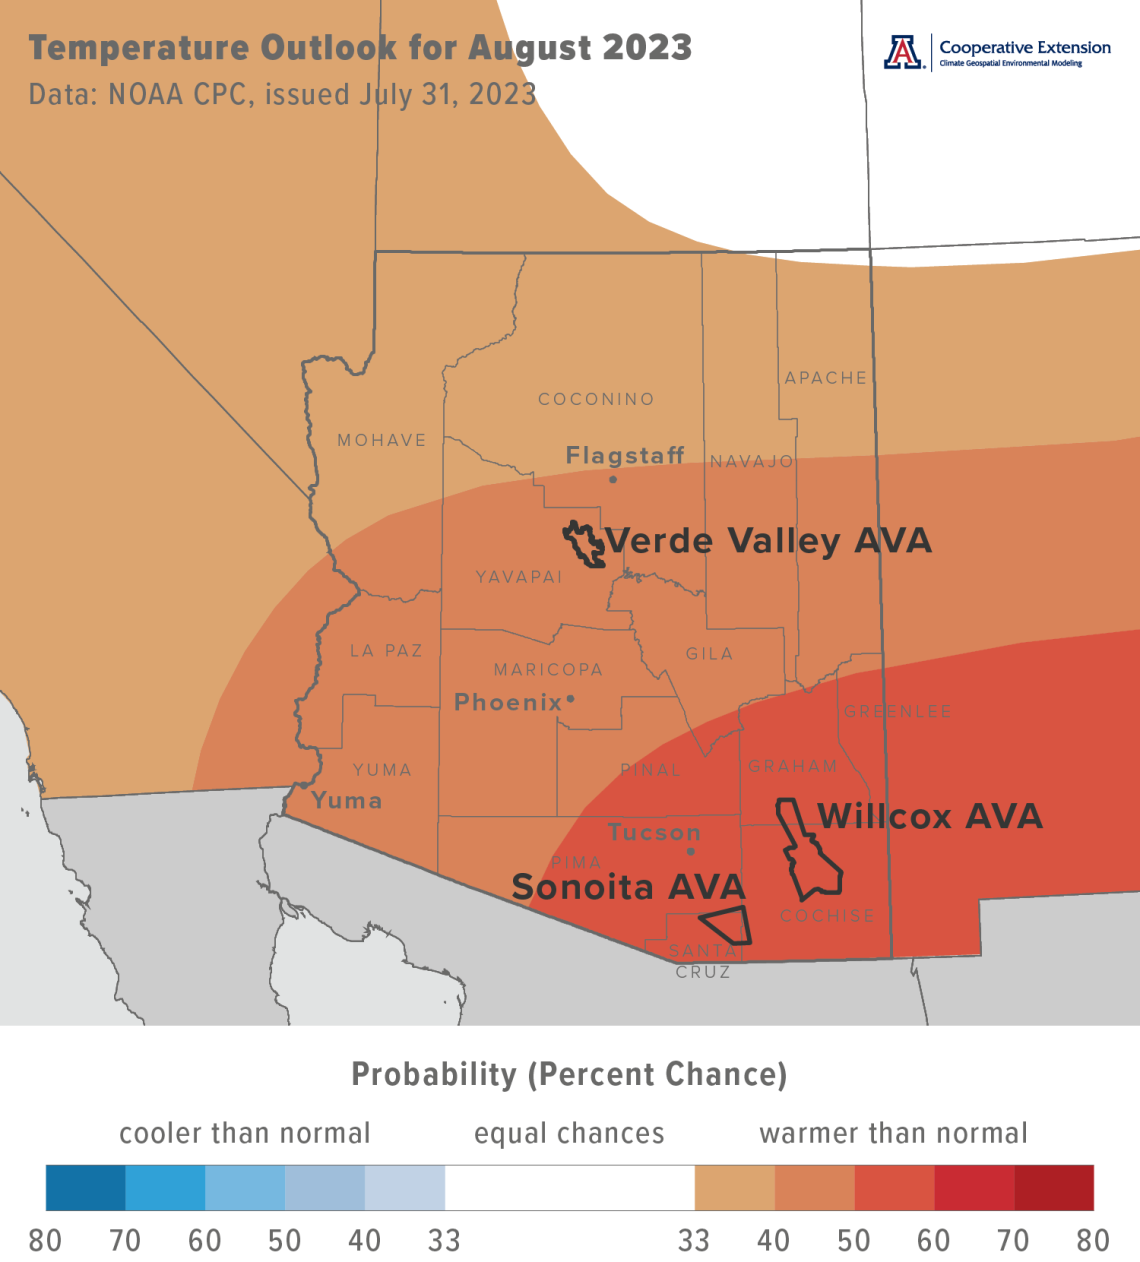
Temperatures over the course of this month have a moderate increase in chances for being above the 1991-2020 normal across southeastern Arizona (dark orange area on map). For the rest of the state, there is a slight increase in chances for above-normal temperatures (light orange and orange areas on map). Monthly temperatures in August last year were within 2 °F of normal for much of the state except for part of southeastern Arizona, where temperatures were 2 to 4 °F below normal.
Area-average maximum and minimum temperatures during August 2022 were 82.8 and 61.8 °F for the Sonoita AVA, 95.6 and 66.3 °F for the Verde Valley AVA, and 87.6 and 64.2 °F for the Willcox AVA. Respective August normals are 86.3 and 61.7 °F, 95.7 and 65.2 °F, and 91.2 and 63.8 °F.
cvn-outlook-202308-temp.png
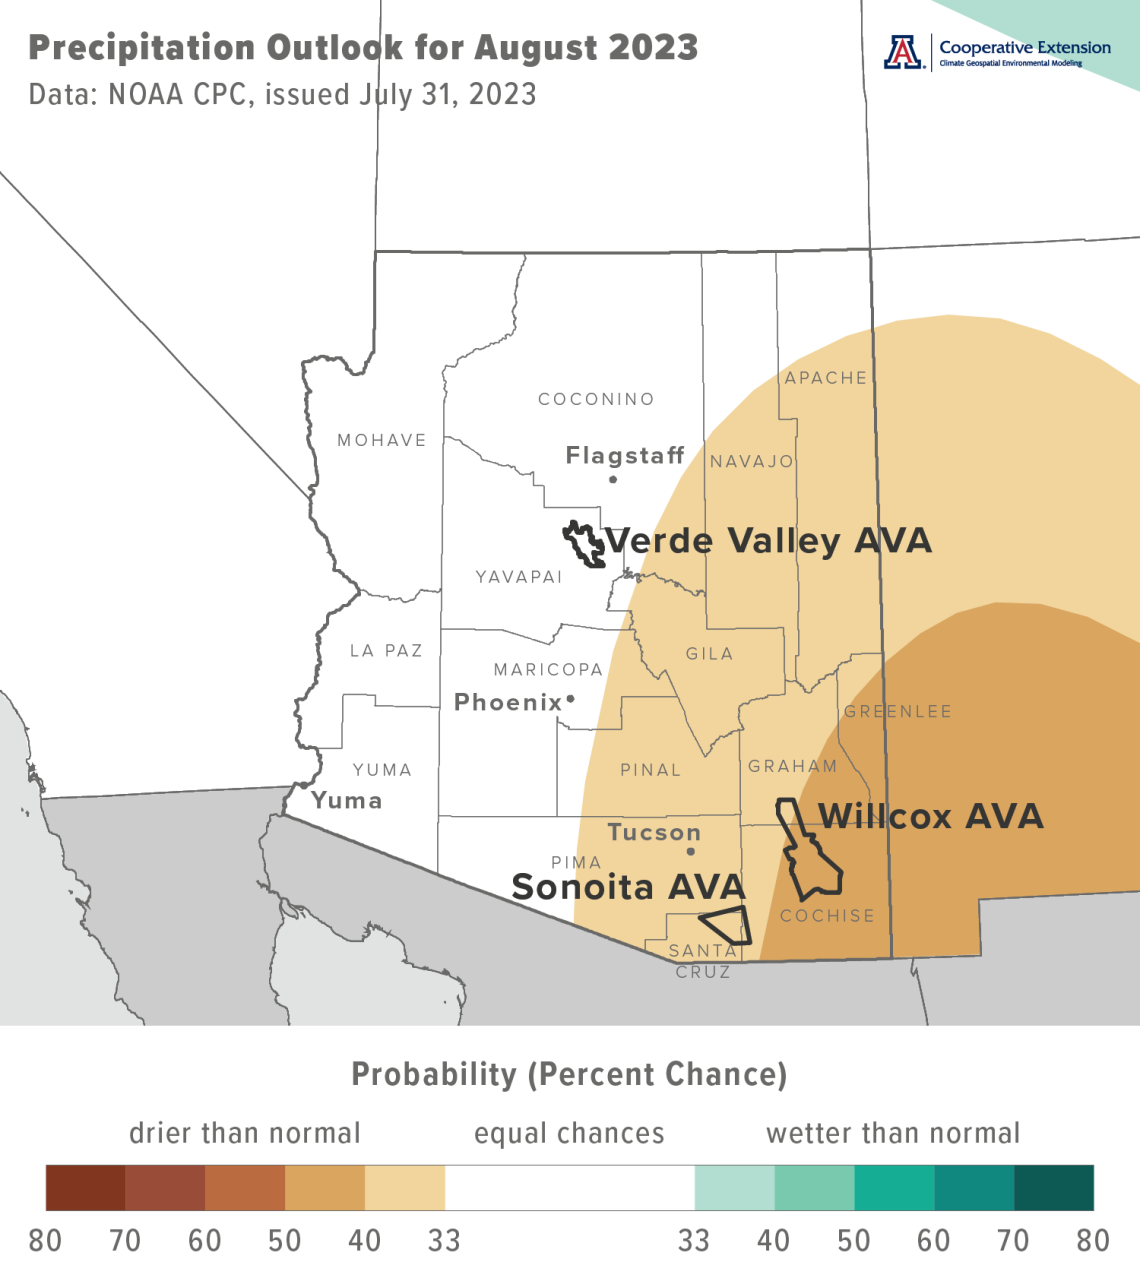
Precipitation totals for this month have a slight increase in chances for being below normal across the east-central and southeastern parts of the state (light tan and tan areas on map). For the rest of Arizona, there are equal chances for below-, near-, or above-normal totals (white area on map). Many locations across the state measured amounts more than 150 % of normal during August 2022 due to an active monsoon.
Area-average precipitation totals in August 2022 were 7.68 inches for the Sonoita AVA, 2.38 inches for the Verde Valley AVA, and 6.19 inches for the Willcox AVA. Respective August normals are 3.95, 2.40, and 2.80 inches.
Being half-way through the 2023 monsoon and with the above outlook in mind, we have an idea of how ripening conditions will be relative to recent years, and what some possible impacts will be to vineyards and fruit. Those from 2020 likely come to mind. In terms of monsoon hedging, or having a variety lineup and adaptability in the winery to limit losses from unfavorable conditions at this time of the growing season, we wonder if hedges for hot-and-dry vintages help this year. Please let us know if varietal characteristics like maintaining pH under high temperatures or decisions between early and late picks are making a positive difference.
To stay informed of long-range temperature and precipitation possibilities beyond the coverage of a standard weather forecast, check in, too, with the six-to-ten-day outlook and eight-to-fourteen-day outlook issued daily by NOAA’s Climate Prediction Center.
cvn-outlook-202308-prcp.png
Temperature Ranges and the Ripening Period
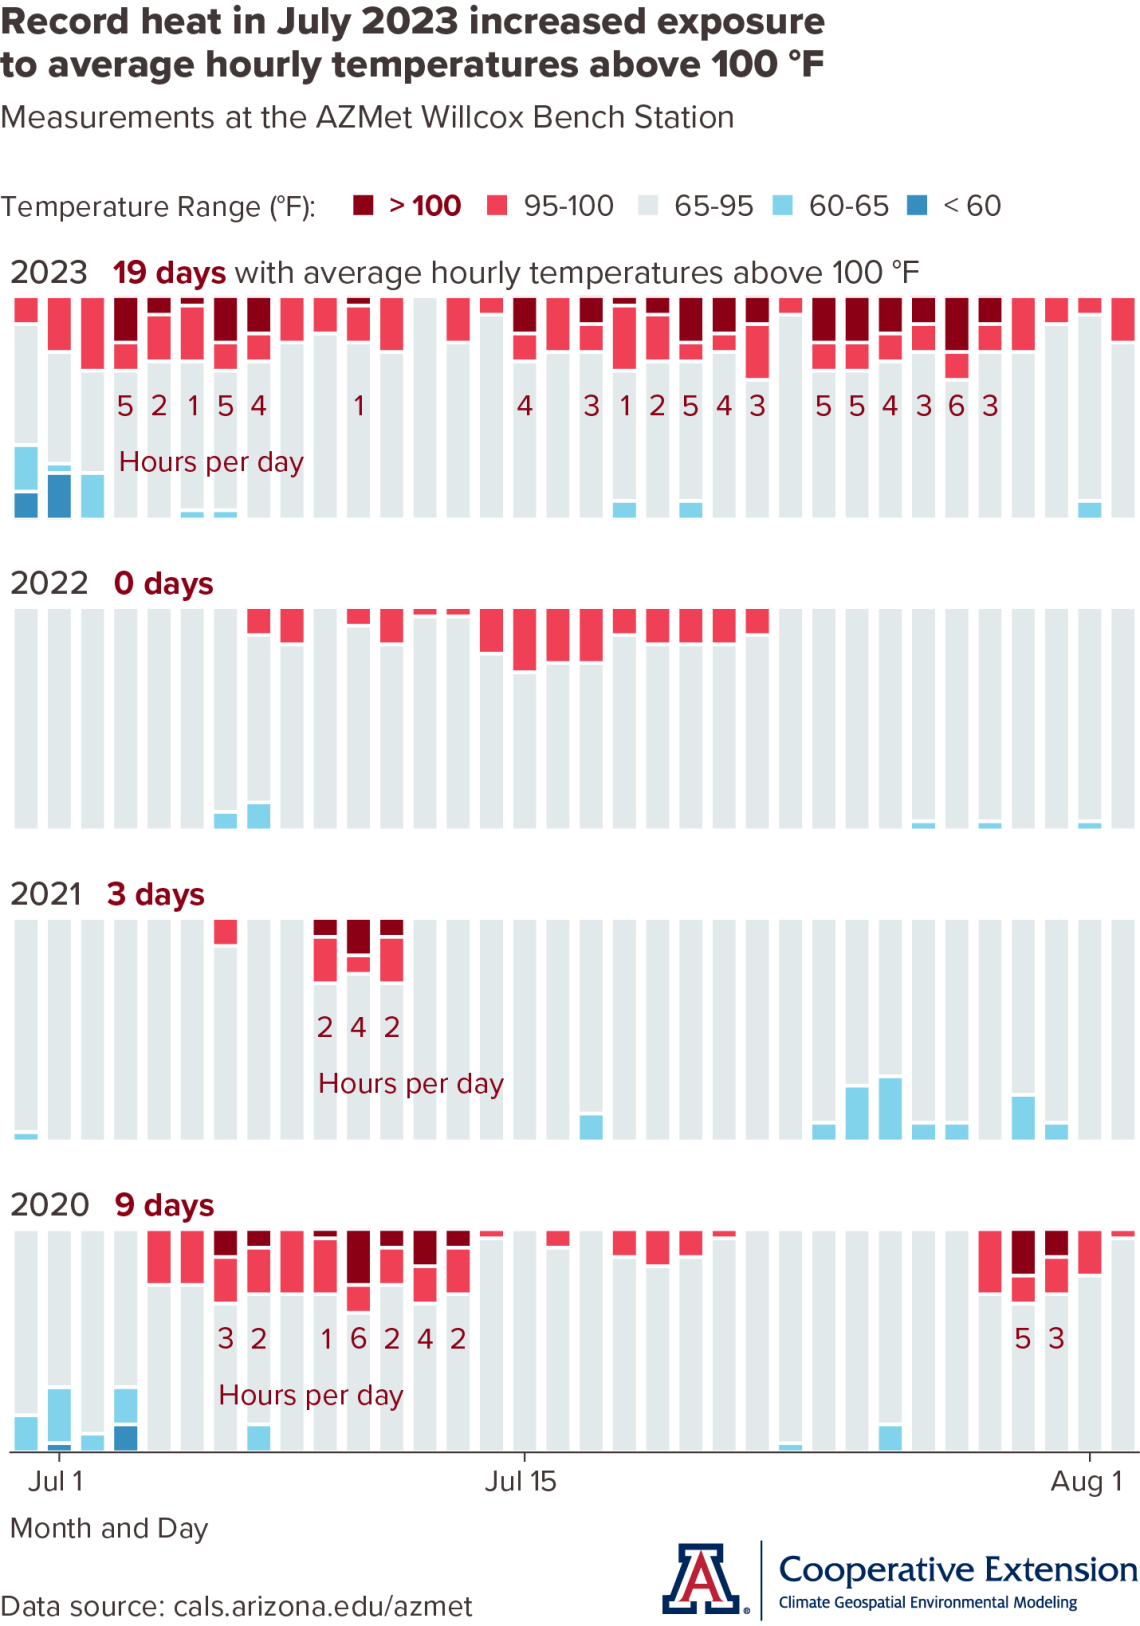
Now that the ripening period has started, we return to tracking hours of temperatures below 65 °F and above 95 °F. The reason why is that temperatures affect fruit quality through both early morning minimums and afternoon maximums as fruit ripens. With the former, for example, morning minimums above 65 °F can increase malic acid metabolism and lead to berries with a higher pH. With the latter, afternoon maximums above 95 °F can slow and eventually stop photosynthesis, along with fruit ripening, as well as degrade anthocyanins, particularly in red-berry varieties.
With data from the AZMet Willcox Bench station in the Willcox AVA, the record heat last month led to 19 days with average hourly temperatures over 100 °F, for a total of 66 hours (dark red bars on top graph). The highest average hourly temperature was 104.7 °F on July 20. Temperatures between 95 and 100 °F occurred on 30 days, for a total of 123 hours (light red bars on top graph). In contrast, there were seven days with temperatures below 65 °F, with measurements below 60 °F on only one day. During these, 12 hours were between 60 and 65 °F (light blue bars on top graph), and five hours were below 60 °F (dark blue bars on top graph). The lowest average hourly temperature was 53.4 °F on July 1.
Although data collection at the AZMet Willcox Bench station starts in June 2016, we only compare measurements from this year to the previous three as, before this year anyhow, temperature and precipitation from those three growing seasons represented the overall range, or endpoints, of conditions experienced in recent decades. Exposure to high temperatures so far in 2023 is greater than that in 2022 and 2021 (middle two graphs), and more like what we measured in 2020 (bottom graph). All else equal, we would expect ripening and measures of fruit quality affected by heat to vary in a similar fashion.
Of course, we’re reporting temperatures measured by a shaded thermometer at an AZMet station near several vineyards. Actual canopy temperatures and shaded clusters likely are lower due to evaporative cooling from vine photosynthesis, while those of unshaded clusters higher due to direct mid-day and afternoon sunlight, in particular. Nonetheless, recent temperatures bring canopy management to mind as a tool to help address record heat like we’ve had this summer.
Extra Notes
Based in part on recent hot and dry conditions, there is an above-normal potential this month for significant wildland fires from west-central to east-central Arizona. Elsewhere across the state, potential is near normal..
If you’re looking to learn more about climate change and wine growing, we can recommend you read an accessible and factually correct mass-media article that recently crossed our desk. Neither pessimistic nor pollyanna, it touches upon several aspects of the issue from global to vineyard scales. And although its focus is on Europe, there are many topics like high temperatures and fruit composition that apply worldwide, including Arizona.
The now-present El Niño event currently is weak, but is likely to strengthen as we approach winter, when its influence on regional temperature and precipitation is potentially at its greatest. Nonetheless, El Niño events also can lead to conditions during autumn that favor above-normal hurricane activity in the eastern Pacific Ocean. As we know, tropical cyclones that form to our south can be a source of moisture and rainfall for the Southwest.
For those of you in southeastern Arizona, including the Sonoita and Willcox AVAs, Cooperative Extension manages an email listserv in coordination with the Tucson forecast office of the National Weather Service to provide information in the days leading up to agriculturally important events, like record heat and monsoon outbreaks. Please contact us if you'd like to sign up.
And for those of you in north-central and northeastern Arizona, including the Verde Valley AVA, Cooperative Extension also now manages an email listserv in coordination with the Flagstaff forecast office of the National Weather Service to provide similar information for this part of the state. Please contact us if you'd like to sign up.
Undergraduate students in the College of Agriculture and Life Sciences at the University of Arizona are looking for internships with businesses and companies in the viticulture and winery industries. Please contact Danielle Buhrow, Senior Academic Advisor and Graduate Program Coordinator in the Department of Agricultural and Resource Economics, for more information.
Please feel free to give us feedback on this issue of the Climate Viticulture Newsletter, suggestions on what to include more or less often, and ideas for new topics.
Did someone forward you this newsletter? Please contact us to subscribe.
Have a wonderful August!
With current and past support from:

